

Pathway Enrichment Analysis of Microarray Data Fom Human Penis of Diabetic and Peyronie's Patients, in Comparison With Diabetic Rat Erectile Dysfunction Models
- PMID: 34838480
- PMCID: PMC9172970
- DOI: 10.1016/j.jsxm.2021.10.004
Pathway Enrichment Analysis of Microarray Data Fom Human Penis of Diabetic and Peyronie's Patients, in Comparison With Diabetic Rat Erectile Dysfunction Models
Abstract
Background: Erectile dysfunction (ED) is a debilitating medical condition in which current treatments are minimally effective in diabetic patients due to neuropathy of the cavernous nerve, a peripheral nerve that innervates the penis. Loss of innervation causes apoptosis of penile smooth muscle, remodeling of corpora cavernosa (penile erectile tissue) morphology, and ED.
Aim: In this study, microarray and pathway analysis were used to obtain a global understanding of how signaling mechanisms are altered in diabetic patients and animal models as ED develops, in order to identify novel targets for disease management, and points of intervention for clinical therapy development.
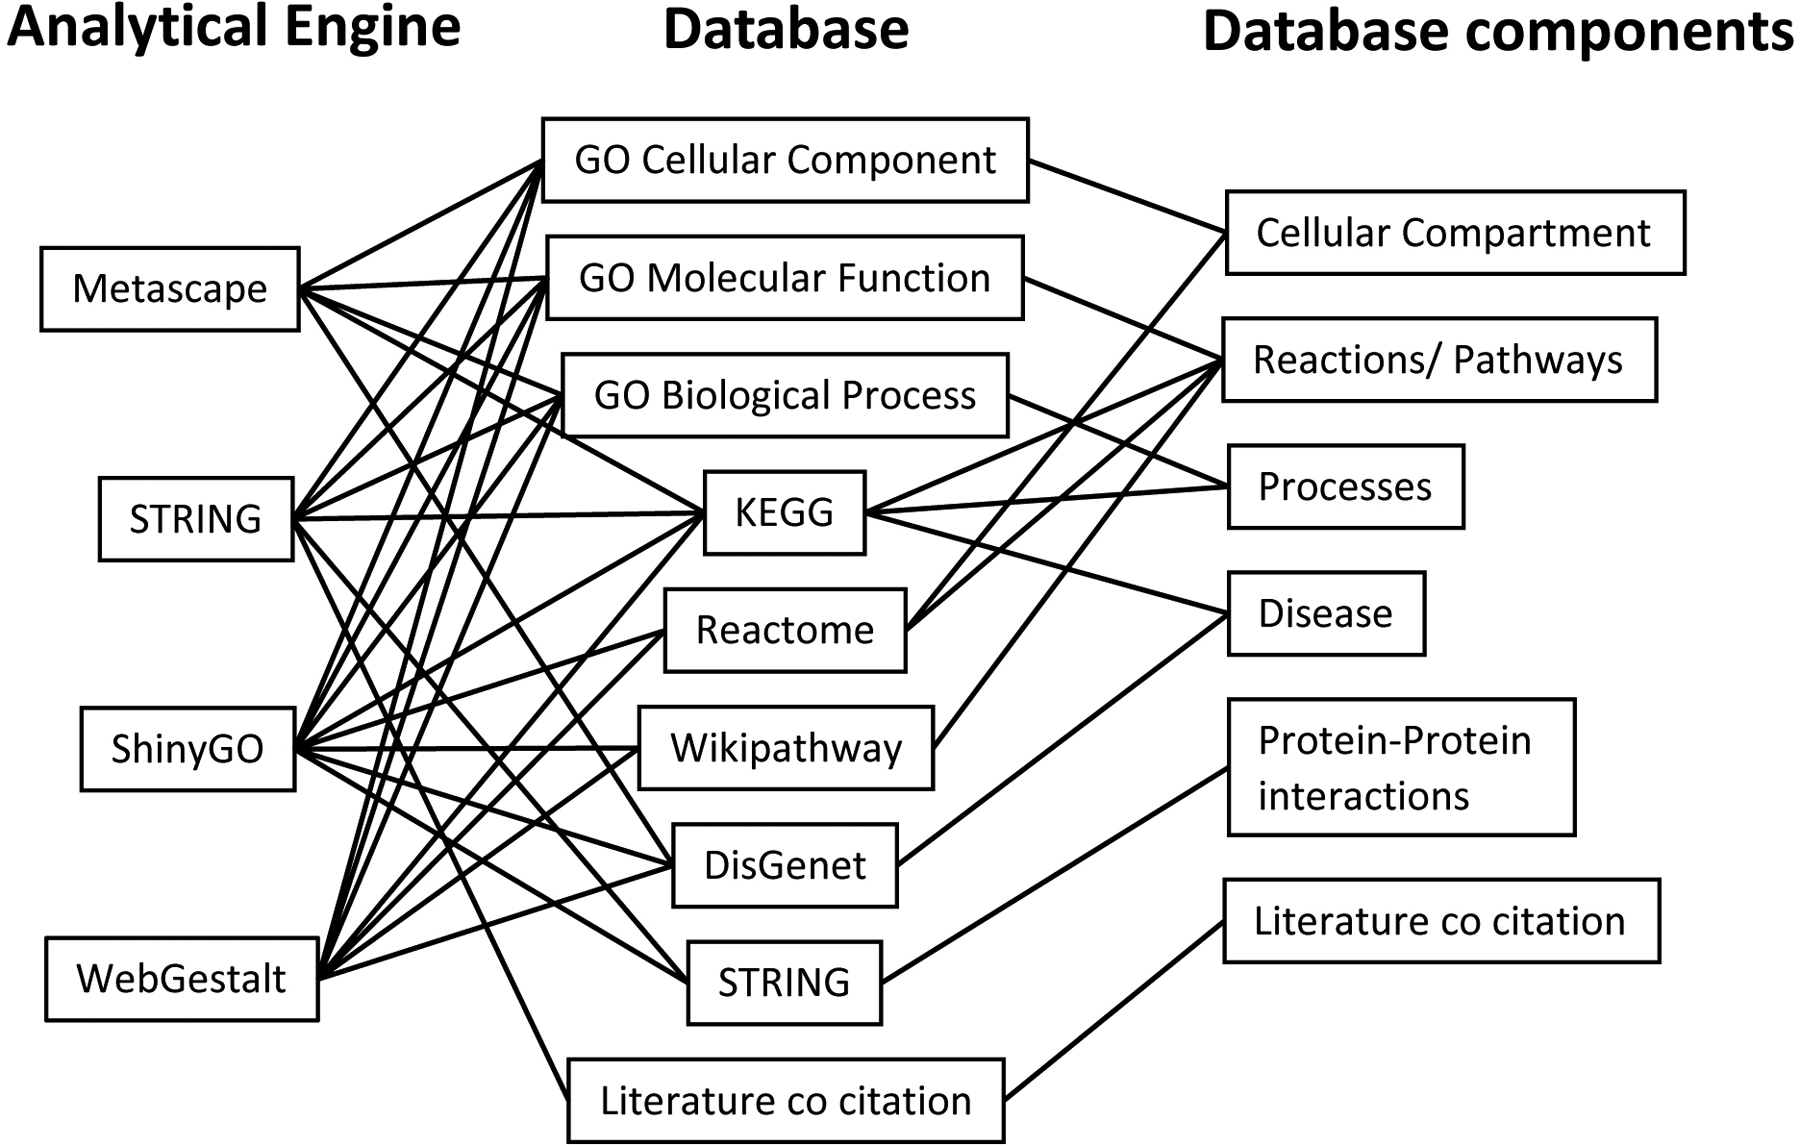
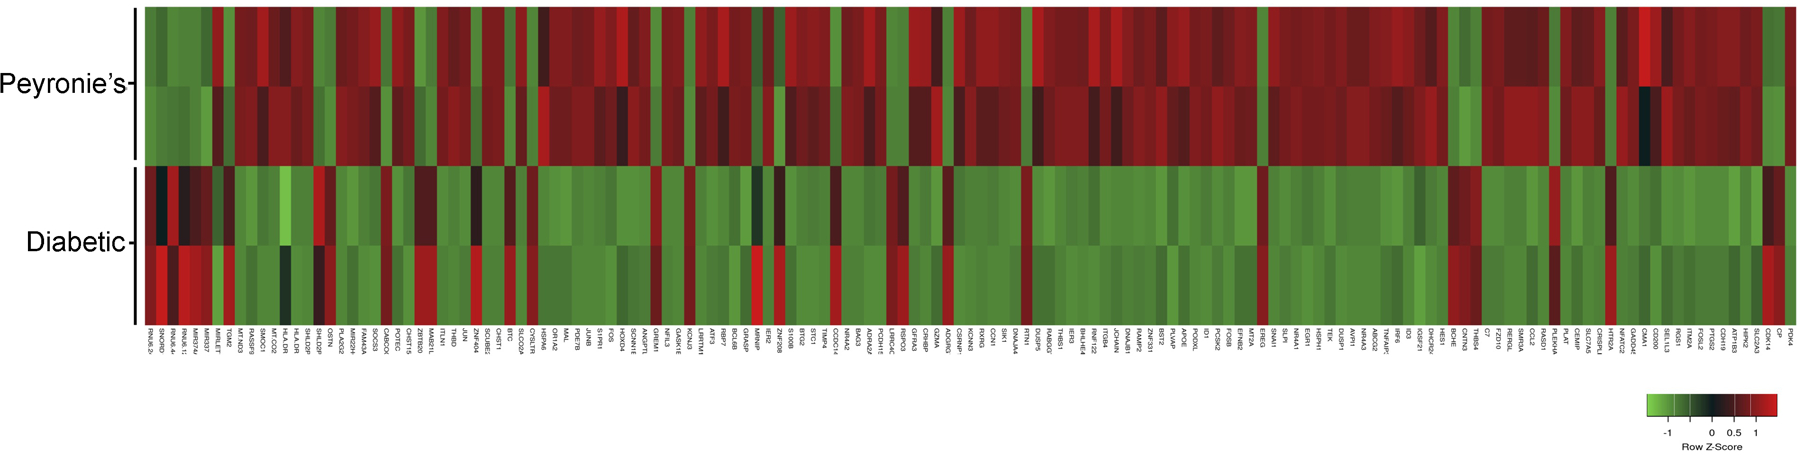
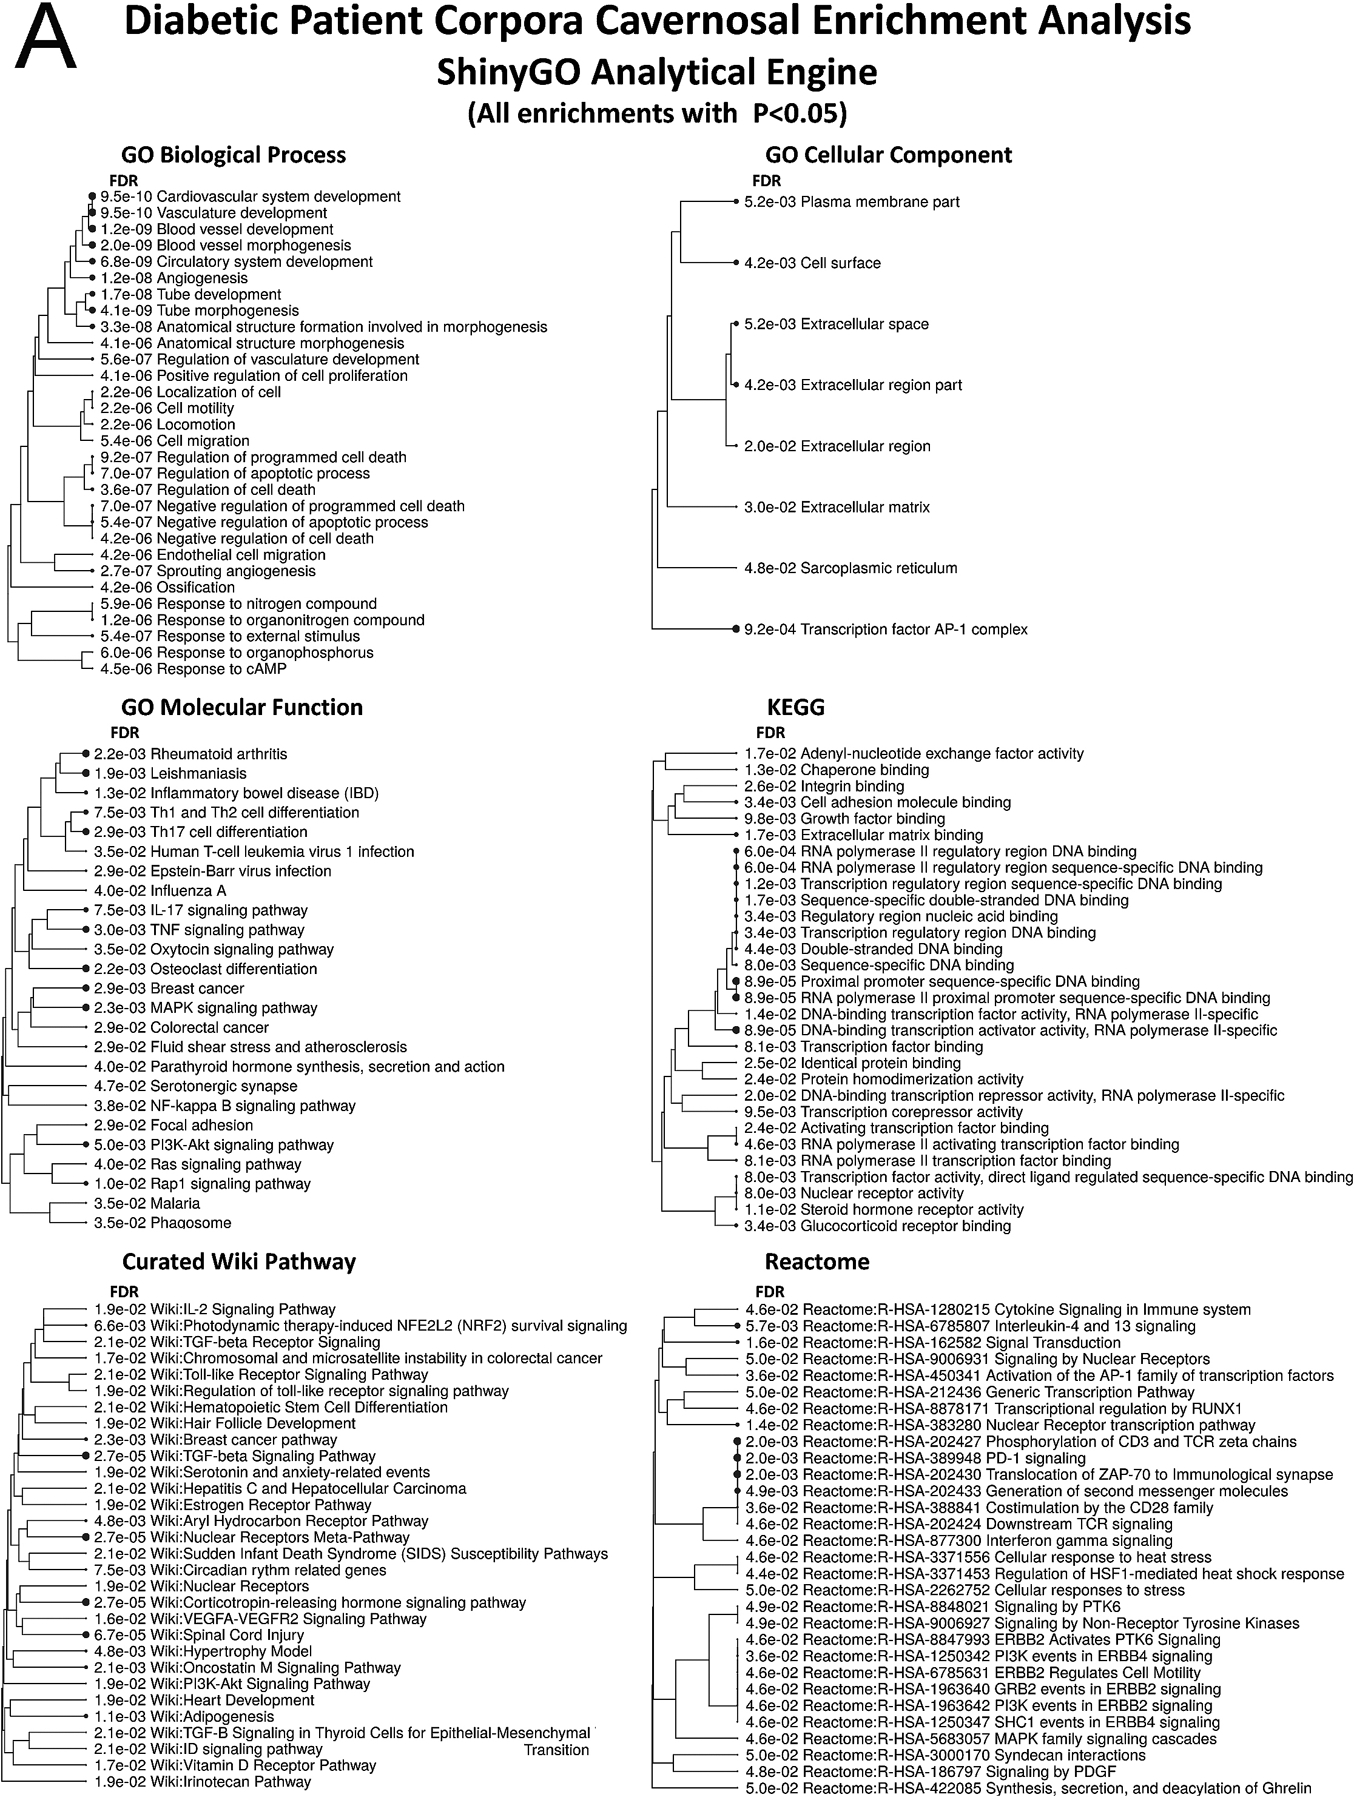
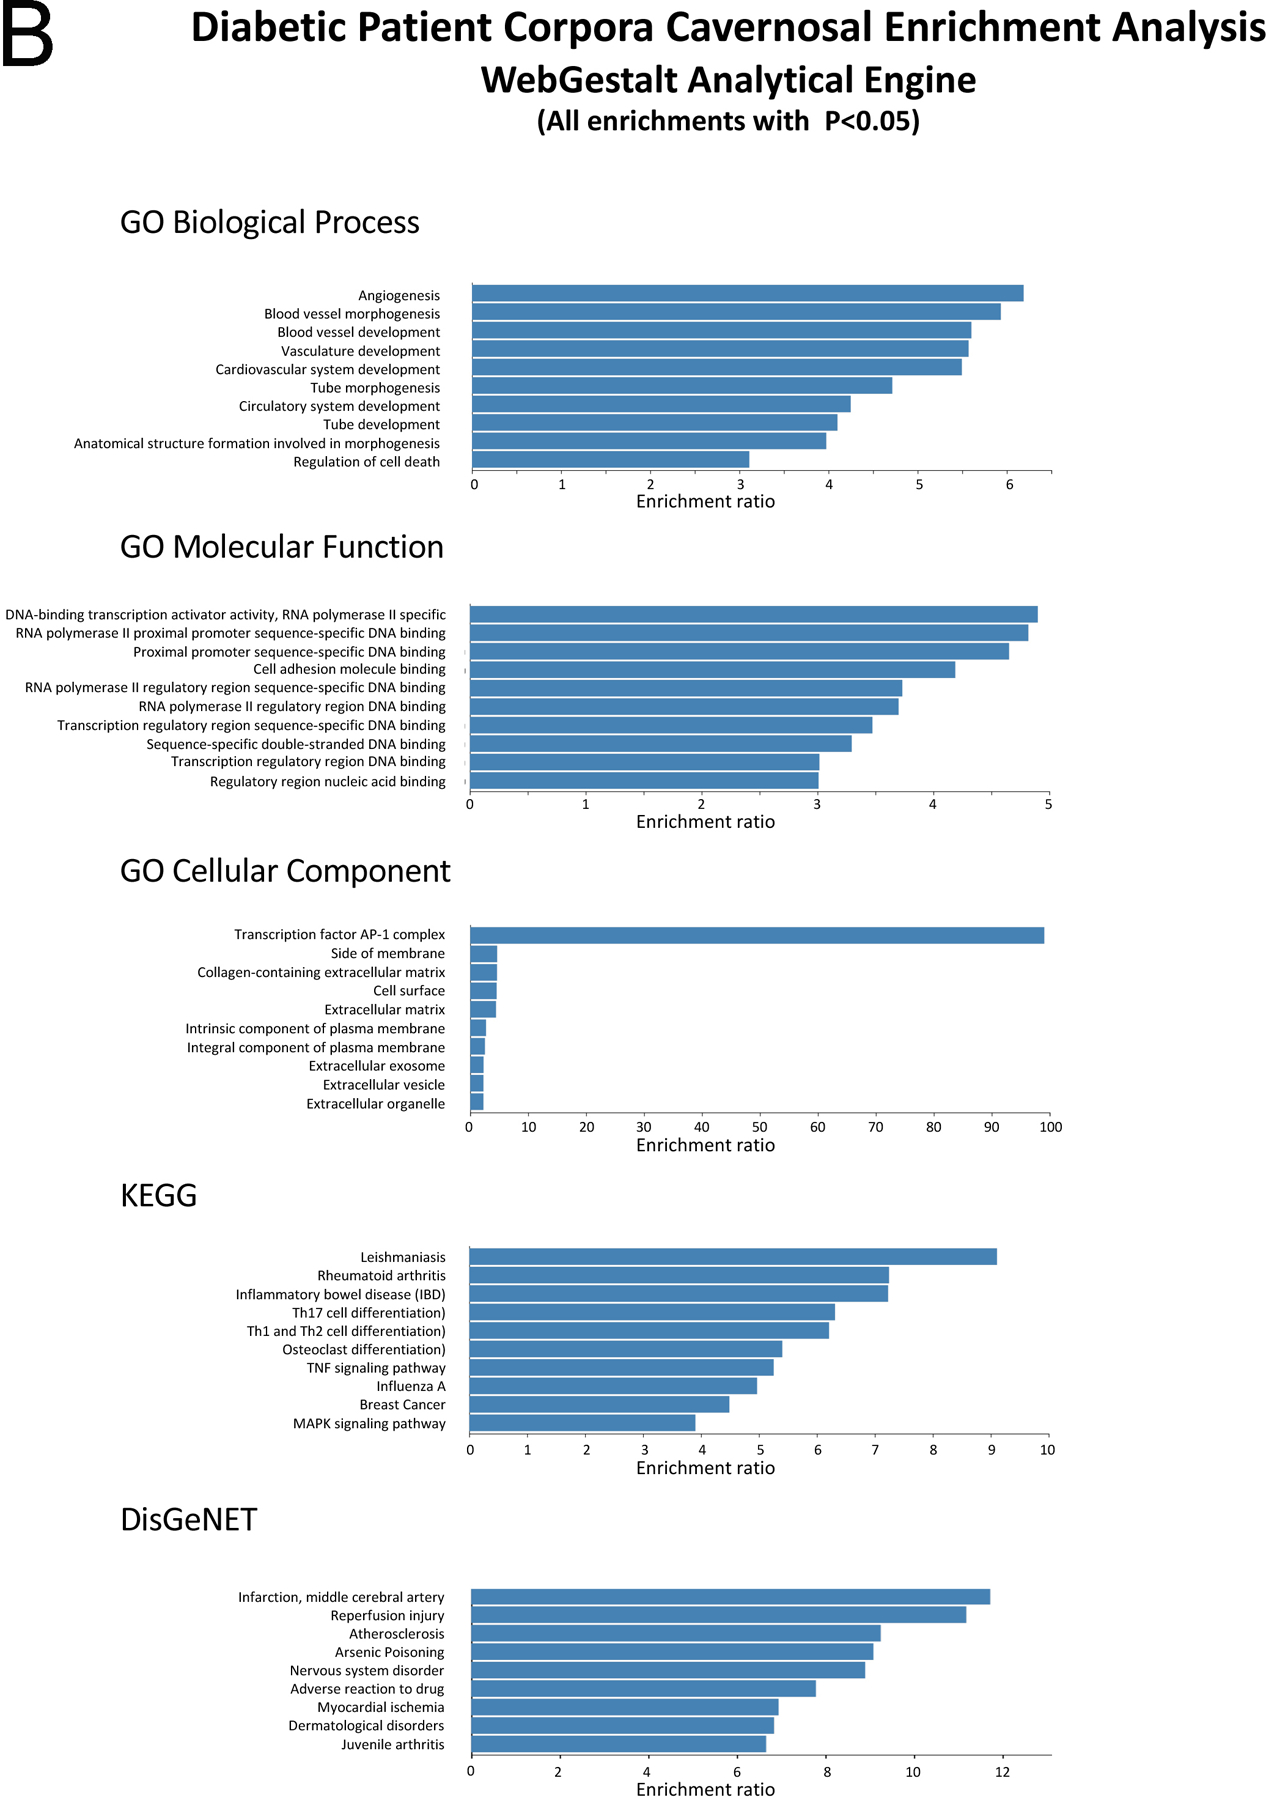
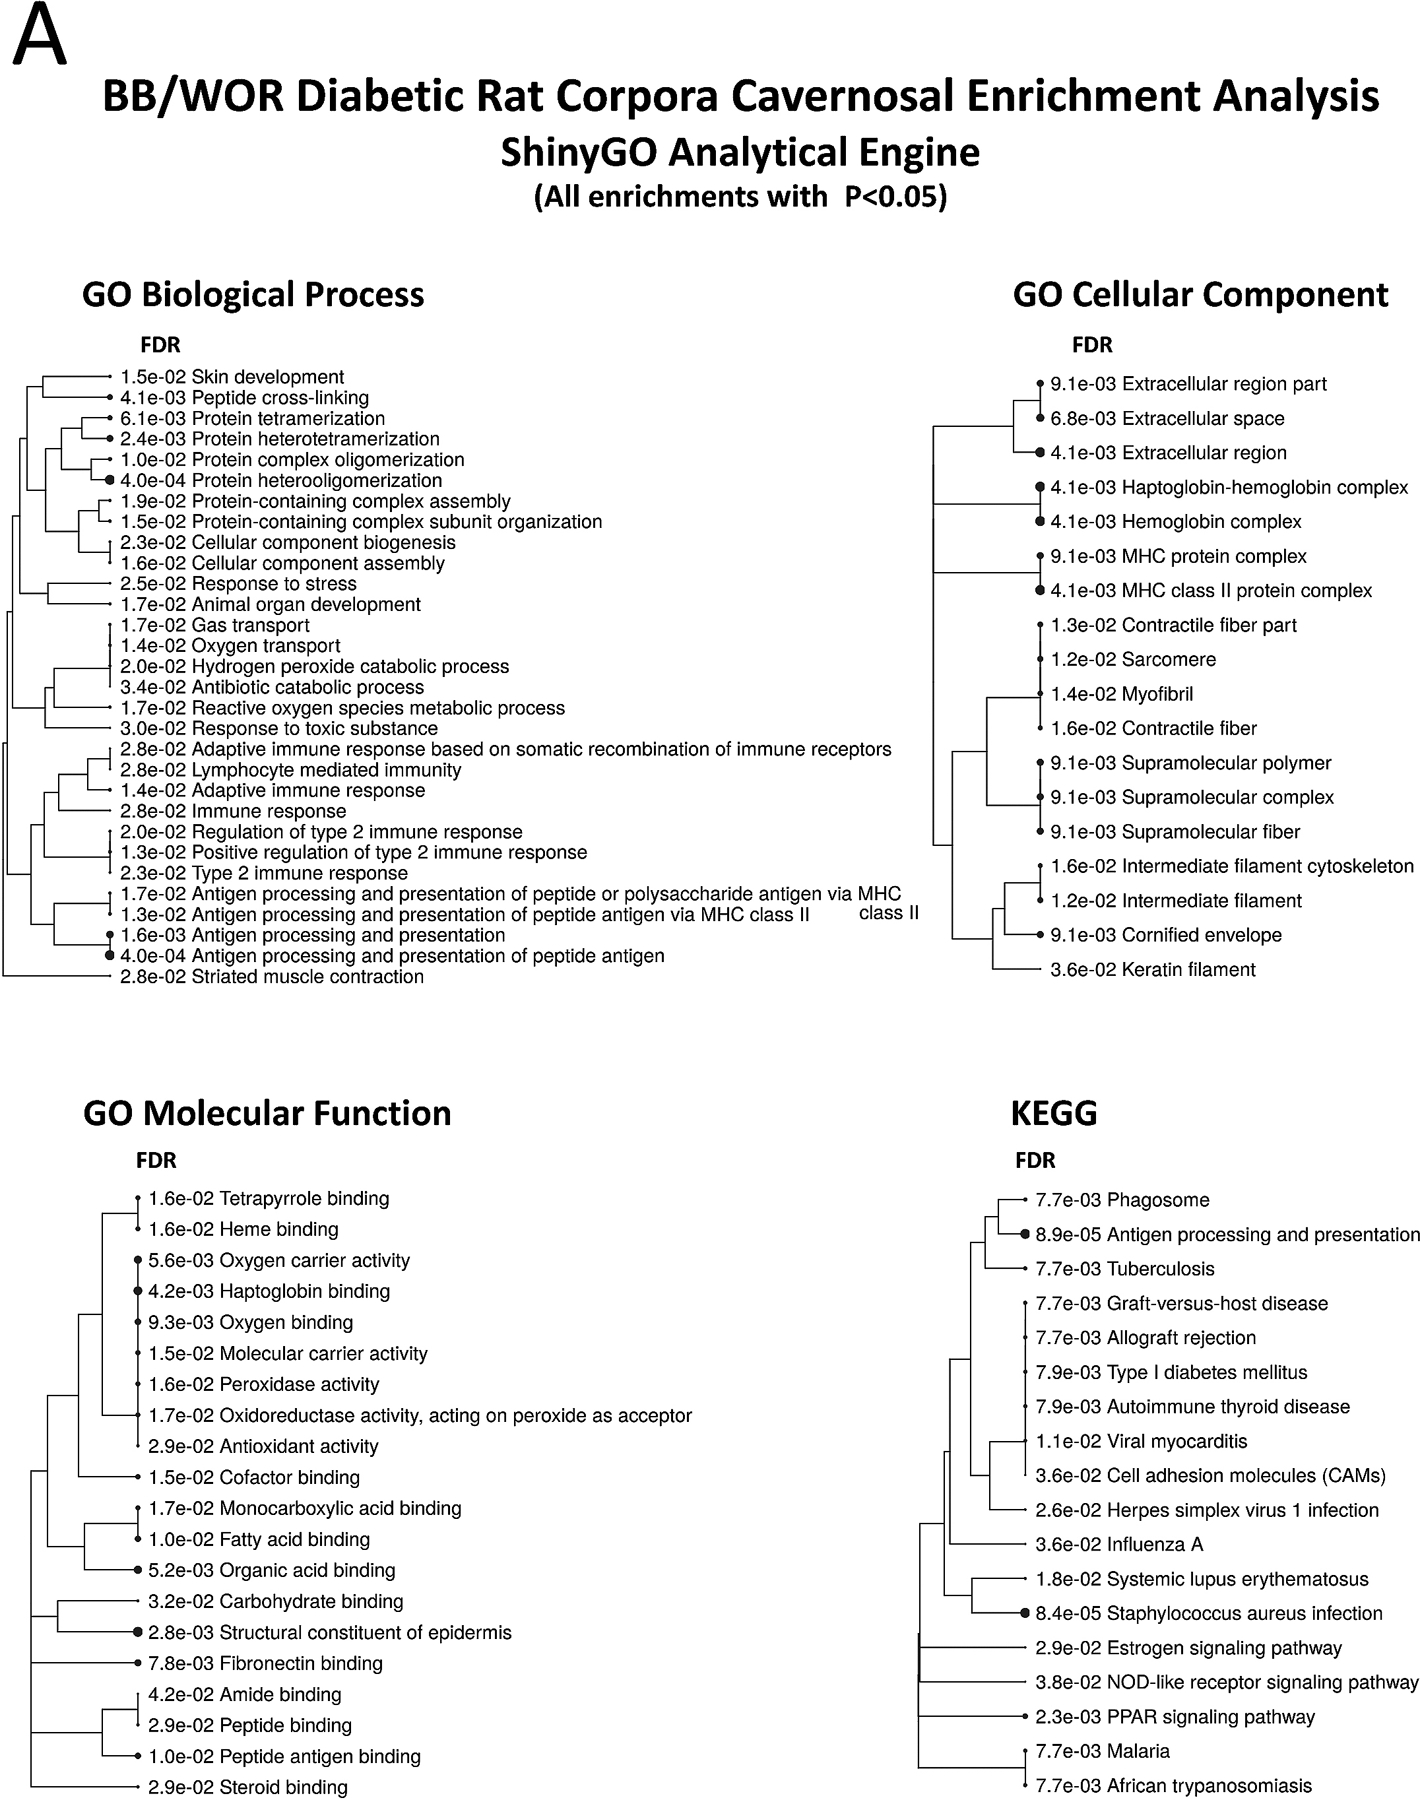
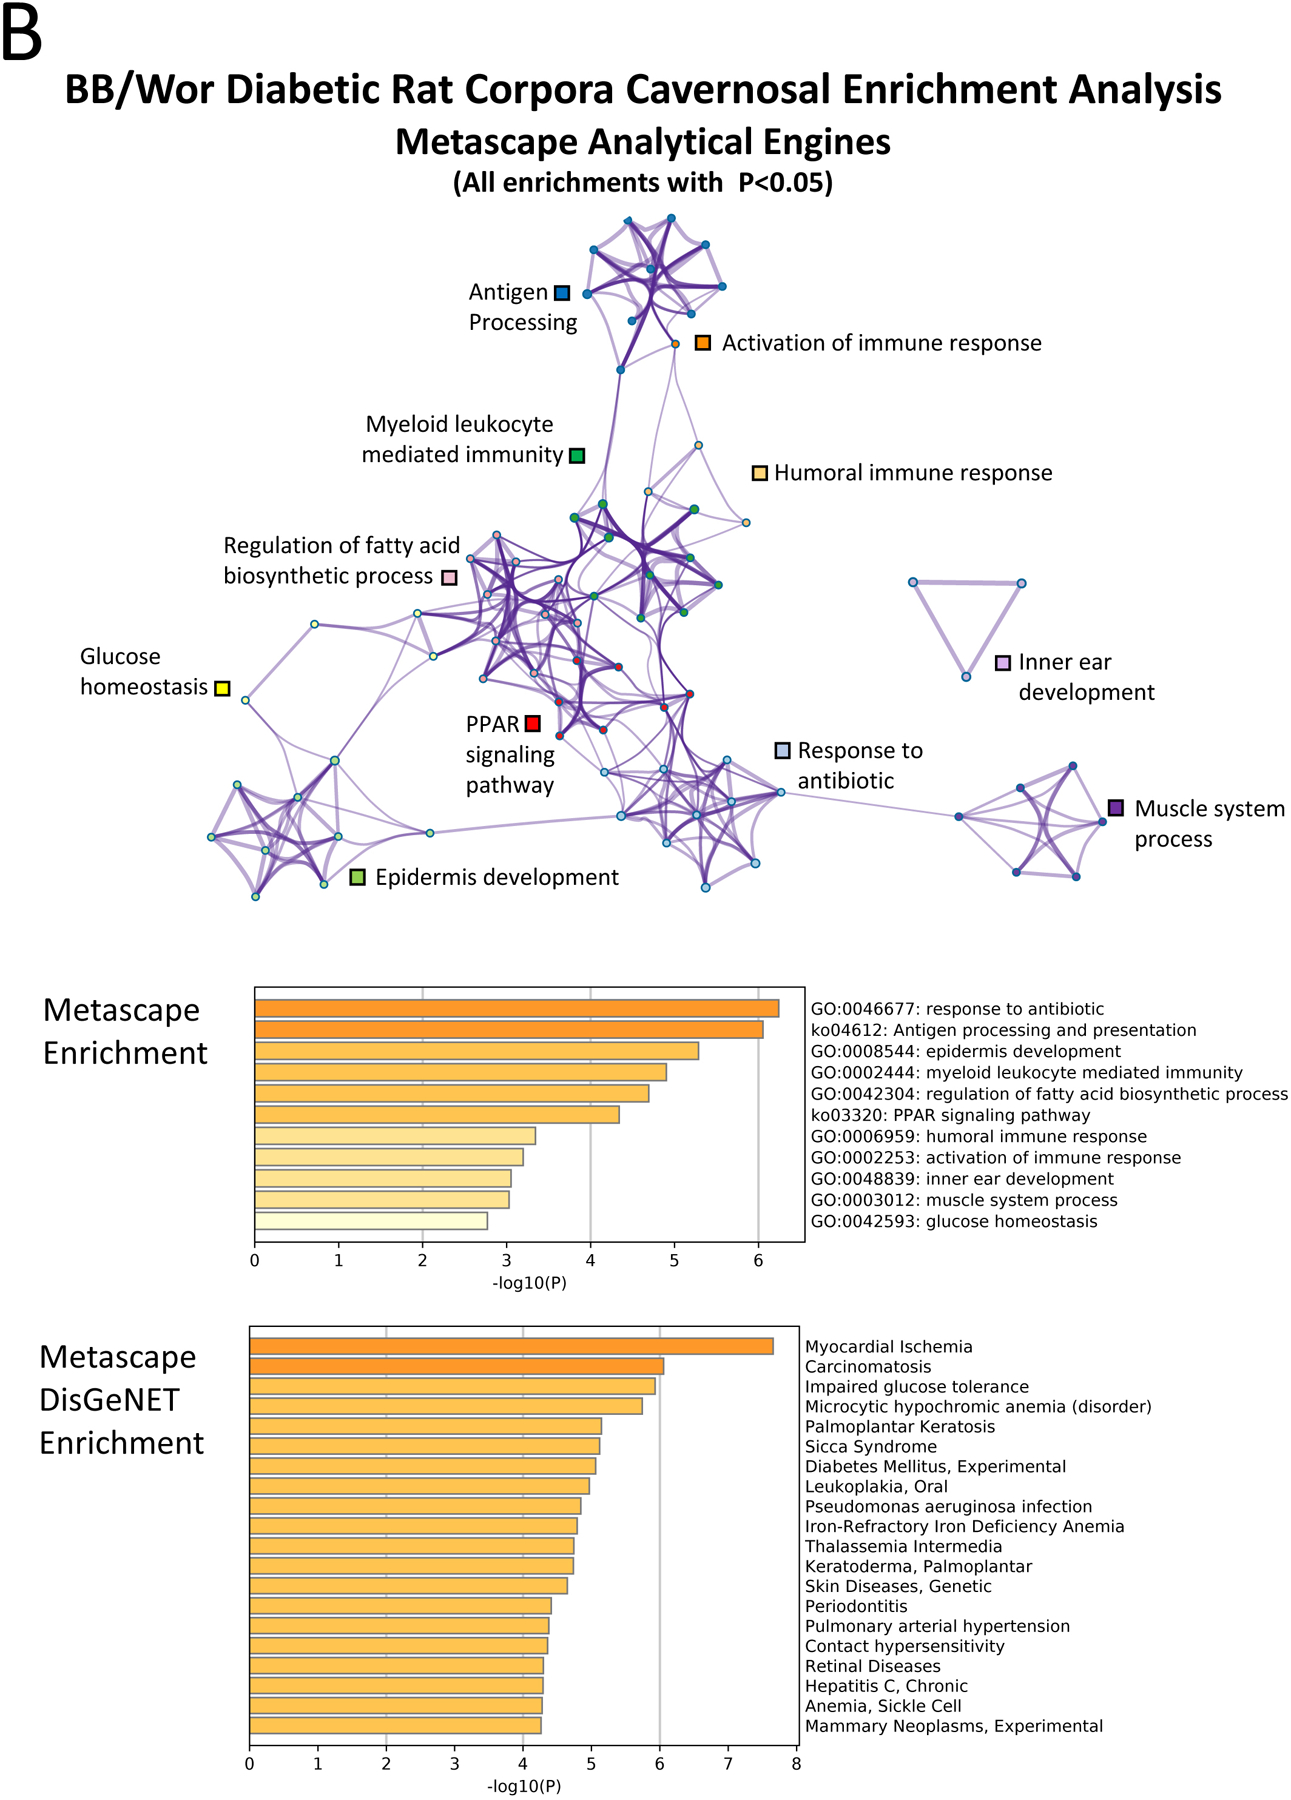
Methods and outcomes: Human corpora cavernosal tissue was obtained from diabetic (n = 4) and Peyronie's (control, n = 3) patients that were undergoing prosthesis implant to treat ED, and BB/WOR diabetic (n = 5) and resistant (n = 5) rats. RNA was extracted using TRIzol, DNase treated, and purified by Qiagen mini kit. Microarray was performed using the Human Gene 2.0 ST Array. (i) Alterations in patient and diabetic rat pathway signaling were examined using several analytical tools (ShinyGO, Metascape, WebGestalt, STRING) and databases, (ii) Strengths/weaknesses of the different pathway analysis tools were compared, and (iii) Comparison of human and rat (BB/WOR and Streptozotocin) pathway analysis was performed. Two technical replicates were performed. P value (FDR) < .15 was used as threshold for differential expression. FDR < 0.05 was considered significant.
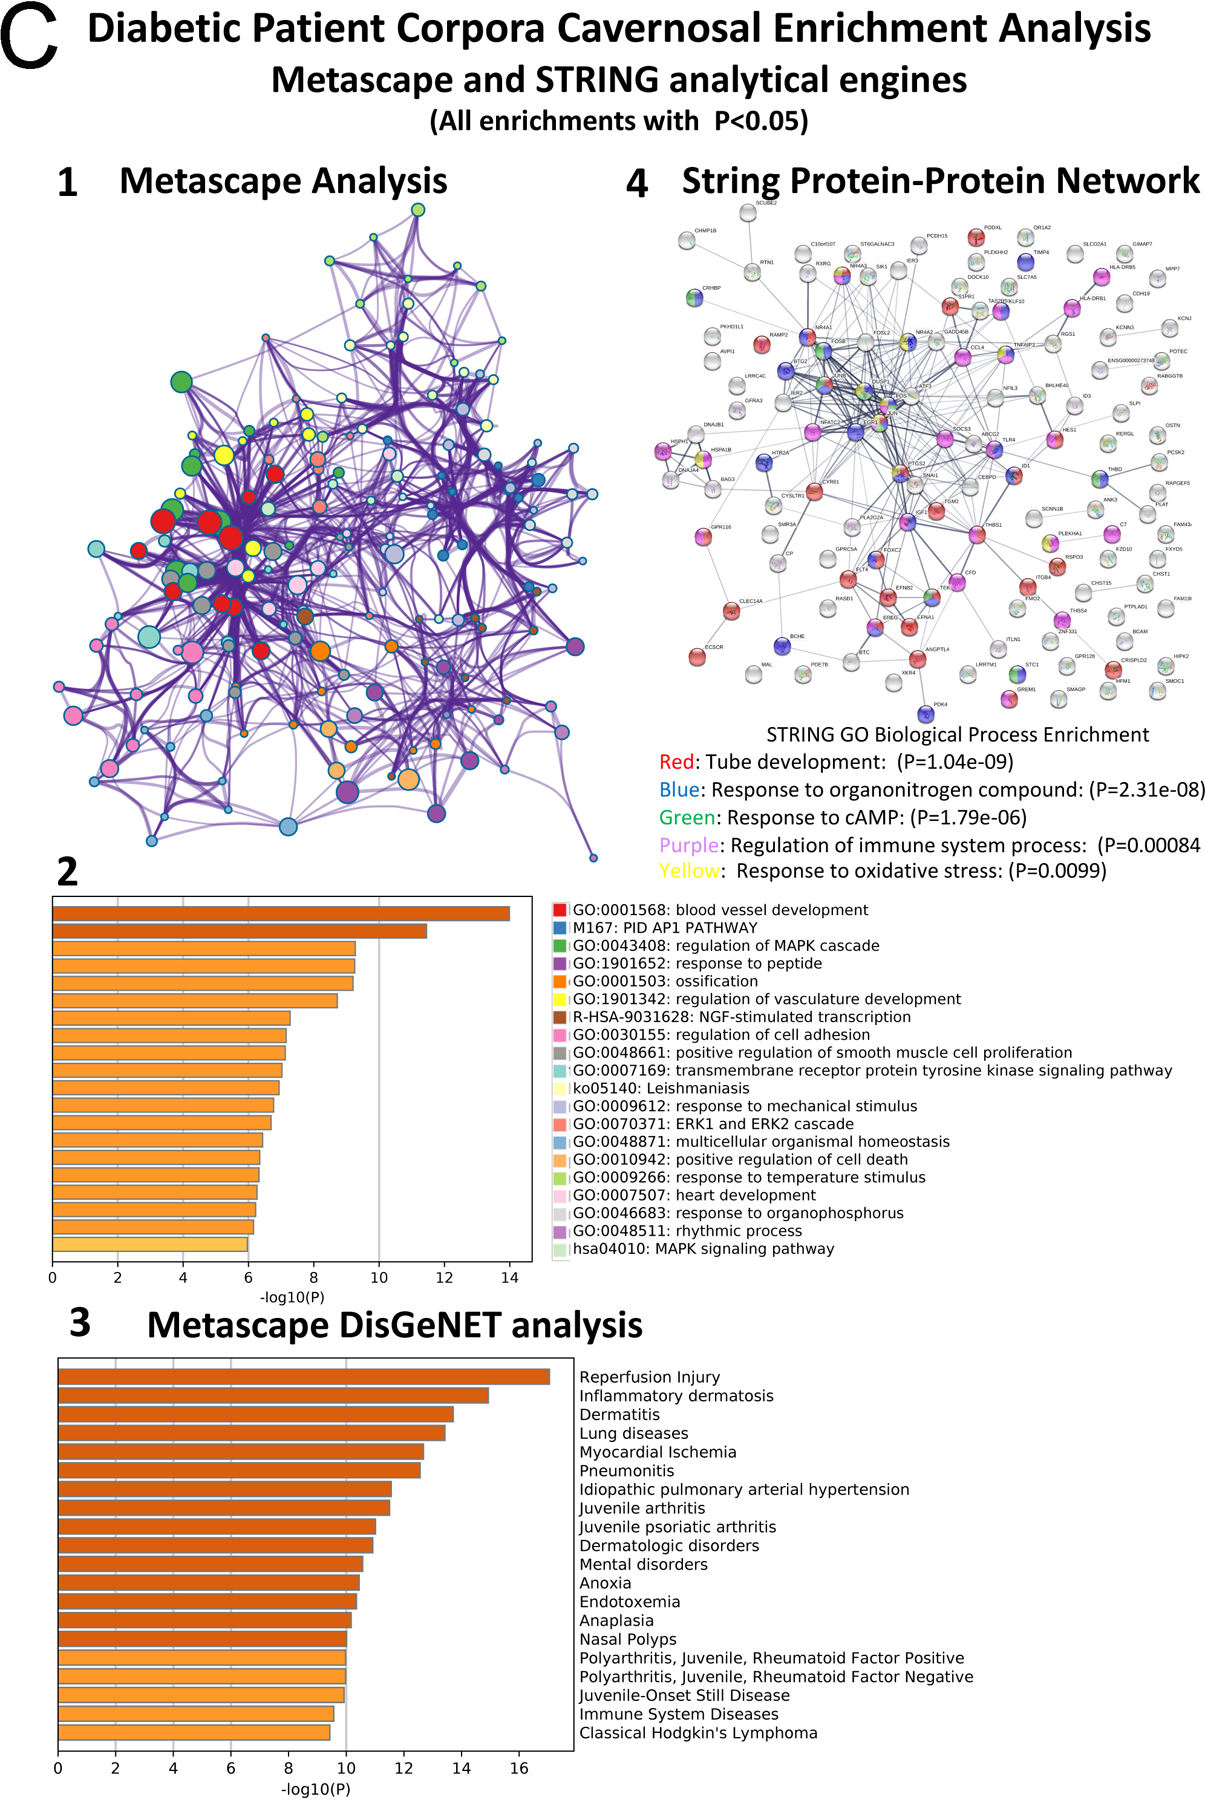
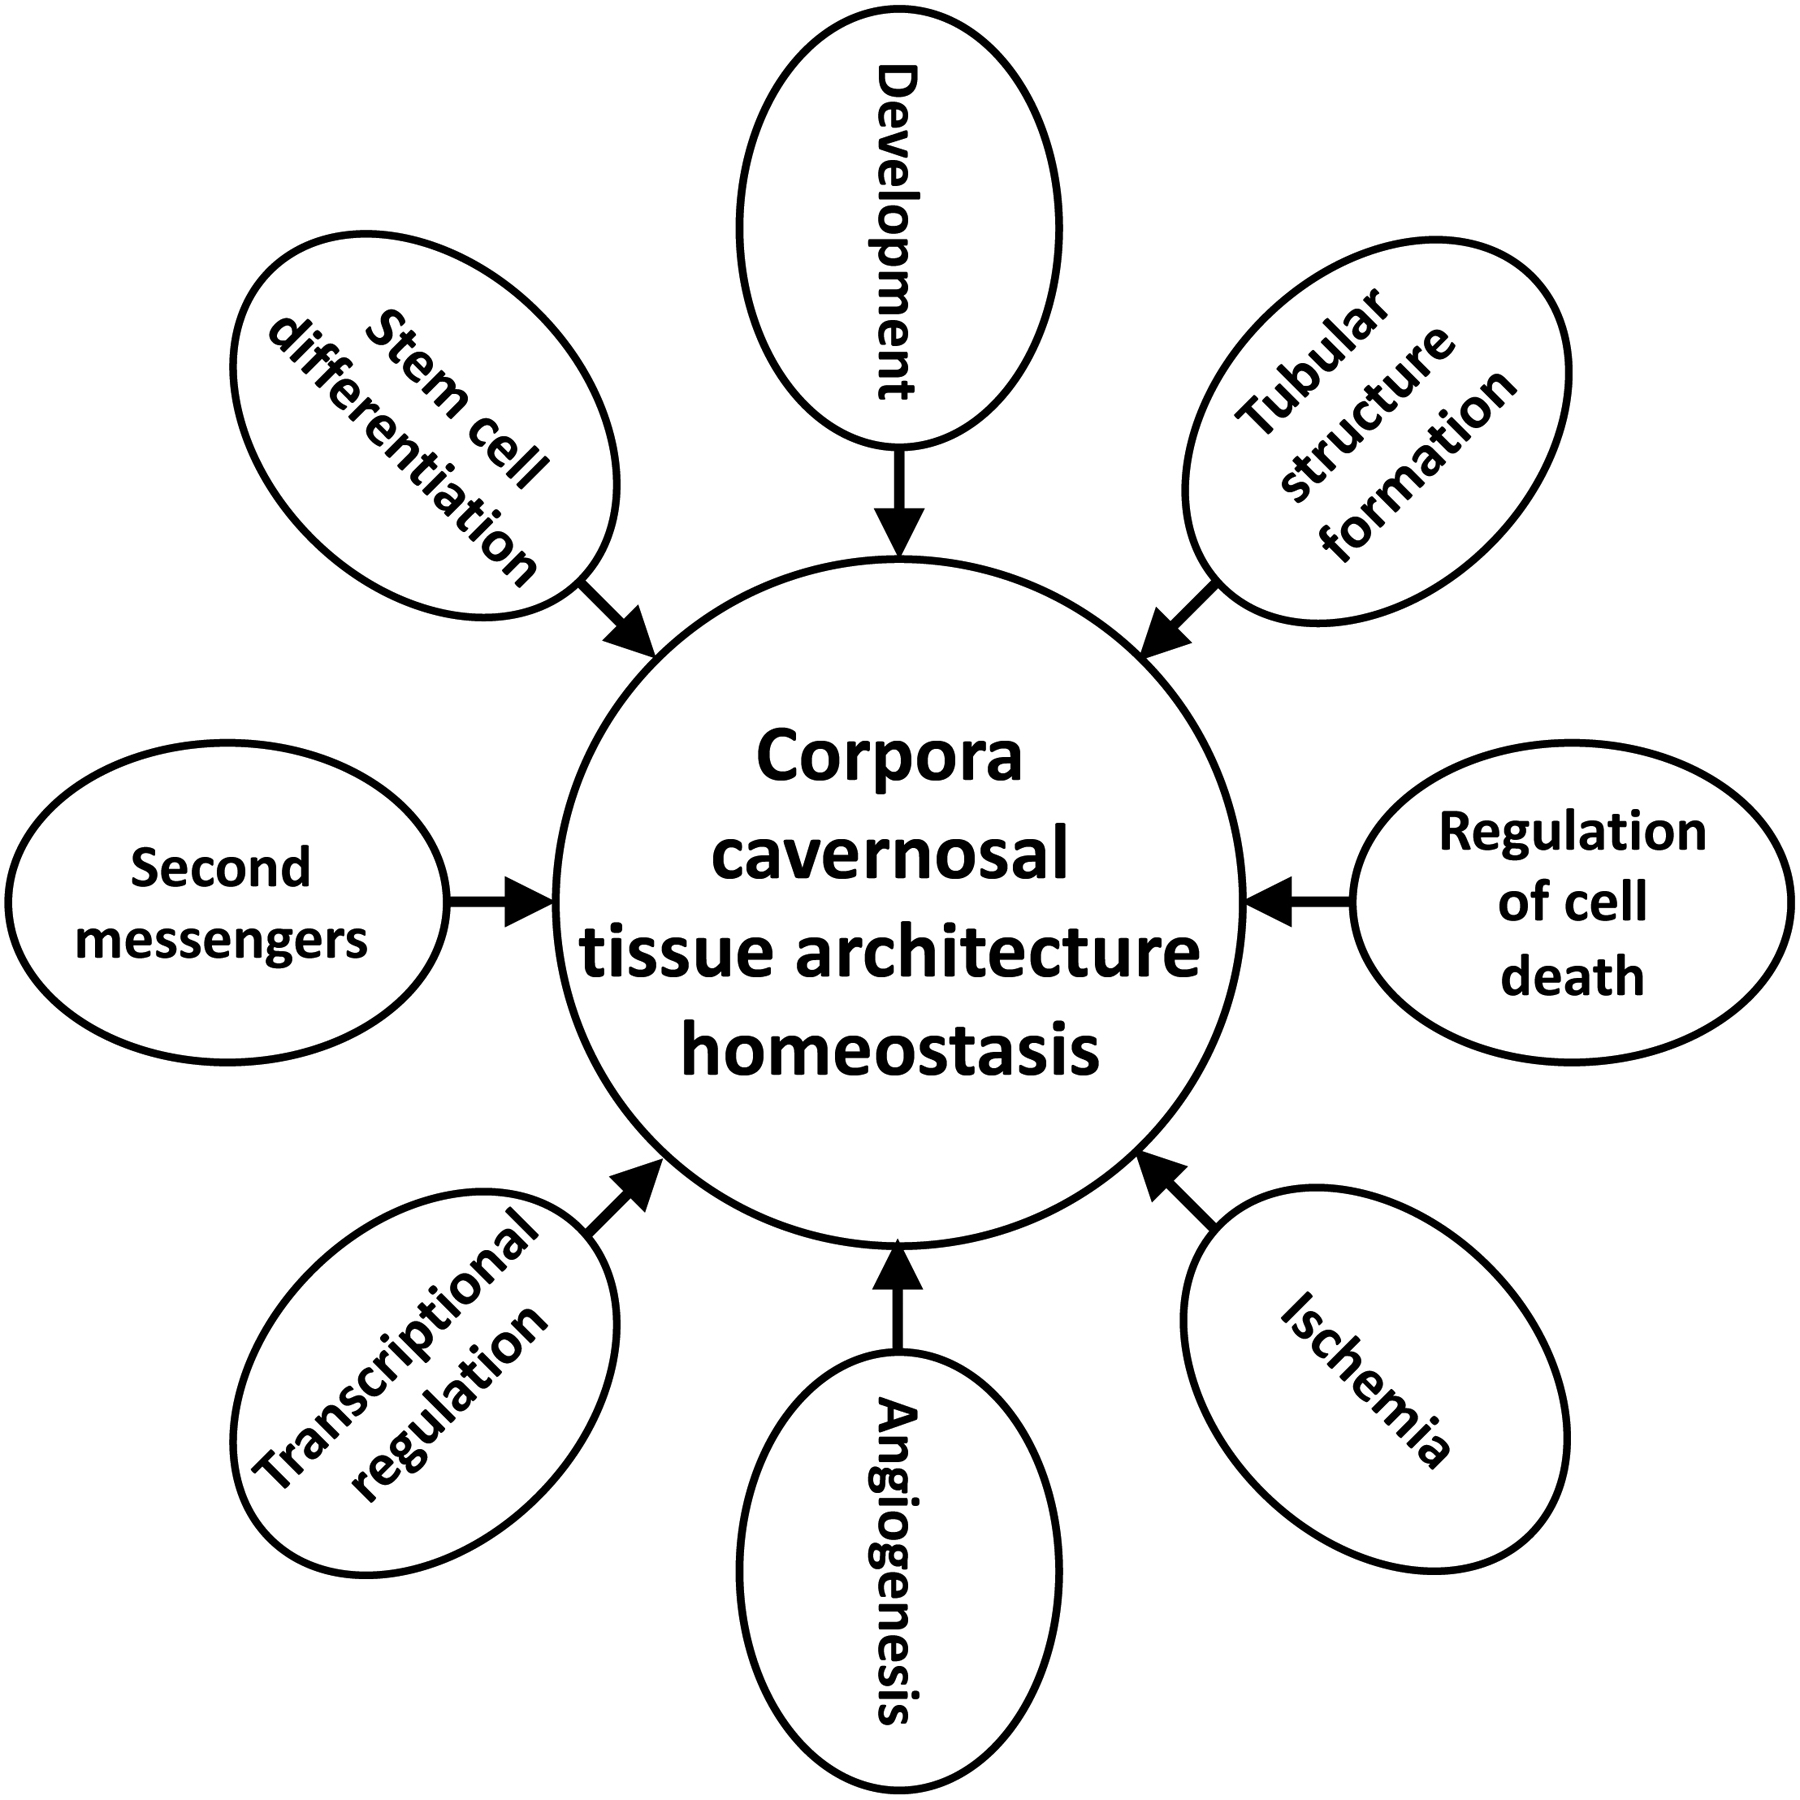
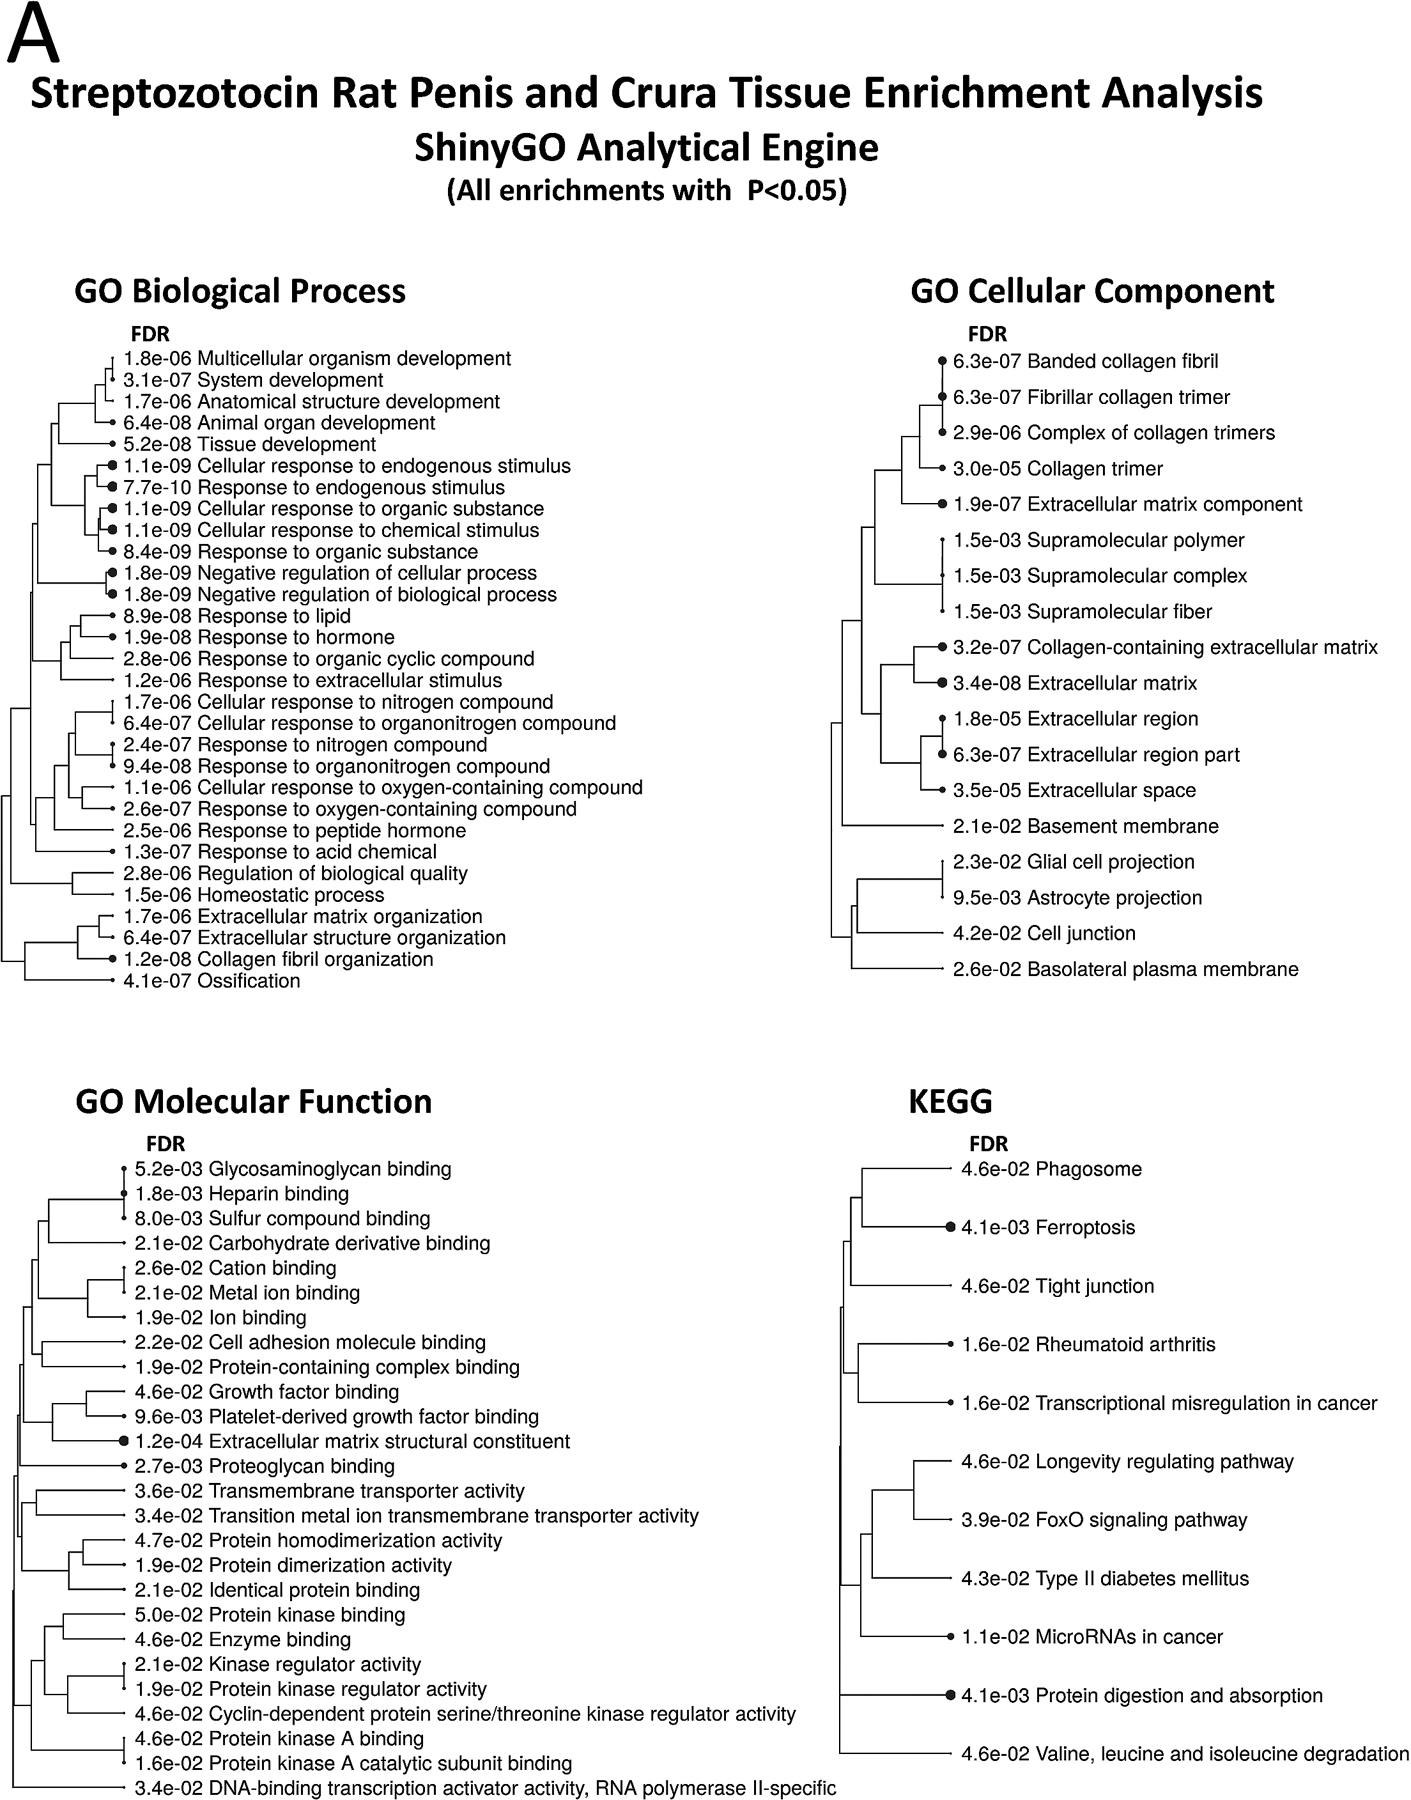
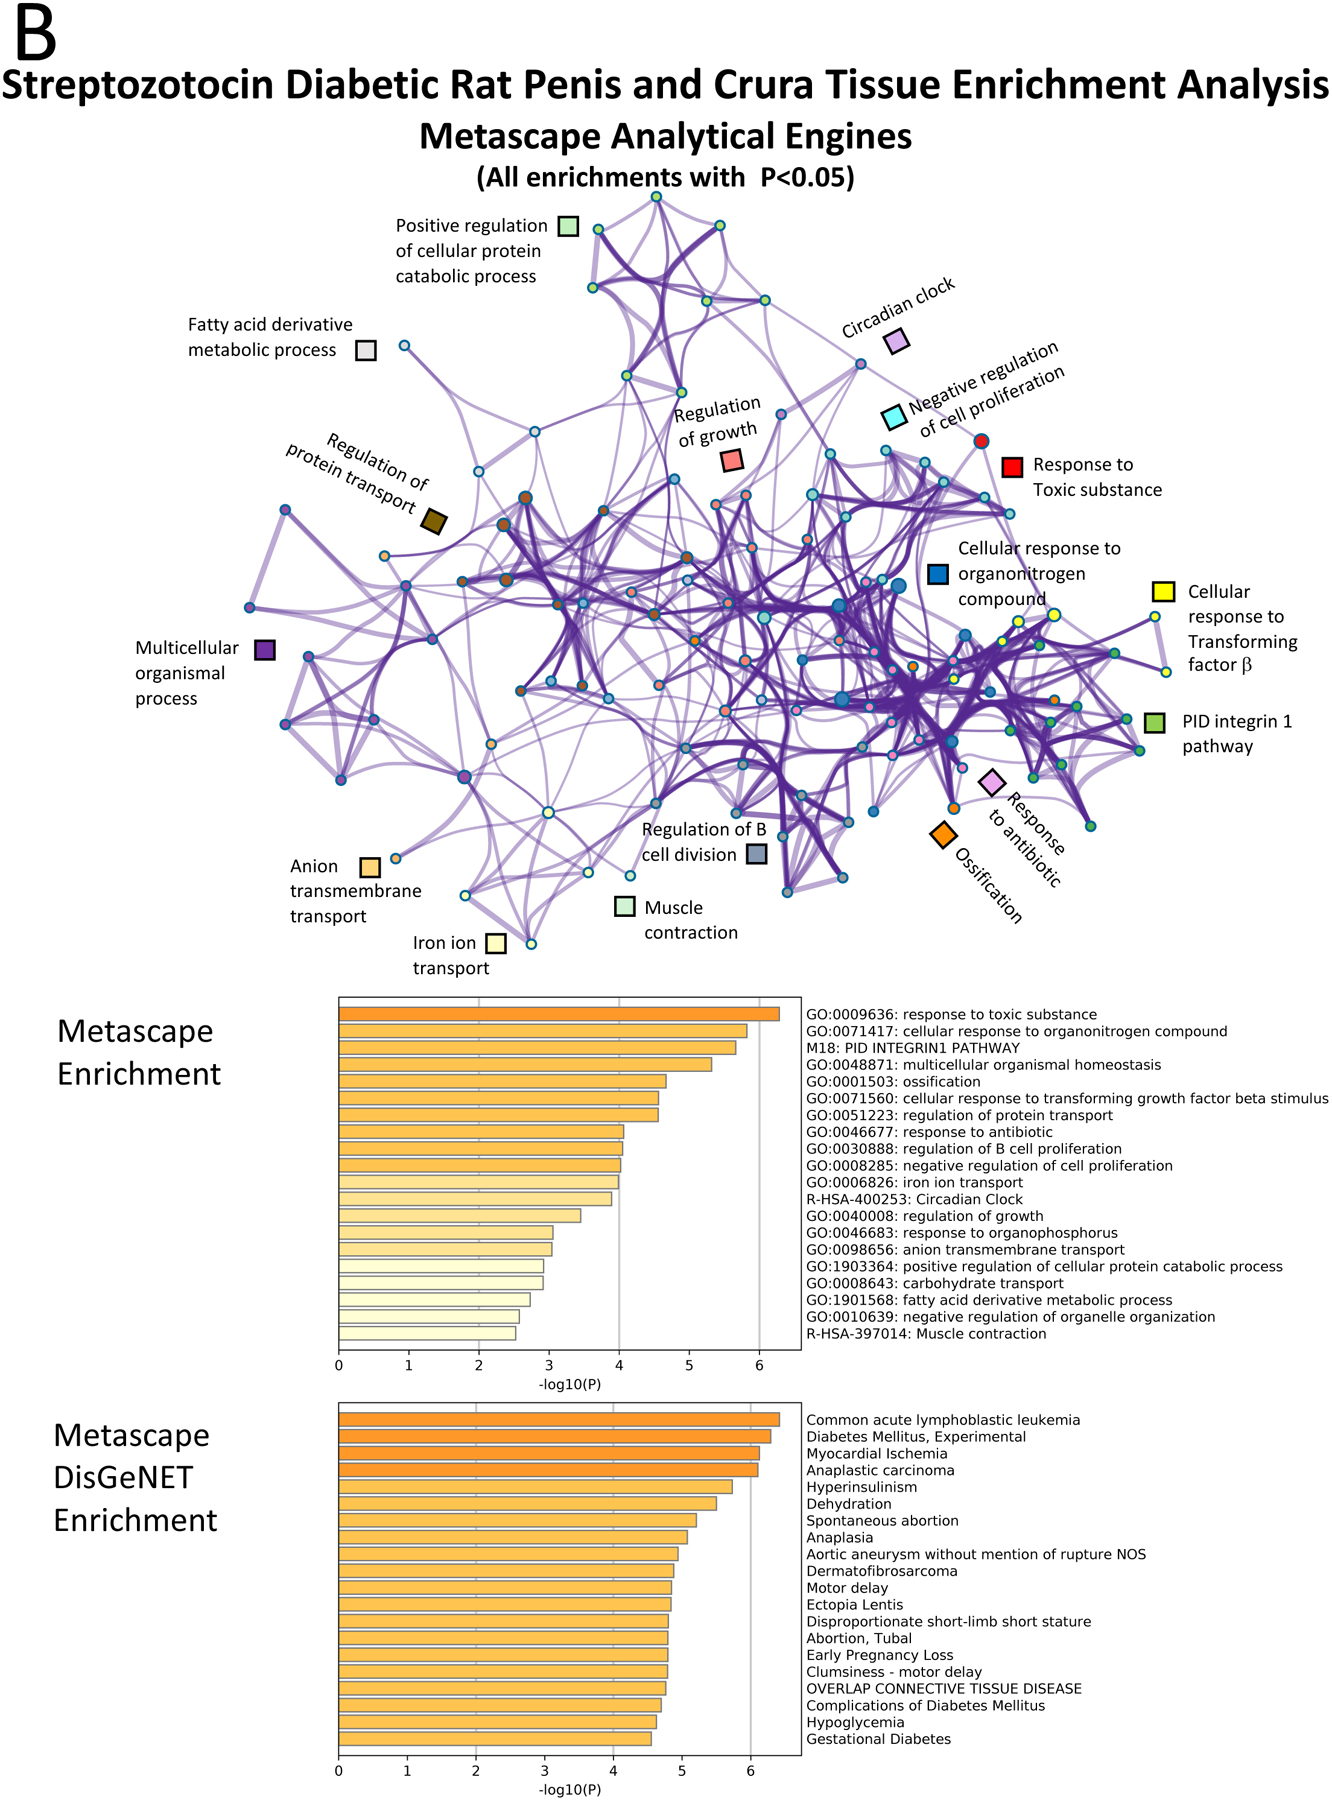
Results: Microarray identified 182 differentially expressed protein-coding genes. Pathway analysis revealed similar enrichments with different analytical tools. Down regulated pathways include development, tubular structure, sprouting, cell death, ischemia, angiogenesis, transcription, second messengers, and stem cell differentiation. ED patients, who have diabetes, incur significant loss of normal regulatory processes required for repair and replacement of injured corpora cavernosal tissue. Combined with loss of apoptotic regulatory mechanisms, this results in significant architectural remodeling of the corpora cavernosa, and loss of regenerative capacity in the penis.
Clinical translation: This first report of microarray and pathway analysis in human corpora cavernosa, is critical for identification of novel pathways pertinent to ED and for validating animal models.
Strengths and limitations: The analysis of tissue specific gene expression profiles provides a means of understanding drivers of disease and identifying novel pathways for clinical intervention.
Conclusion: Penis from diabetic ED patients lacks capacity for maintenance of corpora cavernosal architecture and regeneration, which are critical points for intervention for therapy development. Searl T, Ohlander S, McVary KT, et al., Pathway Enrichment Analysis of Microarray Data Fom Human Penis of Diabetic and Peyronie's Patients, in Comparison With Diabetic Rat Erectile Dysfunction Models. J Sex Med 2022;19:37-53.
Keywords: Corpora Cavernosa; Diabetic; Erectile Dysfunction; Microarray; Pathway Analysis; Penis; Peyronie's.
Copyright © 2021 International Society for Sexual Medicine. Published by Elsevier Inc. All rights reserved.
Figures
Comment in
-
Male and Female Sexual Function and Dysfunction; Andrology.J Urol. 2022 Jun;207(6):1332-1335. doi: 10.1097/JU.0000000000002655. Epub 2022 Mar 23. J Urol. 2022. PMID: 35319261 No abstract available.
Similar articles
-
Pathway analysis of microarray data from corpora cavernosal tissue of patients with a prostatectomy or Peyronie disease in comparison with a cavernous nerve-injured rat model of erectile dysfunction.J Sex Med. 2023 Feb 14;20(2):139-151. doi: 10.1093/jsxmed/qdac019. J Sex Med. 2023. PMID: 36763930 Free PMC article.
-
Caspase Signaling in ED Patients and Animal Models.J Sex Med. 2021 Apr;18(4):711-722. doi: 10.1016/j.jsxm.2021.01.175. Epub 2021 Mar 9. J Sex Med. 2021. PMID: 33707045 Free PMC article.
-
Sonic Hedgehog Signaling in Primary Culture of Human Corpora Cavernosal Tissue From Prostatectomy, Diabetic, and Peyronie's Patients.J Sex Med. 2022 Aug;19(8):1228-1242. doi: 10.1016/j.jsxm.2022.04.010. Epub 2022 Jun 23. J Sex Med. 2022. PMID: 35752559 Free PMC article.
-
Erectile dysfunction: anatomical parameters, etiology, diagnosis, and therapy.Arch Androl. 2005 Jan-Feb;51(1):15-31. doi: 10.1080/1485010490475147. Arch Androl. 2005. PMID: 15764414 Review.
-
Management of Peyronie's disease--a review.World J Urol. 2001 Aug;19(4):244-50. World J Urol. 2001. PMID: 11550782 Review.
Cited by
-
BMP4 and GREM1 are targets of SHH signaling and downstream regulators of collagen in the penis.J Sex Med. 2024 Apr 30;21(5):367-378. doi: 10.1093/jsxmed/qdae015. J Sex Med. 2024. PMID: 38451311 Free PMC article.
-
Penile remodeling, Sonic hedgehog, and fibrosis.J Sex Med. 2025 May 10;22(5):668-670. doi: 10.1093/jsxmed/qdaf048. J Sex Med. 2025. PMID: 40356579 No abstract available.
-
SHH regulates penile morphology and smooth muscle through a mechanism involving BMP4 and GREM1.J Sex Med. 2024 Apr 30;21(5):379-390. doi: 10.1093/jsxmed/qdae016. J Sex Med. 2024. PMID: 38451321 Free PMC article.
-
A review of experimental techniques for erectile function researches and development of medical technology using animal erectile dysfunction models in sexual and reproductive medicine.Reprod Med Biol. 2023 Apr 3;22(1):e12513. doi: 10.1002/rmb2.12513. eCollection 2023 Jan-Dec. Reprod Med Biol. 2023. PMID: 37020643 Free PMC article. Review.
-
Pathway analysis of microarray data from corpora cavernosal tissue of patients with a prostatectomy or Peyronie disease in comparison with a cavernous nerve-injured rat model of erectile dysfunction.J Sex Med. 2023 Feb 14;20(2):139-151. doi: 10.1093/jsxmed/qdac019. J Sex Med. 2023. PMID: 36763930 Free PMC article.
References
-
- Feldman HA, Goldstein I, Hatzichristou DG, Krane RJ, McKinlay JB. Impotence and its medical and psychosocial correlates: results of the Massachusetts Male Aging Study. J Urol 1994; 151: 54–61. - PubMed
-
- Heruti R, Shochat T, Tekes-Manova D, Ashkenazi I, Justo D (2004) Prevalence of erectile dysfunction among young adults: results of a large-scale survey. J Sex Med 2004; 1: 284–291. - PubMed
-
- Nguyen HMT, Gabrielson AT, Hellstrom WJG. Erectile dysfunction in young men-A review of the prevalence and risk factors. Sex Med Rev 2017; 5: 508–520. - PubMed
-
- Corona G, Lee DM, Forti G, O’Connor DB, Maggi M, O’Neill TW, Pendleton N, Bartfai G, Boonen S, Casanueva FF, Finn J, Giwercman A, Han TS, Huhtaniemi IT, Kula K, Lean MEJ, Punjab M, SIlman AJ, Vanderschueren D, Wu FCW. E. Age-related changes in general and sexual health in middle-aged and older men: results from the European Male Ageing Study (EMAS). J Sex Med 2010; 7: 1362–1380. - PubMed
-
- Selvin E, Burnett AL, Platz EA. Prevalence and risk factors for erectile dysfunction in the US. American Journal of Medicine 2007; 120: 151–157. - PubMed
