

Translational demand is not a major source of plasmid-associated fitness costs
- PMID: 34839712
- PMCID: PMC8628068
- DOI: 10.1098/rstb.2020.0463
Translational demand is not a major source of plasmid-associated fitness costs
Abstract
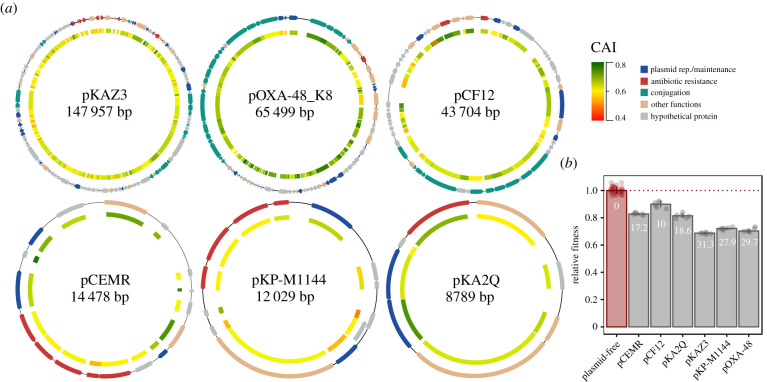
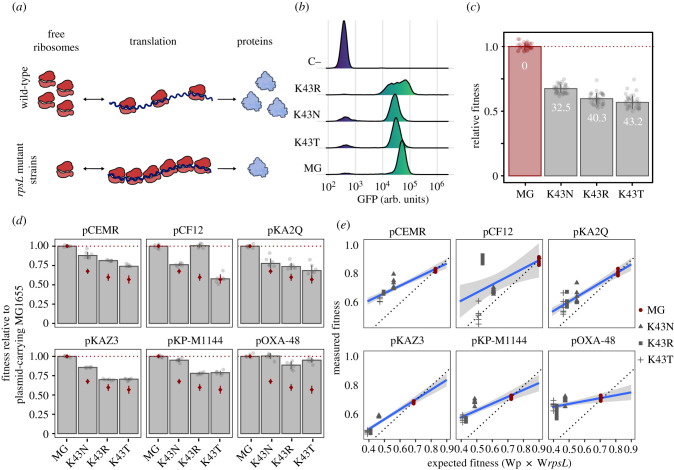
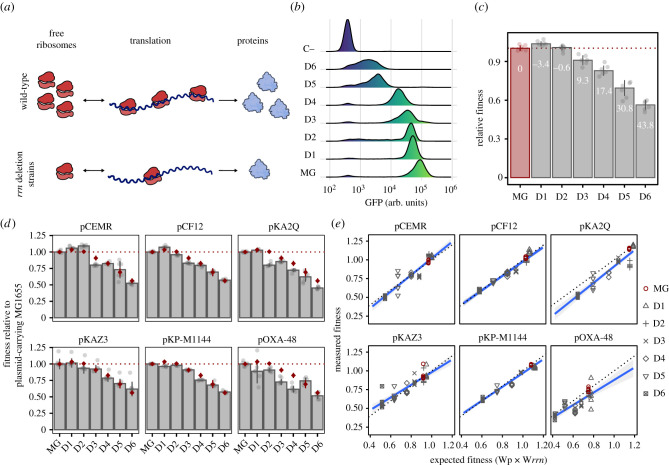
Plasmids are key drivers of bacterial evolution because they are crucial agents for the horizontal transfer of adaptive traits, such as antibiotic resistance. Most plasmids entail a metabolic burden that reduces the fitness of their host if there is no selection for plasmid-encoded genes. It has been hypothesized that the translational demand imposed by plasmid-encoded genes is a major mechanism driving the fitness cost of plasmids. Plasmid-encoded genes typically present a different codon usage from host chromosomal genes. As a consequence, the translation of plasmid-encoded genes might sequestrate ribosomes on plasmid transcripts, overwhelming the translation machinery of the cell. However, the pervasiveness and origins of the translation-derived costs of plasmids are yet to be assessed. Here, we systematically altered translation efficiency in the host cell to disentangle the fitness effects produced by six natural antibiotic resistance plasmids. We show that limiting translation efficiency either by reducing the number of available ribosomes or their processivity does not increase plasmid costs. Overall, our results suggest that ribosomal paucity is not a major contributor to plasmid fitness costs. This article is part of the theme issue 'The secret lives of microbial mobile genetic elements'.
Keywords: codon usage; fitness cost; horizontal gene transfer; plasmid; ribosome; translational demand.
Figures
Similar articles
-
Fitness Costs of Plasmids: a Limit to Plasmid Transmission.Microbiol Spectr. 2017 Sep;5(5):10.1128/microbiolspec.mtbp-0016-2017. doi: 10.1128/microbiolspec.MTBP-0016-2017. Microbiol Spectr. 2017. PMID: 28944751 Free PMC article. Review.
-
Methods to Study Fitness and Compensatory Adaptation in Plasmid-Carrying Bacteria.Methods Mol Biol. 2020;2075:371-382. doi: 10.1007/978-1-4939-9877-7_26. Methods Mol Biol. 2020. PMID: 31584176
-
Why do plasmids manipulate the expression of bacterial phenotypes?Philos Trans R Soc Lond B Biol Sci. 2022 Jan 17;377(1842):20200461. doi: 10.1098/rstb.2020.0461. Epub 2021 Nov 29. Philos Trans R Soc Lond B Biol Sci. 2022. PMID: 34839708 Free PMC article. Review.
-
Plasmid and clonal interference during post horizontal gene transfer evolution.Mol Ecol. 2017 Apr;26(7):1832-1847. doi: 10.1111/mec.14056. Epub 2017 Mar 13. Mol Ecol. 2017. PMID: 28206693 Free PMC article.
-
Gene sharing among plasmids and chromosomes reveals barriers for antibiotic resistance gene transfer.Philos Trans R Soc Lond B Biol Sci. 2022 Jan 17;377(1842):20200467. doi: 10.1098/rstb.2020.0467. Epub 2021 Nov 29. Philos Trans R Soc Lond B Biol Sci. 2022. PMID: 34839702 Free PMC article.
Cited by
-
The evolutionary landscape of prokaryotic chromosome/plasmid balance.Commun Biol. 2024 Nov 4;7(1):1434. doi: 10.1038/s42003-024-07167-5. Commun Biol. 2024. PMID: 39496780 Free PMC article.
-
Vertical and horizontal gene transfer tradeoffs direct plasmid fitness.Mol Syst Biol. 2023 Feb 10;19(2):e11300. doi: 10.15252/msb.202211300. Epub 2022 Dec 27. Mol Syst Biol. 2023. PMID: 36573357 Free PMC article.
-
Plasmid Costs Explain Plasmid Maintenance, Irrespective of the Nature of Compensatory Mutations.Antibiotics (Basel). 2023 May 1;12(5):841. doi: 10.3390/antibiotics12050841. Antibiotics (Basel). 2023. PMID: 37237742 Free PMC article.
-
Unravelling Prokaryotic Codon Usage: Insights from Phylogeny, Influencing Factors and Pathogenicity.Curr Genomics. 2025;26(2):81-94. doi: 10.2174/0113892029325491240919151045. Epub 2024 Oct 1. Curr Genomics. 2025. PMID: 40433443 Free PMC article. Review.
-
Emergence of a High-Risk Klebsiella michiganensis Clone Disseminating Carbapenemase Genes.Front Microbiol. 2022 May 23;13:880248. doi: 10.3389/fmicb.2022.880248. eCollection 2022. Front Microbiol. 2022. PMID: 35677907 Free PMC article.
References
Publication types
MeSH terms
Associated data
LinkOut - more resources
Full Text Sources
Research Materials
