

The Influence of Renal Function Impairment on Kappa Free Light Chains in Cerebrospinal Fluid
- PMID: 34840504
- PMCID: PMC8619759
- DOI: 10.1177/11795735211042166
The Influence of Renal Function Impairment on Kappa Free Light Chains in Cerebrospinal Fluid
Abstract
Background: The determination of kappa free light chains (KFLC) in cerebrospinal fluid (CSF) is an upcoming biomarker for the detection of an intrathecal immunoglobulin synthesis. Since renal function impairment leads to altered serum KFLC and albumin concentrations, interpretation of KFLC in CSF may be influenced by these parameters.
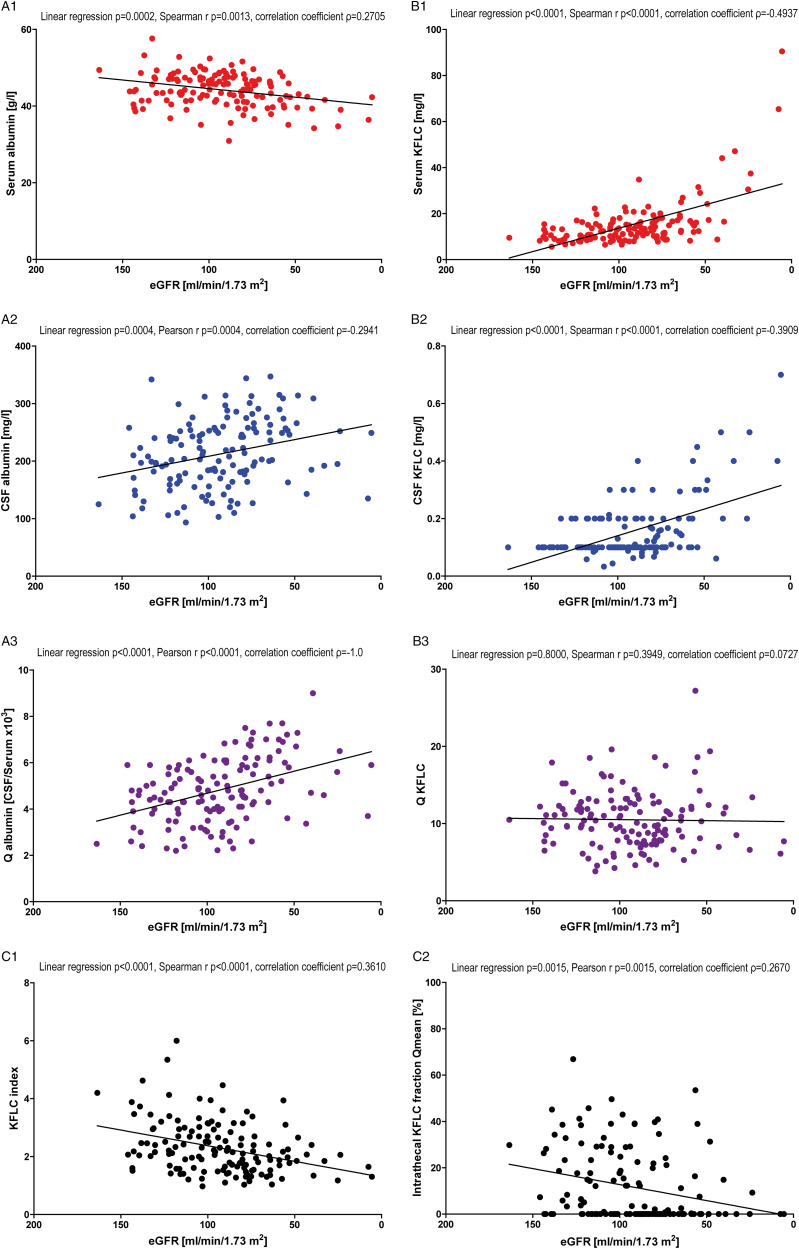
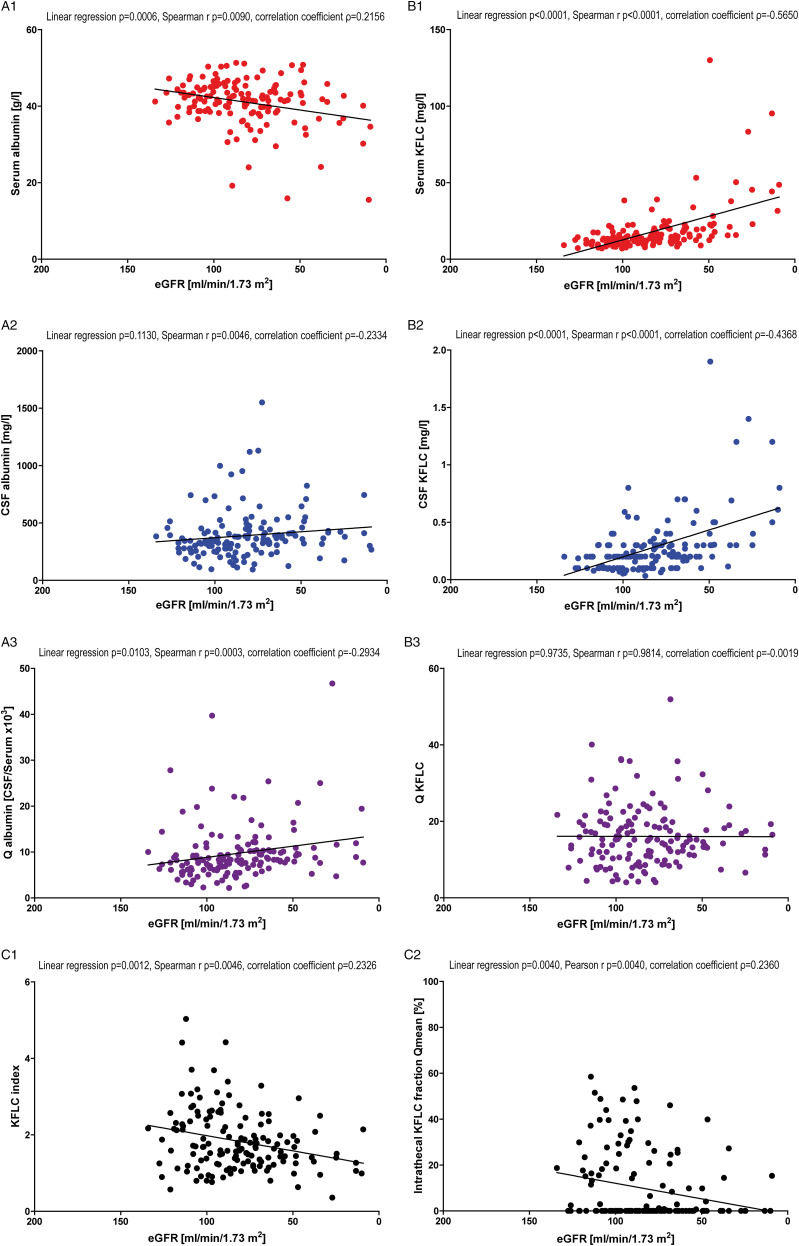
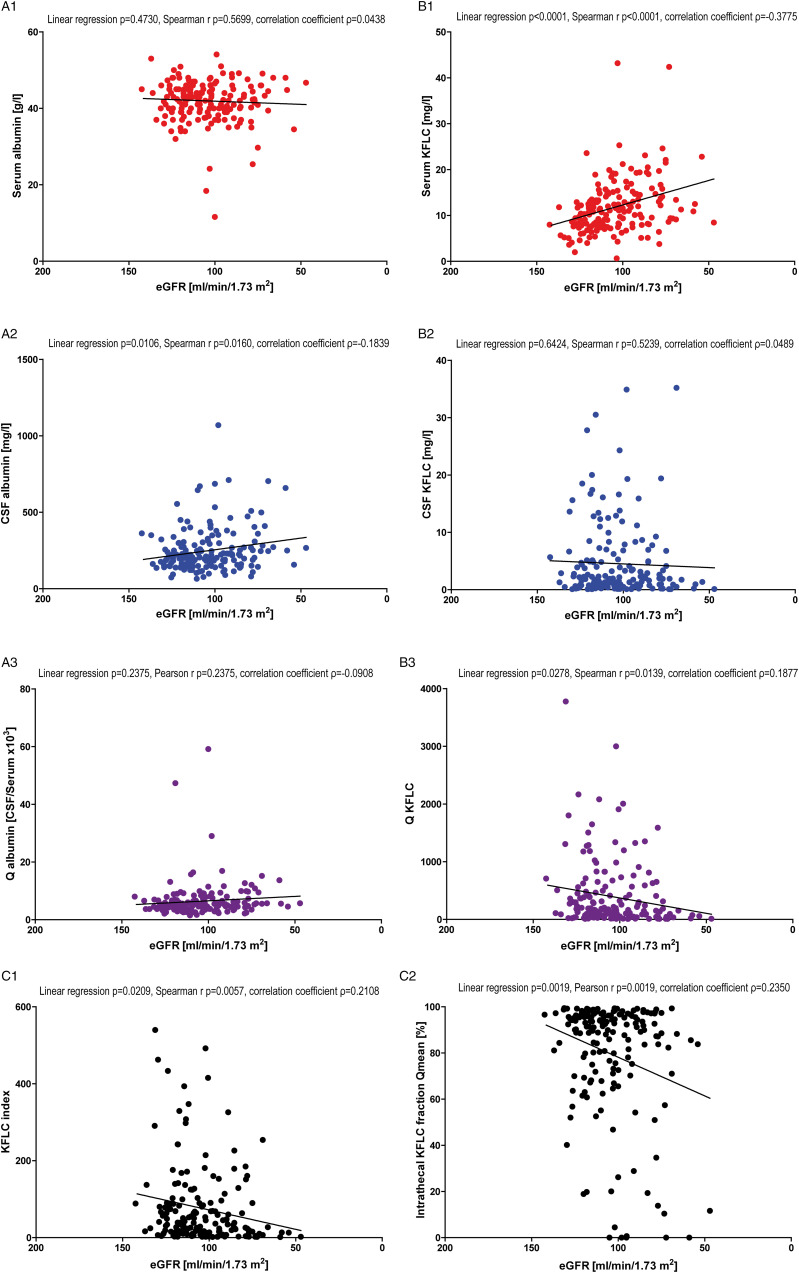
Methods: In this two-center study, the influence of renal function (according to the CKD-EPI creatinine equation) on KFLC and albumin concentrations was investigated in patients with "physiological" (n = 139), "non-inflammatory" (n = 146), and "inflammatory" (n = 172) CSF profiles in respect to the KFLC index and the evaluation in quotient diagrams in reference to the hyperbolic reference range (KFLC IF).
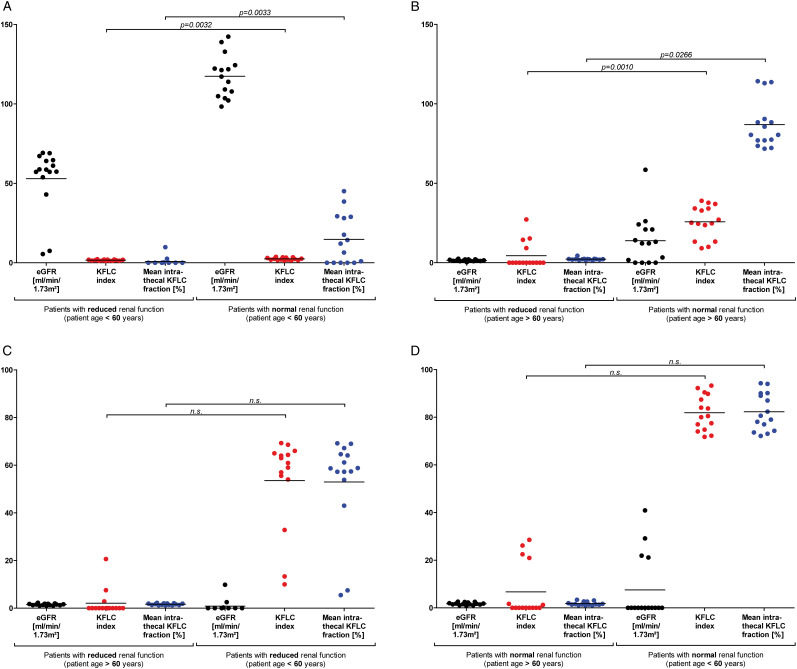
Results: All sample groups displayed declining KFLC indices and KFLC IF values with decreasing renal function (P-values between <.0001 and .0209). In "inflammatory" CSF profile samples, 15% of the patients presented a KFLC index <5.9 while 10% showed an intrathecal KFLC fraction below QKappa(lim), suggesting possible false negative KFLC results.
Conclusions: The influence of renal function should be considered while interpreting KFLC results in patients with neuroinflammatory diseases. The interpretation of KFLC in quotient diagrams is less susceptible to renal function impairment than the KFLC index and should be preferentially used.
Keywords: biomarker; cerebrospinal fluid; eGFR; kappa free light chains (KFLC); reiber’s diagram; renal function.
© The Author(s) 2021.
Conflict of interest statement
Declaration of Conflicting Interests: The authors declared no potential conflicts of interest with respect to the research, authorship, and/or publication of this article.
Figures
Similar articles
-
Kappa Free Light Chains in Cerebrospinal Fluid in Inflammatory and Non-Inflammatory Neurological Diseases.Brain Sci. 2022 Apr 3;12(4):475. doi: 10.3390/brainsci12040475. Brain Sci. 2022. PMID: 35448006 Free PMC article.
-
Reiber's Diagram for Kappa Free Light Chains: The New Standard for Assessing Intrathecal Synthesis?Diagnostics (Basel). 2019 Nov 16;9(4):194. doi: 10.3390/diagnostics9040194. Diagnostics (Basel). 2019. PMID: 31744096 Free PMC article.
-
The Increasing Role of Kappa Free Light Chains in the Diagnosis of Multiple Sclerosis.Cells. 2021 Nov 6;10(11):3056. doi: 10.3390/cells10113056. Cells. 2021. PMID: 34831279 Free PMC article. Review.
-
Application of κ free light chains in cerebrospinal fluid as a biomarker in multiple sclerosis diagnosis: development of a diagnosis algorithm.Clin Chem Lab Med. 2018 Mar 28;56(4):609-613. doi: 10.1515/cclm-2017-0285. Clin Chem Lab Med. 2018. PMID: 29087953
-
Intrathecal kappa free light chains as markers for multiple sclerosis.Sci Rep. 2020 Nov 23;10(1):20329. doi: 10.1038/s41598-020-77029-7. Sci Rep. 2020. PMID: 33230241 Free PMC article.
Cited by
-
Pilot study of cerebrospinal fluid biomarkers reveals inflammatory changes in patients with paranoid schizophrenia.Sci Rep. 2025 Aug 3;15(1):28319. doi: 10.1038/s41598-025-13367-8. Sci Rep. 2025. PMID: 40754554 Free PMC article.
-
Kappa free light chain concentration in serum is reduced after CD20-depletion with ocrelizumab.Neurol Res Pract. 2025 Aug 22;7(1):58. doi: 10.1186/s42466-025-00419-7. Neurol Res Pract. 2025. PMID: 40847377 Free PMC article.
-
Kappa Free Light Chains in Cerebrospinal Fluid in Inflammatory and Non-Inflammatory Neurological Diseases.Brain Sci. 2022 Apr 3;12(4):475. doi: 10.3390/brainsci12040475. Brain Sci. 2022. PMID: 35448006 Free PMC article.
-
The Kappa Free Light Chains Index and Central Vein Sign: Two New Biomarkers for Multiple Sclerosis Diagnosis.Neurol Ther. 2025 Jun;14(3):711-731. doi: 10.1007/s40120-025-00737-7. Epub 2025 Apr 6. Neurol Ther. 2025. PMID: 40189723 Free PMC article. Review.
-
Kappa Free Light Chain Index Correlates With Prognostic Biomarkers in Multiple Sclerosis and Decreases Slowly Following Treatment.Eur J Neurol. 2025 Jul;32(7):e70291. doi: 10.1111/ene.70291. Eur J Neurol. 2025. PMID: 40643211 Free PMC article.
References
-
- Presslauer S, Milosavljevic D, Huebl W, Aboulenein-Djamshidian F, Krugluger W, Deisenhammer F, et al.. Validation of kappa free light chains as a diagnostic biomarker in multiple sclerosis and clinically isolated syndrome: A multicenter study. Mult Scler. 2016;22(4):502-510. doi: 10.1177/1352458515594044. - DOI - PubMed
Publication types
LinkOut - more resources
Full Text Sources
Research Materials
Miscellaneous
