Comparative Study
. 2021 Nov 18:2021:3501770.
doi: 10.1155/2021/3501770. eCollection 2021.

Proteome Analysis of the Hypothalamic Arcuate Nucleus in Chronic High-Fat Diet-Induced Obesity

Affiliations
Comparative Study

Proteome Analysis of the Hypothalamic Arcuate Nucleus in Chronic High-Fat Diet-Induced Obesity

Chang Yeon Kim et al. Biomed Res Int. .

Abstract

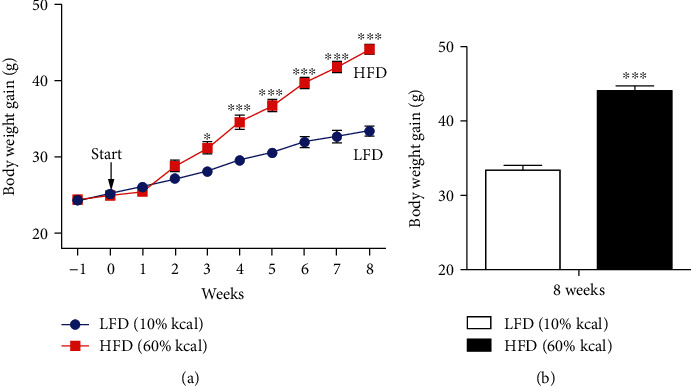
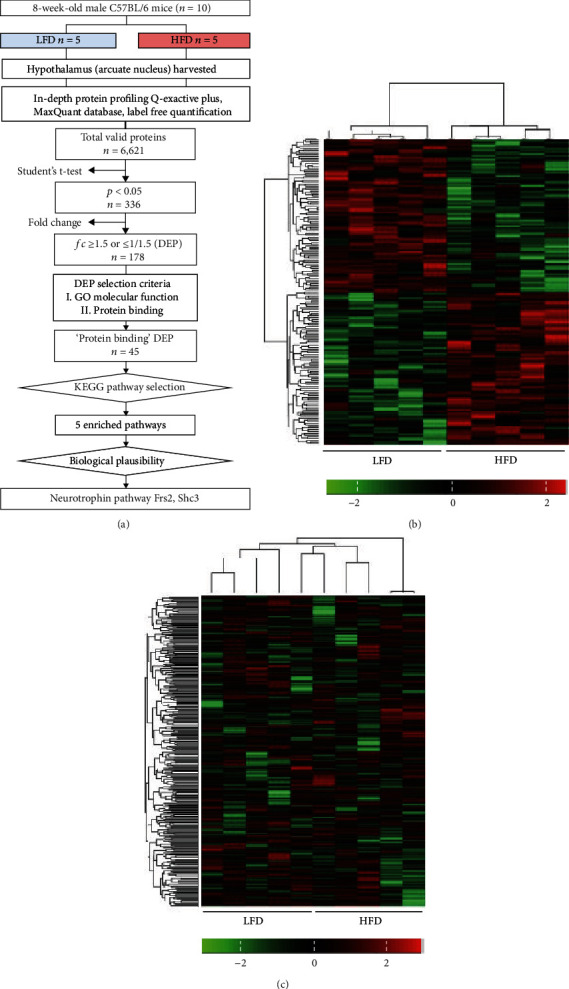
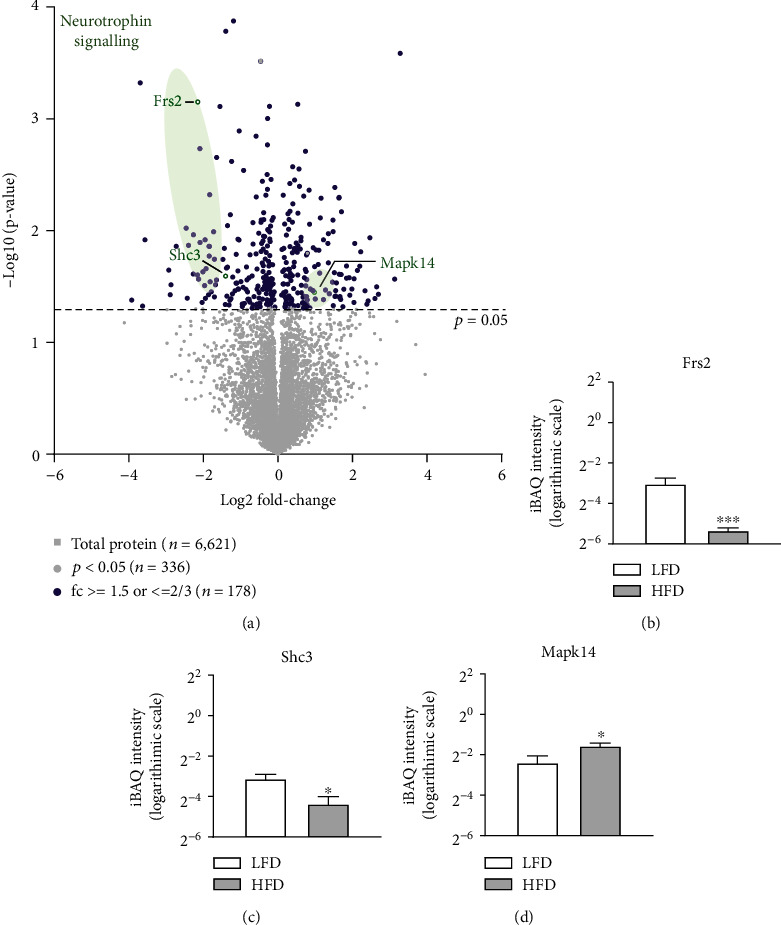
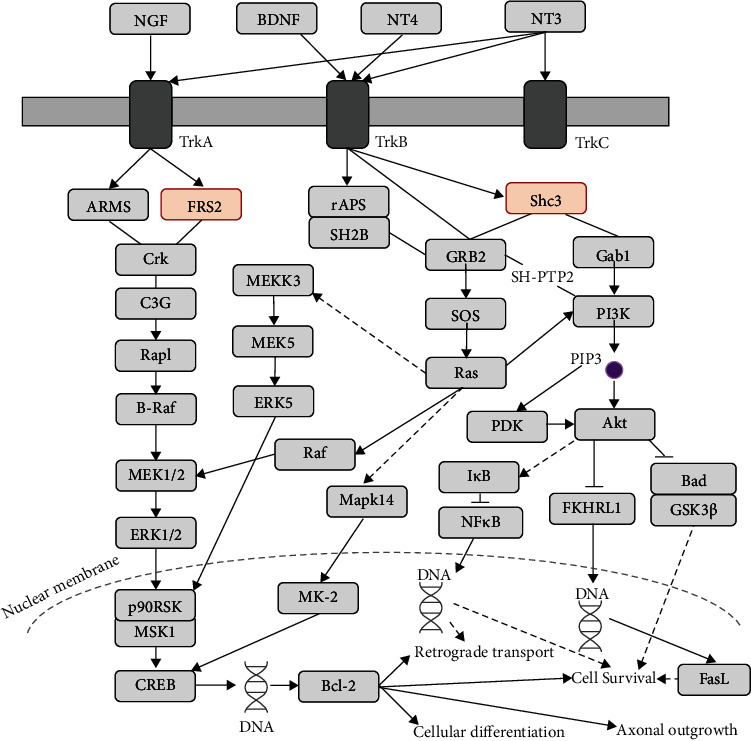
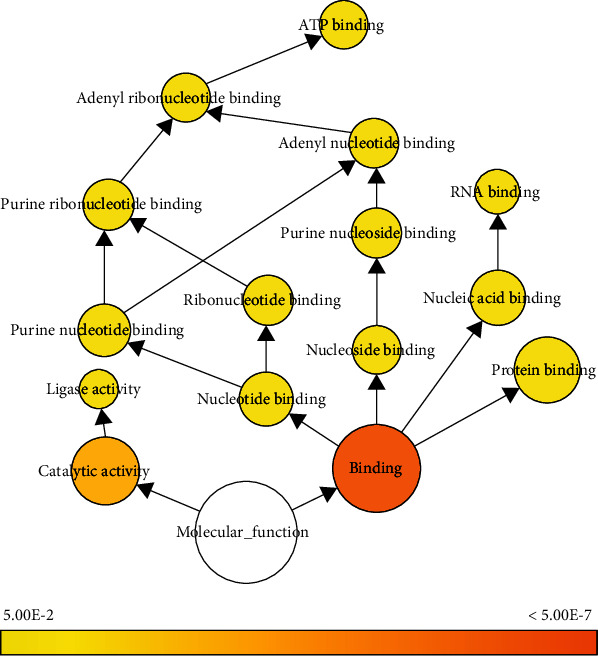
The hypothalamus plays a central role in the integrated regulation of feeding and energy homeostasis. The hypothalamic arcuate nucleus (ARC) contains a population of neurons that express orexigenic and anorexigenic factors and is thought to control feeding behavior via several neuronal circuits. In this study, a comparative proteomic analysis of low-fat control diet- (LFD-) and high-fat diet- (HFD-) induced hypothalamic ARC was performed to identify differentially expressed proteins (DEPs) related to changes in body weight. In the ARC in the hypothalamus, 6621 proteins (FDR < 0.01) were detected, and 178 proteins were categorized as DEPs (89 upregulated and 89 downregulated in the HFD group). Among the Gene Ontology molecular function terms associated with the DEPs, protein binding was the most significant. Fibroblast growth factor receptor substrate 2 (Frs2) and SHC adaptor protein 3 (Shc3) were related to protein binding and involved in the neurotrophin signaling pathway according to Kyoto Encyclopedia of Genes and Genomes analysis. Furthermore, high-precision quantitative proteomic analysis revealed that the protein profile of the ARC in mice with HFD-induced obesity differed from that in LFD mice, thereby offering insight into the molecular basis of feeding regulation and suggesting Frs2 and Shc3 as novel treatment targets for central anorexigenic signal induction.


Conflict of interest statement

The authors declare no conflicts of interest regarding the publication of this paper.

Figures

Figure 1
Figure 1
Mean change in body weight. (a) Mean body weights in the LFD (n = 5) and HFD (n = 5) groups were measured weekly from the adjustment period to the end of the experiment. (b) The mean body weight in the HFD group was significantly higher (p < 0.001) than that in the LFD group at the week of sacrifice (8 weeks after the adjustment period). p < 0.05, ∗∗∗p < 0.001, two-way repeated measures analysis of variance. LFD: low-fat control diet; HFD: high-fat diet.
Figure 2
Figure 2
Pipeline and heatmap of DEPs. (a) A total of 178 proteins were differentially expressed between the two models. Heatmap of normalized iBAQ intensity values of (b) each DEP (total 178) and (c) each valid protein (total 6,621). Scale bars are shown on the bottom right corner of each image. Left columns represent the values from the LFD group, and right columns are from the HFD group. Hierarchical clustering analysis is based on Euclidean distances. DEP: differentially expressed protein; LFD: low-fat control diet; HFD: high-fat diet.
Figure 3
Figure 3
Volcano plot of DEPs. (a) The statistical significance (−log10p value between the mean iBAQ intensities of the LFD and HFD groups) is plotted against the difference in expression intensity (log2 fold change between the mean iBAQ intensities of the LFD and HFD groups) in a volcano plot. Green dots represent Frs2 and Shc3 in the neurotrophin signaling pathway. Data were filtered in accordance with the cut-off value of p < 0.05 and a fold change ≥ 1.5 or ≤1.0/1.5. Bar graphs indicate the mean and SEM of the iBAQ intensity (logarithmic scale) in each group of proteins. (b) Frs2 (p = 7.1 × 10⁻⁴, fold change = 0.26), (c) Shc3 (p = 0.03, fold change = 0.38), and (d) Mapk14 (p = 0.0753, fold change = 1.4146). LFD: low-fat control diet; HFD: high-fat diet; iBAQ: intensity-based absolute qualification; SEM: standard error of the mean; Shc3: SHC adaptor protein 3; Frs2: fibroblast growth factor receptor substrate 2; Mapk14: mitogen-activated protein kinase 14. p < 0.05.
Figure 4
Figure 4
Neurotrophin signaling pathway and corresponding DEPs. “Neurotrophin signaling pathway” within the overall “full” KEGG pathway. DEP: differentially expressed protein; NGF: nerve growth factor; BDNF: brain-derived neurotrophic factor; NT3,4: neurotrophin 3,4; TrkA/B/C: neurotrophic receptor tyrosine kinase 1, 2, and 3; ARMS: ankyrin repeat-rich membrane-spanning protein; FRS2: fibroblast growth factor receptor substrate 2; CREB: CAMP-responsive element-binding protein; GRB2: growth factor receptor-bound protein 2; SOS: Son of Sevenless; Mapk14: mitogen-activated protein kinase 14; MK-2: mitogen-activated protein kinase-activated protein kinase 2; Gab1: GRB2-associated binding protein 1; PI3K: phosphoinositide-3-kinase; PIP3: phosphatidylinositol-3,4,5-trisphosphate; PDK: 3-phosphoinositide-dependent protein kinase-1; Bad: BCL2-associated agonist of cell death; GSK3β: glycogen synthase kinase 3 beta; FasL: Fas ligand.
Figure 5
Figure 5
Molecular functions according to GO pathways associated with DEPs and visualized using the Biological Networks GO plug-in. Colored nodes correspond to GO terms that were significant according to a p = 0.05. Node sizes represent the number of DEPs related to the corresponding GO term. GO: Gene Ontology; DEP: differentially expressed gene.

Similar articles

Cited by

References

    1. Scherer P. E., Hill J. A. Obesity, diabetes, and cardiovascular Diseases. Circulation Research . 2016;118(11):1703–1705. doi: 10.1161/CIRCRESAHA.116.308999. - DOI - PMC - PubMed
    1. Smith J. K. Exercise, obesity and CNS control of metabolic homeostasis: a review. Frontiers in Physiology . 2018;9:p. 574. doi: 10.3389/fphys.2018.00574. - DOI - PMC - PubMed
    1. Jennings J. H., Rizzi G., Stamatakis A. M., Ung R. L., Stuber G. D. The inhibitory circuit architecture of the lateral hypothalamus orchestrates feeding. Science . 2013;341(6153):1517–1521. doi: 10.1126/science.1241812. - DOI - PMC - PubMed
    1. Hommel J. D., Trinko R., Sears R. M., et al. Leptin receptor signaling in midbrain dopamine neurons regulates feeding. Neuron . 2006;51(6):801–810. doi: 10.1016/j.neuron.2006.08.023. - DOI - PubMed
    1. Joly-Amado A., Cansell C., Denis R. G. P., et al. The hypothalamic arcuate nucleus and the control of peripheral substrates. Best Practice & Research Clinical Endocrinology & Metabolism . 2014;28(5):725–737. doi: 10.1016/j.beem.2014.03.003. - DOI - PubMed

Publication types

MeSH terms