

Association of air pollution and meteorological variables with the two waves of COVID-19 pandemic in Delhi: A critical analysis
- PMID: 34841120
- PMCID: PMC8610833
- DOI: 10.1016/j.heliyon.2021.e08468
Association of air pollution and meteorological variables with the two waves of COVID-19 pandemic in Delhi: A critical analysis
Abstract
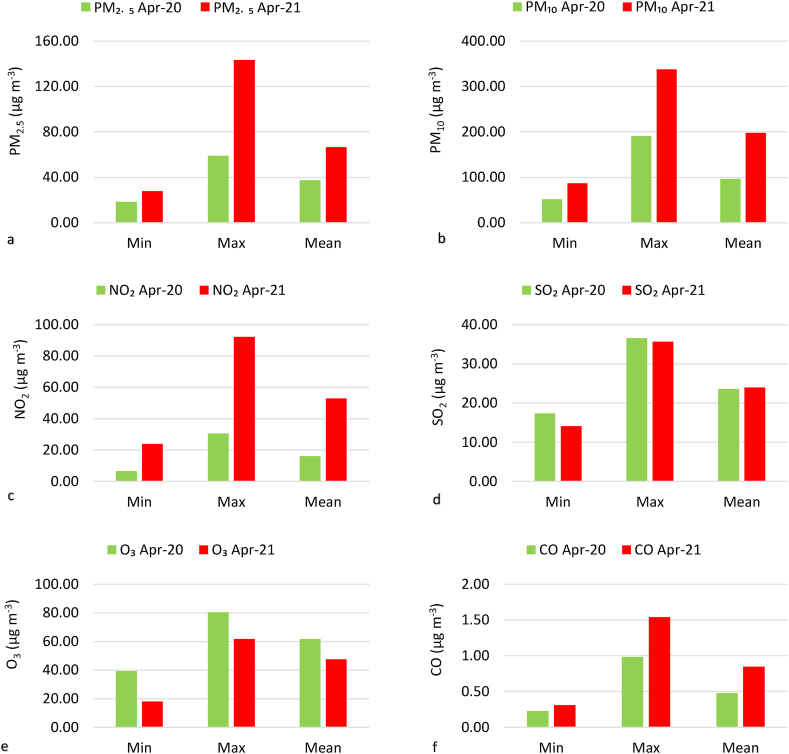
Various countries across the globe have been affected by different COVID-19 waves at different points in time and with varying levels of virulence. With the backdrop of the two COVID-19 waves that broke out in Delhi, this study examines the variations in the concentrations of criteria pollutants, air quality, and meteorological variables across the waves and their influence on COVID-19 morbidity/mortality. Descriptive statistics, violin plots, and Spearman rank correlation tests were employed to assess the variations in environmental parameters and investigate their associations with COVID-19 incidence under the two waves. The susceptible-infected-recovered model and multiple linear regression were used to assess the wave-wise basic reproduction number (R0) and infection spreading trajectory of the virus. Our results show that the first wave in Delhi had three successive peaks and valleys, and the first peak of the second wave was the tallest, indicating the severity of per-day infection cases. During the analysed period (April 2020 and April 2021), concentrations of criteria pollutants varied across the waves, and air pollution was substantially higher during the second wave. In addition, the results revealed that during the second wave, NO2 maintained a significant negative relationship with COVID-19 (cases per day), while SO2 had a negative relationship with COVID-19 (cumulative cases) during the first wave. Our results also show a significant positive association of O3 with COVID-19 deaths during the first wave and cumulative cases and deaths during the second wave. The study indicates that a higher relative humidity in Delhi had a negative relation with COVID-19 cumulative cases and mortality during the first wave. The study confirms that the estimated R0 was marginally different during the two waves, and the spread of COVID-19 new cases followed a cubic growth trajectory. The findings of this study provide valuable information for policymakers in handling COVID-19 waves in various cities.
Keywords: Air quality; COVID-19 successive waves; Environmental variables; Infection spreading trajectory; Reproduction rate.
© 2021 The Author(s).
Conflict of interest statement
The authors declare no conflict of interest.
Figures


Similar articles
-
Effects of short-term exposure to air pollution on hospital admissions of young children for acute lower respiratory infections in Ho Chi Minh City, Vietnam.Res Rep Health Eff Inst. 2012 Jun;(169):5-72; discussion 73-83. Res Rep Health Eff Inst. 2012. PMID: 22849236
-
Air pollution and meteorological variables' effects on COVID-19 first and second waves in Spain.Int J Environ Sci Technol (Tehran). 2023;20(3):2869-2882. doi: 10.1007/s13762-022-04190-z. Epub 2022 May 4. Int J Environ Sci Technol (Tehran). 2023. PMID: 35529588 Free PMC article.
-
Impact of Environmental Indicators on the COVID-19 Pandemic in Delhi, India.Pathogens. 2021 Aug 9;10(8):1003. doi: 10.3390/pathogens10081003. Pathogens. 2021. PMID: 34451467 Free PMC article.
-
Temperature, humidity and outdoor air quality indicators influence COVID-19 spread rate and mortality in major cities of Saudi Arabia.Environ Res. 2022 Mar;204(Pt B):112071. doi: 10.1016/j.envres.2021.112071. Epub 2021 Sep 23. Environ Res. 2022. PMID: 34562487 Free PMC article.
-
A review of the impact of environmental factors and pollutants on covid-19 transmission.Aerobiologia (Bologna). 2022;38(3):277-286. doi: 10.1007/s10453-022-09748-5. Epub 2022 Jun 23. Aerobiologia (Bologna). 2022. PMID: 35761858 Free PMC article. Review.
Cited by
-
Spatial shifting of COVID-19 clusters and disease association with environmental parameters in India: A time series analysis.Environ Res. 2023 Apr 1;222:115288. doi: 10.1016/j.envres.2023.115288. Epub 2023 Jan 19. Environ Res. 2023. PMID: 36682443 Free PMC article.
References
-
- Andersen Z.J., Hoffmann B., Morawska L., Adams M., Furman E., Yorgancioglu A., Greenbaum D., Neira M., Brunekreef B., Forastiere F., Rice M.B., Wakenhut F., Coleen E., Boogaard H., Gehring U., Melén E., Ward B., De Matteis S. Air pollution and COVID-19: clearing the air and charting a post-pandemic course: a joint workshop report of ERS, ISEE, HEI and WHO. Eur. Respir. J. 2021;58(2):2101063. - PMC - PubMed
-
- Anhäuser A., Farrow A. Behind the smokescreen: satellite data reveal air pollution increase in India's eighth-most populous state capitals. 2021. https://www.greenpeace.org/static/planet4-india-stateless/2021/07/52c7cd... Available at:
LinkOut - more resources
Full Text Sources
Miscellaneous
