. 2022 Mar;7(1):16-29.
doi: 10.1016/j.idm.2021.11.003. Epub 2021 Nov 19.

Impact of asymptomatic COVID-19 carriers on pandemic policy outcomes

Affiliations

Impact of asymptomatic COVID-19 carriers on pandemic policy outcomes

Weijie Pang et al. Infect Dis Model. 2022 Mar.

Abstract

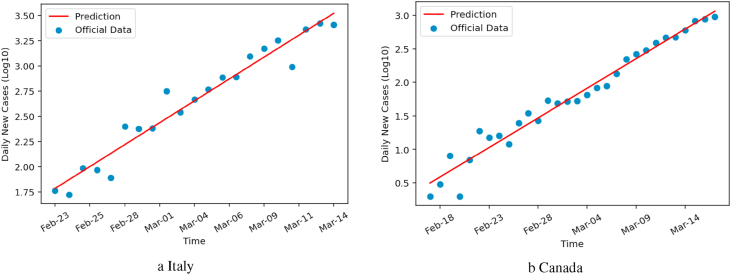
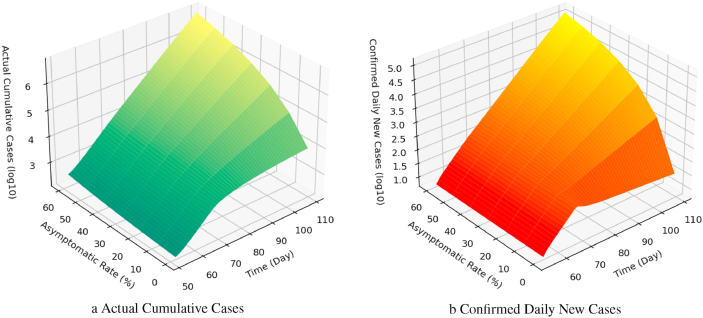
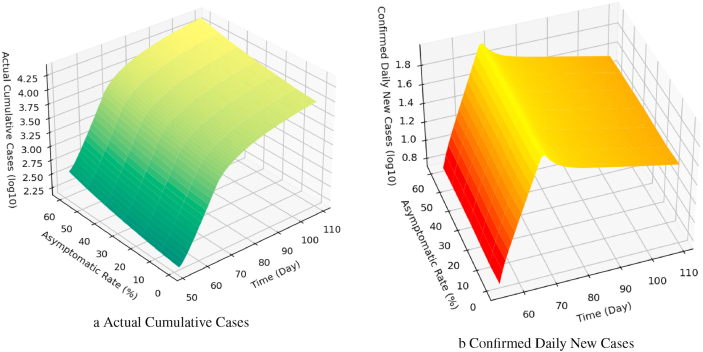
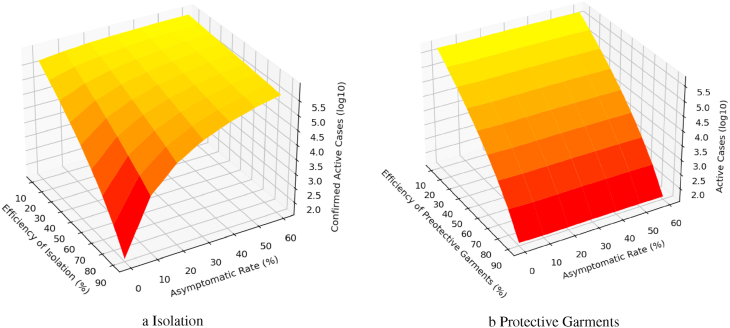
This paper provides a mathematical model that makes it clearly visible why the underestimation of r, the fraction of asymptomatic COVID-19 carriers in the general population, may lead to a catastrophic reliance on the standard policy intervention that attempts to isolate all confirmed infectious cases. The SE(A+O)R model with infectives separated into asymptomatic and ordinary carriers, supplemented by a model of the data generation process, is calibrated to standard early pandemic datasets for two countries. It is shown that certain fundamental parameters, critically r, are unidentifiable with this data. A general analytical framework is presented that projects the impact of different types of policy intervention. It is found that the lack of parameter identifiability implies that some, but not all, potential policy interventions can be correctly predicted. In an example representing Italy in March 2020, a hypothetical optimal policy of isolating confirmed cases that aims to reduce the basic reproduction number R 0 of the outbreak from 4.4 to 0.8 assuming r = 0, only achieves 3.8 if it turns out that r = 40%.

Keywords: COVID-19; Infectious disease model; Non-pharmaceutical intervention; Pre-symptomatic; SIR model.


Conflict of interest statement

None.

Figures

Fig. 1
Fig. 1
Simulation and official data of daily new cases (DNC) for Italy and Canada in the pre-policy calibration period [T1, T2 + 5].
Fig. 2
Fig. 2
ITALY: The model prediction showing the effect of the maximal isolation policy if implemented at the policy time T2 (March 10, 2020). Here we fix the pre-policy ratio ρ = αA/αO = 4, the transmission reduction factor f = 0.9 and the confirmation factor φO = 0.9, and plot over the period [T1, T3] for varying r. The first graph shows the logarithm of the actual cumulative cases consisting of all symptomatic and asymptomatic infections plus removed cases. The second graph shows the logarithm of the confirmed daily new cases.
Fig. 3
Fig. 3
ITALY: The model prediction showing the effect of the maximally protective garments if implemented at the policy time T2 (March 10, 2020). Here we fix the policy factors v3 = 0.85, e3 = 0.95, and show that the pandemic curve over the period [T1, T3] is independent of r. These graphs are independent of ρ. The first graph shows the logarithm of the actual cumulative cases consisting of all symptomatic and asymptomatic infections plus removed patients. The second graph shows the logarithm of the confirmed daily new cases.
Fig. 4
Fig. 4
The effect of isolation and protective garments compared: These graphs show the logarithm of the active confirmed cases in Italy at time T3 corresponding to April 20, 2020. The left graph shows the dependence on the effort expended on isolation, v1e1 ∈ [0, 1], and on the asymptomatic rate r ∈ [0, 0.6]. The right graph shows the dependence on the effort expended on protective garments, v3e3 ∈ [0, 1], and on the asymptomatic rate r ∈ [0, 0.6] when φ = 1 and ρ = 4.
Fig. 5
Fig. 5
This plot shows the effective R0p after policy date T2 in Italy as a function of e1, eGPP, when isolation is applied with effort e1 and v1 = 0.8, and general personal protection is applied with effort eGPP and vGPP = 0.91. The darkness of the red colour denotes the value of R0p. Plot (a) shows results when r = 40%, (b) assumes r = 10%; both plots have ρ = 4.

References

    1. Arino J., Brauer F., Van Den Driessche P., James W., Wu J. A model for influenza with vaccination and antiviral treatment. Journal of Theoretical Biology. 2008;253(1):118–130. - PubMed
    1. Arons M.M., Hatfield K.M., Reddy S.C., Kimball A., James A., Jacobs J.R., Taylor J., Kevin Spicer, Bardossy A.C., Oakley L.P., et al. Presymptomatic SARS-CoV-2 infections and transmission in a skilled nursing facility. New England Journal of Medicine. 2020;382(22):2081–2090. - PMC - PubMed
    1. Bai Y., Yao L., Tao W., Tian F., Jin D.-Y., Chen L., Wang M. Presumed asymptomatic carrier transmission of COVID-19. Journal of the American Medical Association. 2020;323(14):1406–1407. - PMC - PubMed
    1. Bousema T., Okell L., Felger I., Drakeley C. Asymptomatic malaria infections: Detectability, transmissibility and public health relevance. Nature Reviews Microbiology. 2014;12(12):833–840. - PubMed
    1. Byambasuren O., Cardona M., Bell K., Clark J., McLaws M.-L., Paul G. Estimating the extent of asymptomatic COVID-19 and its potential for community transmission: Systematic review and meta-analysis. Official Journal of the Association of Medical Microbiology and Infectious Disease Canada. 2020;5(4):223–234. - PMC - PubMed

LinkOut - more resources