. 2021 Nov 15;2(4):100947.
doi: 10.1016/j.xpro.2021.100947. eCollection 2021 Dec 17.

Optogenetic axon guidance in embryonic zebrafish

Affiliations

Optogenetic axon guidance in embryonic zebrafish

James M Harris et al. STAR Protoc. .

Abstract

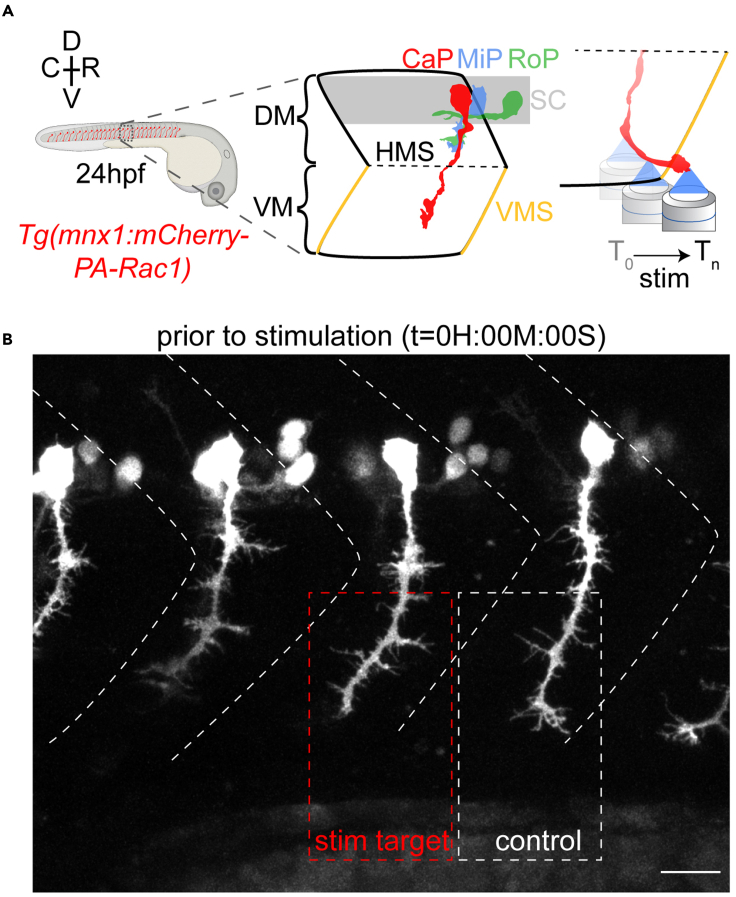
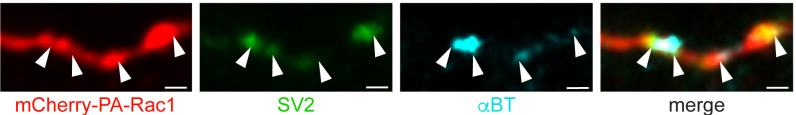
Axons form the long-range connections of biological neuronal networks, which are built through the developmental process of axon guidance. Here, we describe a protocol to precisely and non-invasively control axonal growth trajectories in live zebrafish embryos using focal light activation of a photoactivatable Rac1. We outline techniques for photostimulation, time-lapse imaging, and immunohistochemistry. These approaches enable engineering of long-range axonal circuitry or repair of defective circuits in living zebrafish, despite a milieu of competing endogenous signals and repulsive barriers. For complete details on the use and execution of this protocol, please refer to Harris et al. (2020).

Keywords: Developmental biology; Microscopy; Model Organisms; Molecular Biology; Neuroscience.


Conflict of interest statement

P.A. is a consultant for Herophilus, Foresite Labs, and the New York Stem Cell Foundation. P.A. is a co-founder of Serqet Therapeutics. A patent application is pending based on this work (applicants: President and Fellows of Harvard College; inventors: P.A. and J.M.H). All other authors declare no competing interests.

Figures

None
Graphical abstract
Figure 1
Figure 1
Zebrafish husbandry and embryo generation (A) Male and female zebrafish are set up in a breeding tank separated by a divider. (B) The following morning, the divider is removed allowing zebrafish to breed. Embryos are collected by pouring fish water through a tea strainer. (C) Collected embryos in a tea strainer. (D) Embryos are transferred to a petri dish. (E) Embryos in a petri dish. (F) Fish water is removed with a transfer pipette and replaced with E3 with 0.1% methylene blue.
Figure 2
Figure 2
Zebrafish mounting in agarose for imaging (A) Embryos are dissected using fine forceps by first pinching the chorion with forceps. (B) A second pair of forceps is then used to peel away the chorion. (C) Embryos are then anesthetized in 0.0168% tricaine in E3 and oriented with a gel-loading pipette tip in 1% agarose. (D) Multiple embryos can be mounted in a glass bottom dish. Orienting the fish in a column allows them to be easily located on the confocal microscope. Scale bar 1cm.
Figure 3
Figure 3
Smart setup of mCherry fluorescent imaging in Zeiss Zen Black software (A) Select mCherry as the “Dye” from a library of fluorophores. (B) The “Fastest” imaging strategy is chosen.
Figure 4
Figure 4
Enable the appropriate detectors and DIC optics (A) Enable the T-PMT and optionally the GaAsP2 detector and ensure the appropriate filters are in place. (B) The Zeiss microscope control touch screen “Home” panel provides information on the appropriate DIC condenser for the current objective. (C) Input the parameters from B into the DIC optics under the “Locate” tab in the Zen software.
Figure 5
Figure 5
Anatomy of zebrafish embryonic primary motor neurons (A) The caudal primary (CaP) spinal motor neurons extend their sole axon into the ventral myotome at this point in development. (B) Individual CaP neurons are targeted for optogenetic stimulation with their neighbors serving as internal controls. Somitic boundaries are shown by dashed white chevrons (scale bar, 20 μm). R, rostral; C, caudal; D, dorsal; V, ventral; DM, dorsal myotome; SC, spinal cord; VM, ventral myotome; HMS, horizontal myoseptum; VMS, vertical myoseptum; CaP, MiP, and RoP, caudal, middle, and rostral primary spinal motor neurons, respectively. Reproduced from Harris et al. (2020).
Figure 6
Figure 6
Microscope settings for Z-stack acquisition Ensure the Z-stack function is enabled and set the first and last image planes by focusing the microscope at the top and bottom of the desired Z-stack and clicking the corresponding button. Use the “Optimal” button to set the number of slices and distance between slices.
Figure 8
Figure 8
Image capture settings for optogenetic axon guidance These parameters allow axonal growth to be monitored without phototoxicity or photobleaching over extended imaging periods.
Figure 9
Figure 9
Parameters for time-lapse imaging Imaging is alternated with stimulation without any delay and stopped manually to update the region of stimulation.
Figure 10
Figure 10
Bleaching settings for focal illumination 458nm light is delivered in a circular region of interest targeted at the leading edge of the growth cone to induce outgrowth via PA-Rac1 activation.
Figure 7
Figure 7
Time lapse imaging and optogenetic stimulation paradigm To establish the initial and final axonal morphologies, high-quality 3D Z-stack images (stacked yellow rectangles) are acquired in the mCherry channel before and after the optogenetic stimulation experiment. During the axon guidance experiment, a 2D single plane image in the mCherry channel is acquired (yellow rectangles) over a period of 1–7 s using the 561nm laser. Immediately following image acquisition, PA-Rac1 is photoactivated (blue rectangle) for a period of 2ms using the 458nm laser within a region of interest 3–30 μm. This imaging-stimulation cycle is repeated to induce axonal outgrowth into the region of interest. For both 2D imaging and optogenetic stimulation, each pixel is illuminated for 0.28μs.
Figure 11
Figure 11
Optogenetic axon guidance of zebrafish CaP spinal motor neurons across repulsive myoseptal boundaries Time series of unstimulated axons (upper series) and axons subjected to focal optogenetic activation of PA-Rac1 at the growth cone (blue circle). The initial axonal position (white arrowhead) and vertical myoseptal boundaries (white dashed line) are shown (scale bar, 20 μm). Reproduced from Harris et al. (2020).
Figure 12
Figure 12
Immunohistochemical markers of novel synapse formation Synaptic vesicle 2 (SV2, green, middle left) and α-bungarotoxin (αBT, cyan, middle right) are colocalized (merge, right) within a spinal motor axon expressing mCherry (red, left) that has been optogenetically guided to a novel target (scale bar, 5 μm). Reproduced from Harris et al. (2020).

References

    1. Aljiboury A.A., Mujcic A., Cammerino T., Rathbun L.I., Hehnly H. Imaging the early zebrafish embryo centrosomes following injection of small-molecule inhibitors to understand spindle formation. STAR Protoc. 2021;2:100293. - PMC - PubMed
    1. Beattie C.E. Control of motor axon guidance in the zebrafish embryo. Brain Res. Bull. 2000;53:489–500. - PubMed
    1. Costes S.V., Daelemans D., Cho E.H., Dobbin Z., Pavlakis G., Lockett S. Automatic and quantitative measurement of protein-protein colocalization in live cells. Biophysical J. 2004;86:3993–4003. - PMC - PubMed
    1. Engerer P., Plucinska G., Thong R., Trovo L., Paquet D., Godinho L. Imaging subcellular structures in the living zebrafish embryo. J. Vis. Exp. 2016;110:e53456. - PMC - PubMed
    1. Graeden E., Sive H. Live imaging of the zebrafish embryonic brain by confocal microscopy. J. Vis. Exp. 2009;26:1217. - PMC - PubMed

Publication types