. 2022 Jan 1;15(1):dmm047621.
doi: 10.1242/dmm.047621. Epub 2022 Jan 27.

Novel patient-derived models of desmoplastic small round cell tumor confirm a targetable dependency on ERBB signaling

Affiliations

Novel patient-derived models of desmoplastic small round cell tumor confirm a targetable dependency on ERBB signaling

Roger S Smith et al. Dis Model Mech. .

Abstract

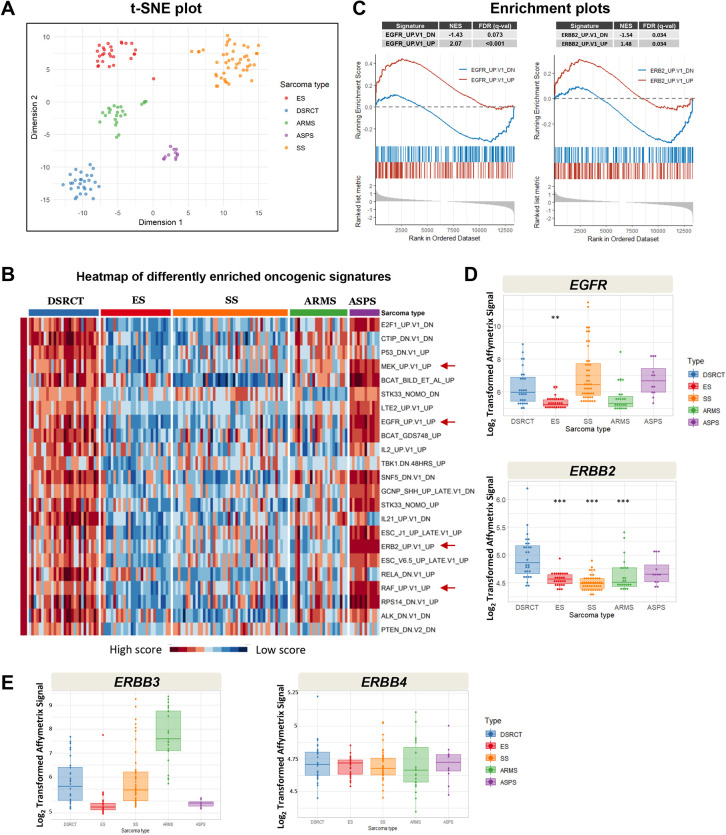
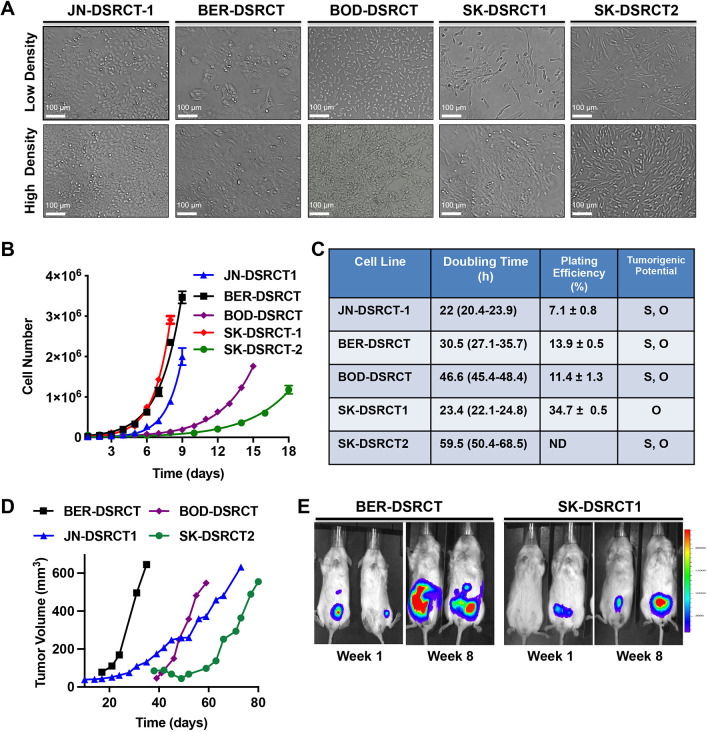
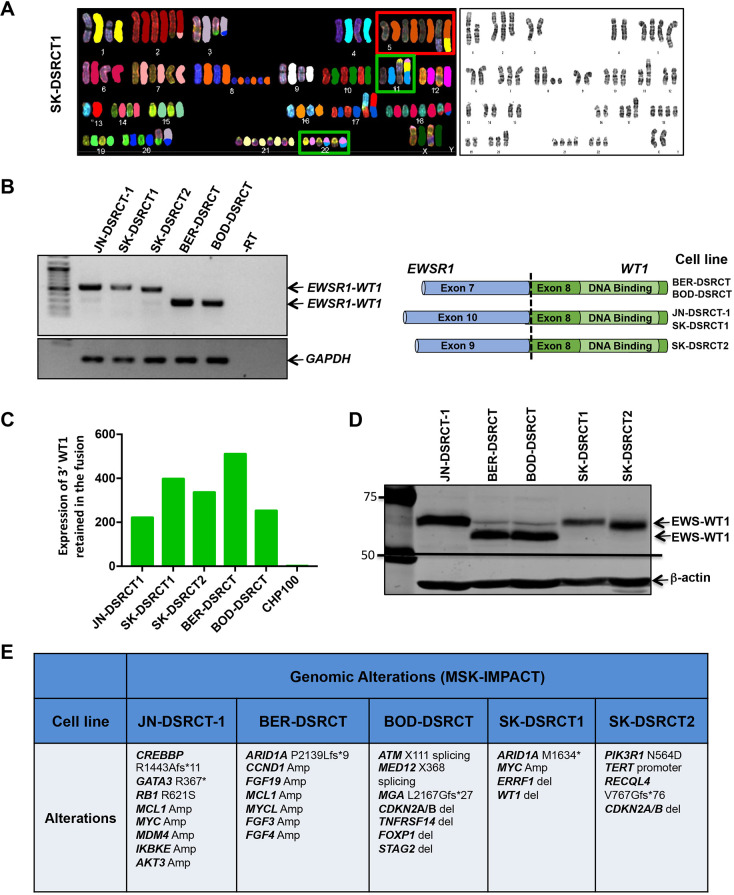
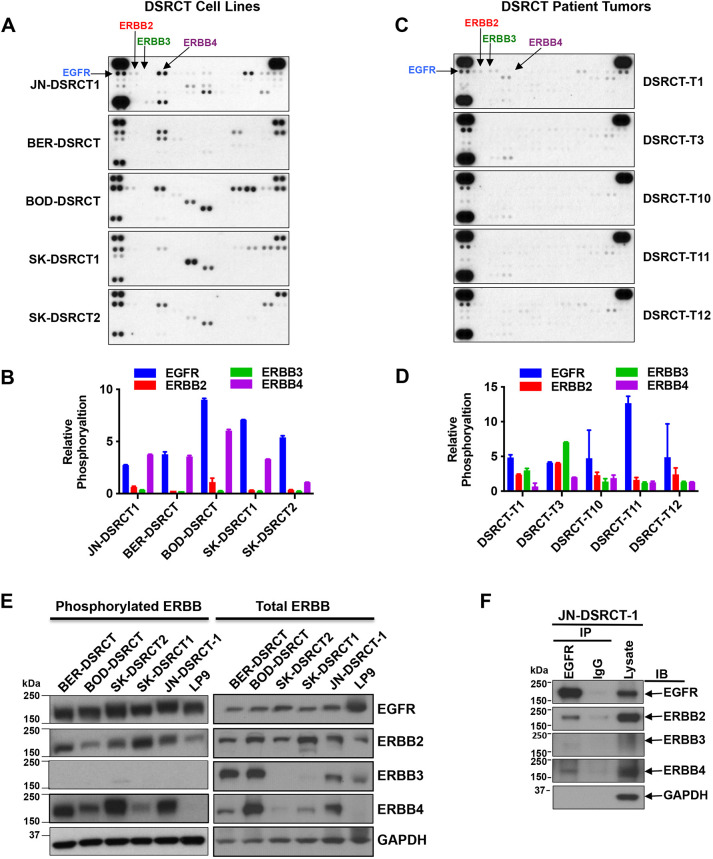
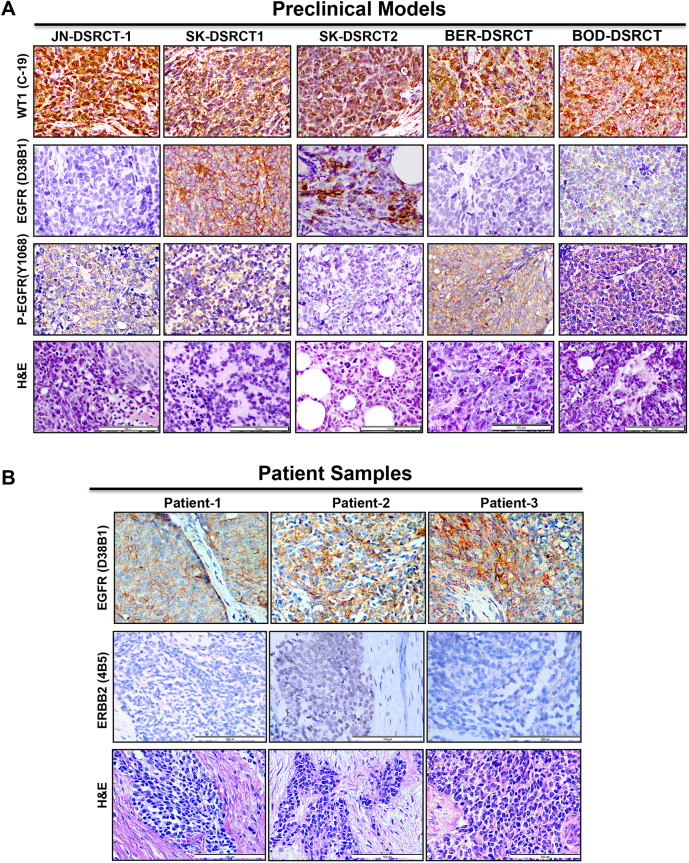
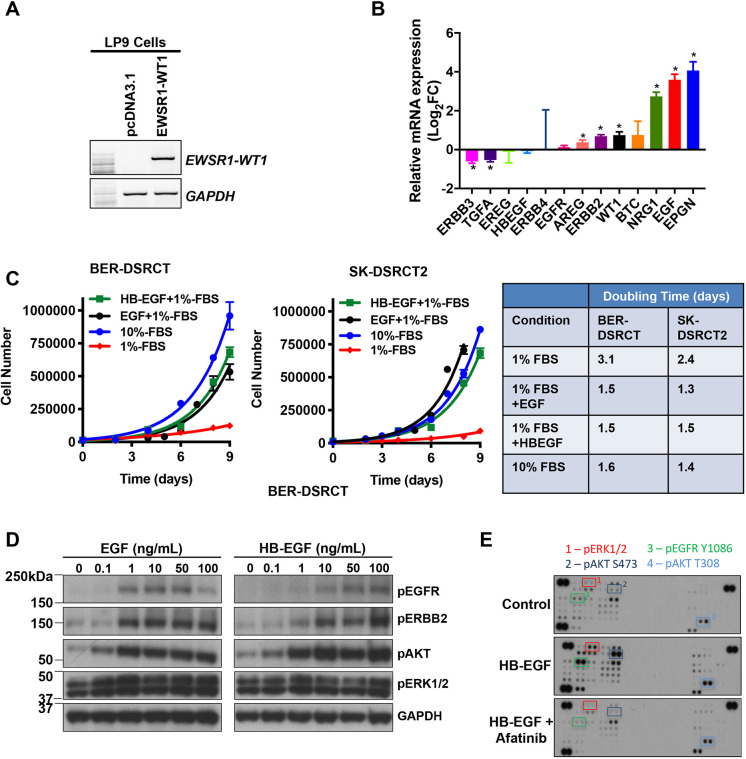
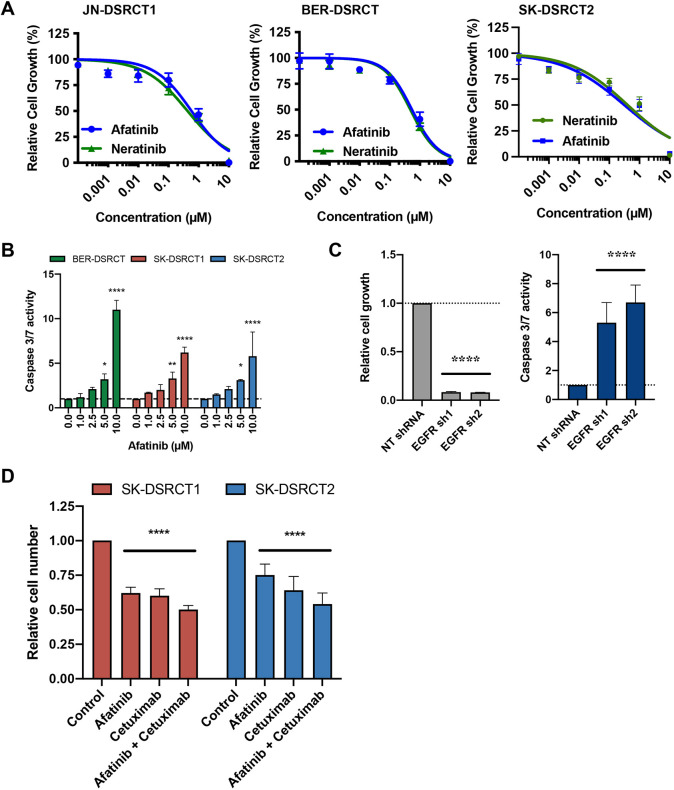
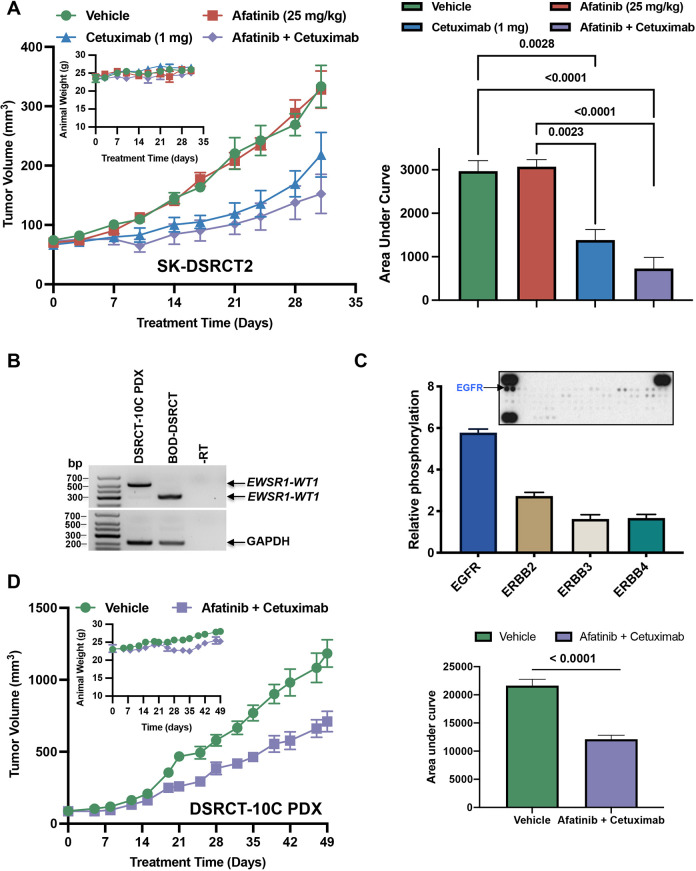
Desmoplastic small round cell tumor (DSRCT) is characterized by the t(11;22)(p13;q12) translocation, which fuses the transcriptional regulatory domain of EWSR1 with the DNA-binding domain of WT1, resulting in the oncogenic EWSR1-WT1 fusion protein. The paucity of DSRCT disease models has hampered preclinical therapeutic studies on this aggressive cancer. Here, we developed preclinical disease models and mined DSRCT expression profiles to identify genetic vulnerabilities that could be leveraged for new therapies. We describe four DSRCT cell lines and one patient-derived xenograft model. Transcriptomic, proteomic and biochemical profiling showed evidence of activation of the ERBB pathway. Ectopic expression of EWSR1-WT1 resulted in upregulation of ERRB family ligands. Treatment of DSRCT cell lines with ERBB ligands resulted in activation of EGFR, ERBB2, ERK1/2 and AKT, and stimulation of cell growth. Antagonizing EGFR function with shRNAs, small-molecule inhibitors (afatinib, neratinib) or an anti-EGFR antibody (cetuximab) inhibited proliferation of DSRCT cells. Finally, treatment of mice bearing DSRCT xenografts with a combination of cetuximab and afatinib significantly reduced tumor growth. These data provide a rationale for evaluating EGFR antagonists in patients with DSRCT. This article has an associated First Person interview with the joint first authors of the paper.

Keywords: DSRCT PDX; EGFR; EWSR1-WT1; Sarcoma proteomics.


Conflict of interest statement

Competing interests R.S.S., I.O., Z.L., A.J.-W.L., T.H., M.V., Y.S., L.D., M.S.M., H.A.R., M.S., G.B., A.B.H., E.G., S.K., H.M., I.K., E.D.S., M.P.L.Q., J.Y., M. Laé, S.B.L. and L.S. report no potential competing interest. J.H. is a Scientific Editor at DMM but was not included in any aspect of the editorial handling of this article. C.A.P. has received consulting fees from Genentech/Roche and receives research funding from Kura Oncology for studies not related to this paper. M. Ladanyi has received advisory board compensation from Boehringer Ingelheim, AstraZeneca, Bristol-Myers Squibb, Takeda, Bayer and Paige.AI, and research support from LOXO Oncology, Helsinn Healthcare, Elevation Oncology and Merus. R.S. has received research grants from Merus, Helsinn Healthcare, LOXO Oncology and Elevation Oncology for studies unrelated to this paper.

Figures

Fig. 1.
Fig. 1.
Analysis of mRNA expression data in 137 sarcoma samples reveals activation of the ERBB pathway in DSRCT. (A) t-SNE analysis. Sarcoma type-specific clustering of samples supports intergroup differential expression analysis. (B) GSVA heatmap. GSVA is a non-parametric unsupervised method that allows the assessment of gene set enrichment in each individual sample. ‘Oncogenic signatures’ from the Molecular Signature Database were queried. Enrichment scores were then compared in sarcoma types using linear regression, and the top gene sets differentially enriched in DSRCT relative to other sarcomas are presented as a heatmap. (C) GSEA analysis was also performed comparing DSRCT to ES samples using oncogenic signatures. Enrichment plots for ERBB-related pathways are presented with NESs and FDR (q-value). (D) Box plots of the expression of EGFR (top) and ERBB2 (bottom). (E) Box plots of the expression of ERBB3 and ERBB4. Box plots show the median. Log2-transformed raw values are presented. ***adjusted P<0.0001, **adjusted P=0.008 (unpaired, one-tailed Student's t-test). **, *** refer only to pairwise comparisons where expression is higher in DSRCT. ARMS, alveolar rhabdomyosarcoma; ASPS, alveolar soft-part sarcoma; DSRCT, desmoplastic small round cell tumor; ES, Ewing sarcoma; FDR, false discovery rate; GSEA, gene set enrichment analysis; GSVA, Gene Set Variability Analysis; NES, normalized enrichment score; SS, synovial sarcoma; t-SNE, t-distributed stochastic neighbor embedding.
Fig. 2.
Fig. 2.
Generation and characterization of novel DSRCT preclinical models. (A) Phase-contrast images of DSRCT cell lines (100× magnification). (B) Growth characteristics of DSRCT cell lines in culture. (C) Doubling time, plating efficiency and tumorigenic potential of cells. (D) DSRCT cell lines were implanted into the subcutaneous flank of immunocompromised mice and tumors were measured twice weekly. Data represent the average volume of two tumors per cell line. (E) Cell lines stably expressing a luciferase construct were implanted into the peritoneal cavity of immunocompromised mice, and bioluminescence images were acquired weekly. The first (1 week after implantation) and last (8 weeks after implantation) images are shown. O, orthotopic; S, subcutaneous.
Fig. 3.
Fig. 3.
Cytogenetic, genetic and genomic characteristics of novel DSRCT cell lines. (A) Spectral (left) or DAPI-banded (right) karyotypes of SK-DSRCT1 cells illustrating the translocation between chromosomes 11 and 22, resulting in the oncogenic chimeric transcription factor. EWSR1-WT1 is shown in the green boxes; Chr5 polysomy is shown in the red box. The karyotypes of all cell lines are shown in Fig. S1. (B) RT-PCR conducted on five DSRCT cell lines showing expression of the EWSR1-WT1 fusion (left). PCR amplicons were TOPO cloned and then validated by orthogonal DNA sequencing. The exons of EWSR1 and WT1 that were fused in each cell line are shown in the schematic (right). (C) Expression of 3′ WT1 mRNA retained in the fusion. EWSR1-WT1 mRNA level is expressed relative to that of native WT1 in CHP100 (ES cell line). (D) Western blot analysis of EWS-WT1 using an anti-WT1 antibody targeting the C-terminal region of WT1 in DSRCT cell lines. (E) DNA was profiled by the MSK-IMPACT platform to identify genomic alterations in cell lines.
Fig. 4.
Fig. 4.
Expression and activation of ERBB family members in novel DSRCT cell lines. (A-D) Receptor tyrosine kinase (RTK) arrays were used to profile phosphorylated RTKs in DSRCT cell lines (A,B) or tumors (C,D). Proteomic arrays were imaged on X-ray films and quantitated by densitometry. Values are expressed relative to values obtained in CHP100 cells (ES cell line). (E) Phosphorylation of ERBBs was examined by western blotting using phospho-specific antibodies. LP9, non-tumorigenic mesothelial cell line. (F) EGFR was immunoprecipitated from JN-DSRCT-1 cells and then western blot analysis was conducted to identify other ERBB family RTKs that are associated with it.
Fig. 5.
Fig. 5.
Detection of WT1, EGFR, phospho-EGFR and ERBB2 by immunohistochemistry. (A) Expression of WT1, EGFR and phospho-EGFR in paraffin-embedded xenograft tumors or cell pellet (SK-DSRCT1). Hematoxylin and Eosin (H&E) staining of corresponding slides is shown in the bottom row. (B) Expression of EGFR and ERBB2 in DSRCT patient samples. H&E staining of corresponding slides is shown in the bottom row. Representative photomicrographs are shown. Scale bars: 100 µm.
Fig. 6.
Fig. 6.
ERBB pathway genes are altered by expression of EWS-WT1 and regulate growth of DSRCT cell lines. (A,B) A cDNA encoding EWS-WT1 or empty plasmid (pcDNA 3.1) was expressed in LP9 cells (A) and then expression of known ERBB receptors and ligands was determined by qPCR (B). Expression of EWSR1-WT1 was confirmed by RT-PCR. mRNA levels in LP9-EWS-WT1 cells are expressed relative to that in LP9-pcDNA3.1 (empty plasmid). *P<0.05 (unpaired, two-tailed Student’s t-test). (C) EGFR ligands are sufficient to stimulate growth of DSRCT cell lines. Results represent the mean±s.d. of two independent experiments. Growth data were fitted to an exponential growth equation using GraphPad Prism 7 software and the doubling time is shown in the right panel. (D) BOD-DSRCT cells were serum starved for 24 h and then stimulated with the indicated concentrations of EGF or HB-EGF for 15 min. Western blotting was then performed for the phosphorylated proteins shown or GAPDH. (E) BER-DSRCT cells were pretreated with DMSO or 0.25 μM afatinib for 30 min and then stimulated with 100 ng/ml HB-EGF for 15 min. Phosphokinase arrays were then used to assess the phosphorylation state of selected signaling proteins. (E) Representative images of phosphokinase arrays. Arrays were quantitated by densitometry, and the relative changes in phosphorylation above DMSO-treated control cells are shown in Fig. S3.
Fig. 7.
Fig. 7.
EGFR antagonists inhibit growth of novel DSRCT cell lines. (A,B) Cells were treated with increasing doses of afatinib or neratinib and then either viability (A) or caspase 3/7 activity (B) was measured. Results represent the mean±s.d. of three (A) or two (B) independent experiments in which each condition was assayed in triplicate (A) or duplicate (B) determinations. (C) BER-DSRCT cells were infected with lentivirus harboring shRNAs (scrambled control or targeting EGFR) and then the relative number of cells (left) or caspase 3/7 activity (right) was determined. Results represent the mean±s.d. of two experiments in which there were three replicates of each condition. (D) Cells were treated with 1 μM afatinib, 100 ng/ml cetuximab, or 1 μM afatinib+100 ng/ml cetuximab for 48 h.****P<0.0001, **P<0.001, *P<0.05, compared to vehicle-treated or non-targeting (NT) shRNA control (unpaired, one-tailed Student’s t-test).
Fig. 8.
Fig. 8.
EGFR antagonists inhibit growth of novel DSRCT xenograft tumors. (A-D) SK-DSRCT2 cells (A) or DSRCT-10Cpdx tumors (B-D) were implanted subcutaneously into the flank of immunocompromised mice and treatment began when tumors reached ∼100 mm3. Mice were treated with vehicle, afatinib (25 mg/kg, QD, 5 days/week), cetuximab (1 mg, BIW), or a combination of cetuximab and afatinib. (A) Tumor volume measurements of SK-DSRCT2 xenografts with animal weight shown in the inset. Treatment was initiated 53 days after implantation. Area-under-the-curve (AUC) analysis is shown on the right. (B) Expression of EWRS1-WT1 fusion was confirmed in the DSRCT-10Cpdx tumor by RT-PCR. (C) The phosphorylation level of RTKs was examined using an RTK array. The array was quantitated by densitometry, and relative levels of each phosphorylated ERBB family member are shown in the accompanying graph. (D) DSRCT-10Cpdx tumor volume is shown, demonstrating efficacy of combination therapy with afatinib (25 mg/kg, QD, 5 days/week) and cetuximab (1 mg, BIW) with animal weight shown in the inset. No treatment caused any significant change in animal weight. Treatment was initiated 20 days after implantation. AUC analysis is shown on the right. Groups were compared by two-way ANOVA with Tukey's multiple comparisons test. For the DSRCT-10Cpdx studies, there were four animals per group; for the SK-DSRCT2 xenograft studies, there were five animals per group. All measurements are mean±s.e.m.

References

    1. Casanova, M., Basso, E., Magni, C., Bergamaschi, L., Chiaravalli, S., Carta, R., Tirtei, E., Massimino, M., Fagioli, F. and Ferrari, A. (2017). Response to pazopanib in two pediatric patients with pretreated relapsing synovial sarcoma. Tumori 103, e1-e3. 10.5301/tj.5000548 - DOI - PubMed
    1. Cheng, D. T., Mitchell, T. N., Zehir, A., Shah, R. H., Benayed, R., Syed, A., Chandramohan, R., Liu, Z. Y., Won, H. H., Scott, S. N.et al. (2015). Memorial Sloan Kettering-integrated mutation profiling of actionable cancer targets (MSK-IMPACT): A hybridization capture-based next-generation sequencing clinical assay for solid tumor molecular oncology. J. Mol. Diagn., 17, 251-264. 10.1016/j.jmoldx.2014.12.006 - DOI - PMC - PubMed
    1. Connell, N. D. and Rheinwald, J. G. (1983). Regulation of the cytoskeleton in mesothelial cells: Reversible loss of keratin and increase in vimentin during rapid growth in culture. Cell 34, 245-253. 10.1016/0092-8674(83)90155-1 - DOI - PubMed
    1. El Beaino, M., Liu, J., Wasylishen, A. R., Pourebrahim, R., Migut, A., Bessellieu, B. J., Huang, K. and Lin, P. P. (2020). Loss of Stag2 cooperates with EWS-FLI1 to transform murine mesenchymal stem cells. BMC Cancer 20, 2-14. 10.1186/s12885-019-6465-8 - DOI - PMC - PubMed
    1. Filion, C., Motoi, T., Olshen, A. B., Lae, M., Emnett, R. J., Gutmann, D. H., Perry, A., Ladanyi, M. and Labelle, Y. (2009). The EWSR1/NR4A3 fusion protein of extraskeletal myxoid chondrosarcoma activates the PPARG nuclear receptor gene. J. Pathol., 217, 83-93. 10.1002/path.2445 - DOI - PMC - PubMed

Publication types