Signatures of selection are present in the genome of two close autochthonous cattle breeds raised in the North of Italy and mainly distinguished for their coat colours
- PMID: 34841617
- PMCID: PMC9300179
- DOI: 10.1111/jbg.12659
Signatures of selection are present in the genome of two close autochthonous cattle breeds raised in the North of Italy and mainly distinguished for their coat colours
Abstract
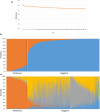
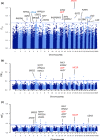
Autochthonous cattle breeds are genetic resources that, in many cases, have been fixed for inheritable exterior phenotypes useful to understand the genetic mechanisms affecting these breed-specific traits. Reggiana and Modenese are two closely related autochthonous cattle breeds mainly raised in the production area of the well-known Protected Designation of Origin Parmigiano-Reggiano cheese, in the North of Italy. These breeds can be mainly distinguished for their standard coat colour: solid red in Reggiana and solid white with pale shades of grey in Modenese. In this study we genotyped with the GeneSeek GGP Bovine 150k single nucleotide polymorphism (SNP) chip almost half of the extant cattle populations of Reggiana (n = 1109 and Modenese (n = 326) and used genome-wide information in comparative FST analyses to detect signatures of selection that diverge between these two autochthonous breeds. The two breeds could be clearly distinguished using multidimensional scaling plots and admixture analysis. Considering the top 0.0005% FST values, a total of 64 markers were detected in the single-marker analysis. The top FST value was detected for the melanocortin 1 receptor (MC1R) gene mutation, which determines the red coat colour of the Reggiana breed. Another coat colour gene, agouti signalling protein (ASIP), emerged amongst this list of top SNPs. These results were also confirmed with the window-based analyses, which included 0.5-Mb or 1-Mb genome regions. As variability affecting ASIP has been associated with white coat colour in sheep and goats, these results highlighted this gene as a strong candidate affecting coat colour in Modenese breed. This study demonstrates how population genomic approaches designed to take advantage from the diversity between local genetic resources could provide interesting hints to explain exterior traits not yet completely investigated in cattle.
Keywords: Bos taurus; coat colour; genetic resource; genome; population genomics.
© 2021 The Authors. Journal of Animal Breeding and Genetics published by John Wiley & Sons Ltd.
Conflict of interest statement
The authors declare they do not have any competing interests. Data reported in this work can be shared after signature of an agreement on their use with University of Bologna.
Figures


References
-
- ANABORARE . (2009). Retieved from https://www.razzareggiana.it/
-
- Bertolini, F. , Galimberti, G. , Calò, D. G. , Schiavo, G. , Matassino, D. , & Fontanesi, L. (2015). Combined use of principal component analysis and random forests identify population‐informative single nucleotide polymorphisms: Application in cattle breeds. Journal of Animal Breeding and Genetics, 132, 346–356. 10.1111/jbg.12155 - DOI - PubMed
MeSH terms
Grants and funding
LinkOut - more resources
Full Text Sources
Research Materials
Miscellaneous

