

Non-coding RNAs and related molecules associated with form-deprivation myopia in mice
- PMID: 34841657
- PMCID: PMC8742199
- DOI: 10.1111/jcmm.17071
Non-coding RNAs and related molecules associated with form-deprivation myopia in mice
Abstract
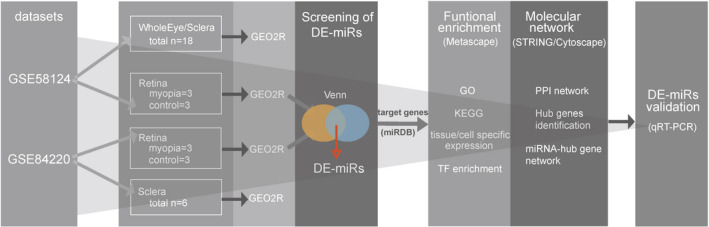
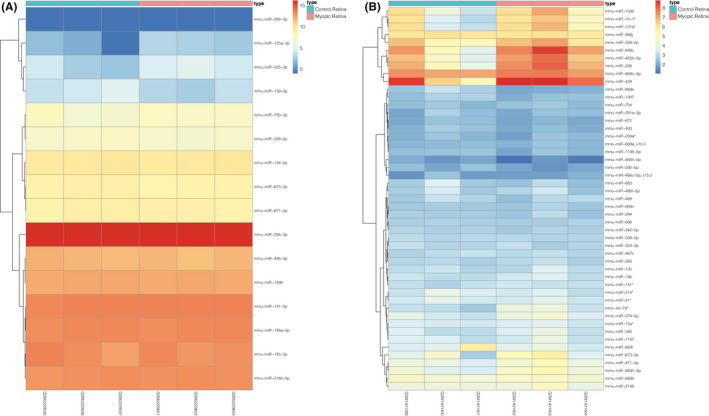
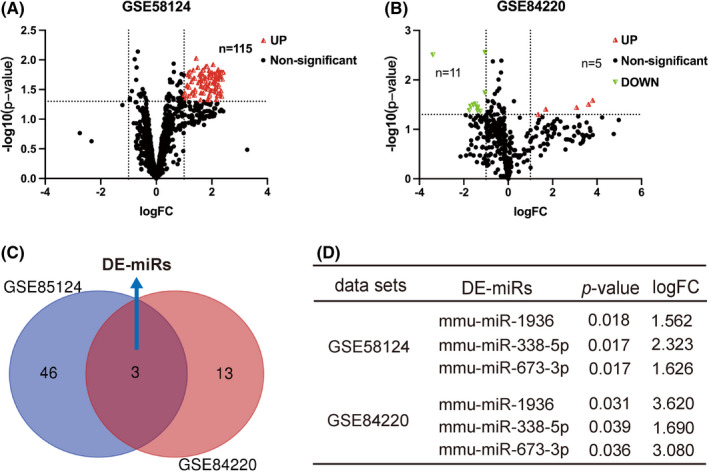
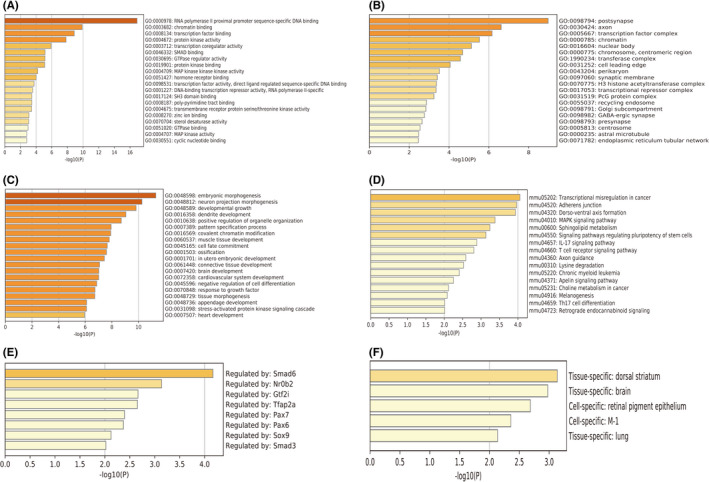
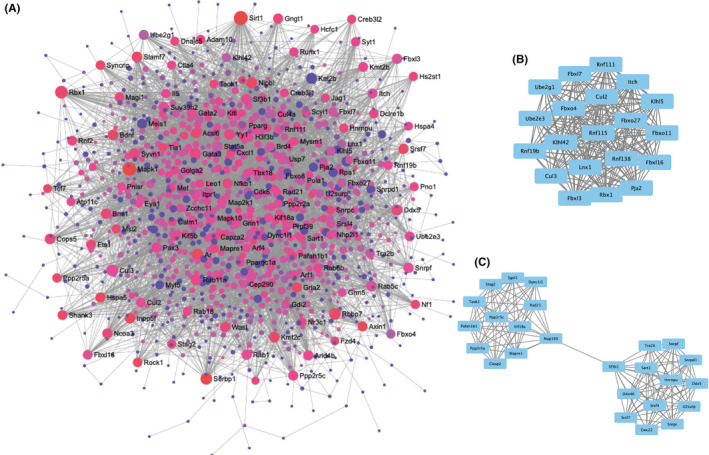
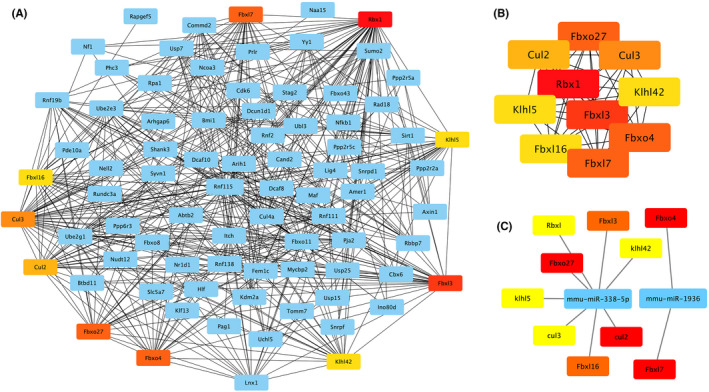
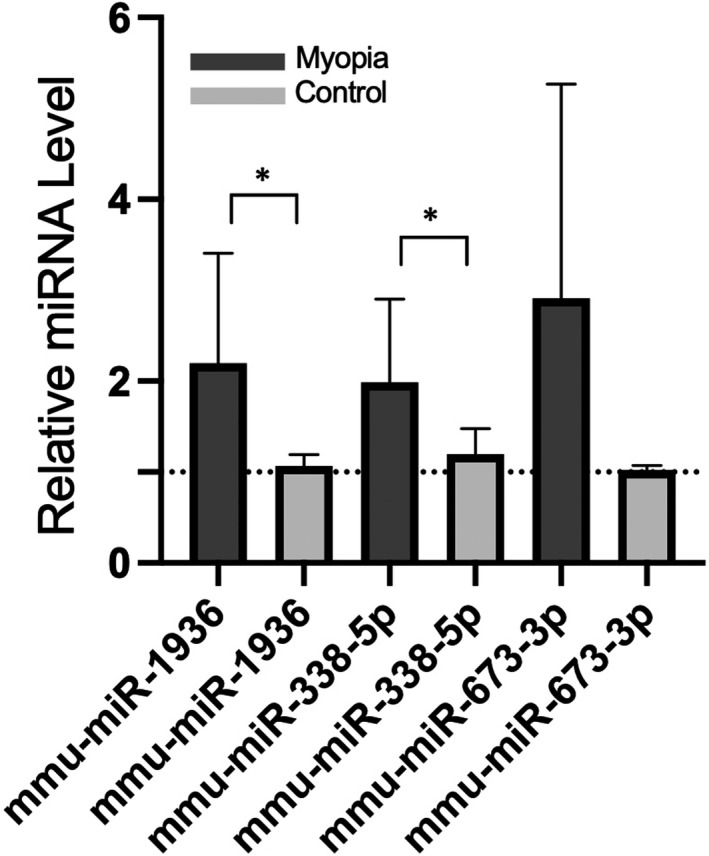
The role of miRNAs and its regulatory mechanism in myopia are indeterminate. Our study aimed to investigate potential myopia-associated non-coding RNAs and related molecules by performing a comprehensive bioinformatic analysis of miRNA expression profile of mice with form-deprivation myopia (FDM). Differentially expressed miRNAs in two raw microarray data sets (GSE58124 and GSE84220) from Gene Expression Omnibus (GEO) database were comprehensively analysed using GEO2R. Target genes were predicted using miRDB and enriched with Metascape online tool. Protein-protein interaction (PPI) networks were constructed utilizing STRING and Cytoscape. Significant differentially expressed miRNAs were validated by real-time polymerase chain reaction (qRT-PCR) using RNA extracted from monocular FDM ocular tissues. As result, we identified three upregulated miRNAs (mmu-miR-1936, mmu-miR-338-5p, and mmu-miR-673-3p) significantly associated with myopia in the two microarray data sets (p < 0.05 and |Log (Fold Change) |>1). GO functional analysis suggested these three miRNAs were targeted in genes mostly enriched in morphogenesis and developmental growth of retinal tissues. Enrichment analysis revealed top eight transcription factors, including PAX6 and Smad3, related to myopia. Ten hub genes, including Rbx1, Fbxl3, Fbxo27, Fbxl7, Fbxo4, Cul3, Cul2, Klhl5, Fbxl16 and Klhl42, associated with ubiquitin conjugation were identified. qRT-PCR confirmed the increased expression of mmu-miR-1936 and mmu-miR-338-5p (p < 0.05), but no statistical difference was observed in mmu-miR-673-3p expression in myopic retinas. Our findings indicated mmu-miR-1936, mmu-miR-338-5p and mmu-miR-673-3p upregulation may be associated with myopia development via post-transcriptional gene regulation, and identified potential molecules that could be further explored in future studies of the mechanism in myopia.
Keywords: bioinformatics analysis; myopia; non-coding RNAs.
© 2021 The Authors. Journal of Cellular and Molecular Medicine published by Foundation for Cellular and Molecular Medicine and John Wiley & Sons Ltd.
Conflict of interest statement
The authors declare no competing financial interests.
Figures
Similar articles
-
Microrna Expression Profiling of Macrophage Line Raw264.7 Infected by Candida Albicans.Shock. 2017 Apr;47(4):520-530. doi: 10.1097/SHK.0000000000000766. Shock. 2017. PMID: 27749761
-
Potentially Important MicroRNAs in Form-Deprivation Myopia Revealed by Bioinformatics Analysis of MicroRNA Profiling.Ophthalmic Res. 2017;57(3):186-193. doi: 10.1159/000452421. Epub 2017 Feb 11. Ophthalmic Res. 2017. PMID: 28190007
-
Alterations of microRNAs and their predicted targeting mRNAs expression in RAW264.7 macrophages infected with Omp25 mutant Brucella melitensis.Innate Immun. 2018 Aug;24(6):382-389. doi: 10.1177/1753425918792298. Epub 2018 Aug 9. Innate Immun. 2018. PMID: 30092685 Free PMC article.
-
MicroRNA-Expression Profiling in Myopia: A Meta-Analysis and Systematic Review.Ophthalmic Res. 2022;65(3):254-263. doi: 10.1159/000521300. Epub 2021 Dec 27. Ophthalmic Res. 2022. PMID: 34959240
-
Targeting MicroRNA in myopia: Current insights.Exp Eye Res. 2024 Jun;243:109905. doi: 10.1016/j.exer.2024.109905. Epub 2024 Apr 18. Exp Eye Res. 2024. PMID: 38642599 Review.
Cited by
-
Analyzing bacterial networks and interactions in skin and gills of Sparus aurata with microalgae-based additive feeding.Sci Rep. 2024 Dec 30;14(1):31696. doi: 10.1038/s41598-024-81822-z. Sci Rep. 2024. PMID: 39738183 Free PMC article.
-
Applications of Genomics and Transcriptomics in Precision Medicine for Myopia Control or Prevention.Biomolecules. 2023 Mar 7;13(3):494. doi: 10.3390/biom13030494. Biomolecules. 2023. PMID: 36979429 Free PMC article. Review.
-
Crosstalk between heredity and environment in myopia: An overview.Heliyon. 2024 Apr 16;10(8):e29715. doi: 10.1016/j.heliyon.2024.e29715. eCollection 2024 Apr 30. Heliyon. 2024. PMID: 38660258 Free PMC article. Review.
-
Functional characterization of FBXL7 as a novel player in human cancers.Cell Death Discov. 2022 Jul 29;8(1):342. doi: 10.1038/s41420-022-01143-w. Cell Death Discov. 2022. PMID: 35906197 Free PMC article. Review.
-
Widespread Involvement of Acetylation in the Retinal Metabolism of Form-Deprivation Myopia in Guinea Pigs.ACS Omega. 2023 Jun 26;8(26):23825-23839. doi: 10.1021/acsomega.3c02219. eCollection 2023 Jul 4. ACS Omega. 2023. PMID: 37426266 Free PMC article.
References
-
- Dolgin E. The myopia boom. Nature. 2015;519:276‐278. - PubMed
-
- Holden BA, Fricke TR, Wilson DA, et al. Global prevalence of myopia and high myopia and temporal trends from 2000 through 2050. Ophthalmology. 2016;123:1036‐1042. - PubMed
-
- Verhoeven VJM, Wong KT, Buitendijk GHS, et al. Visual consequences of refractive errors in the general population. Ophthalmology. 2015;122:101‐109. - PubMed
-
- Flaxman SR, Bourne RRA, Resnikoff S. Global causes of blindness and distance vision impairment 1990–2020: a systematic review and meta‐analysis. Lancet Glob Health. 2017;5:e1221‐e1234. - PubMed
-
- Pizzarello L, Abiose A, Ffytche F, Ffytche T, Fau‐Duerksen R; Vision . The Right to Sight: a global initiative to eliminate avoidable blindness. Arch Ophthalmol. 2020;2004(122):615‐620. - PubMed
Publication types
MeSH terms
Substances
LinkOut - more resources
Full Text Sources
Research Materials
