. 2021 Nov;11(11):e558.
doi: 10.1002/ctm2.558.

Epicardial and endothelial cell activation concurs with extracellular matrix remodeling in atrial fibrillation

Affiliations

Epicardial and endothelial cell activation concurs with extracellular matrix remodeling in atrial fibrillation

Nicoline W E van den Berg et al. Clin Transl Med. 2021 Nov.

Abstract

Background: Improved understanding of the interconnectedness of structural remodeling processes in atrial fibrillation (AF) in patients could identify targets for future therapies.

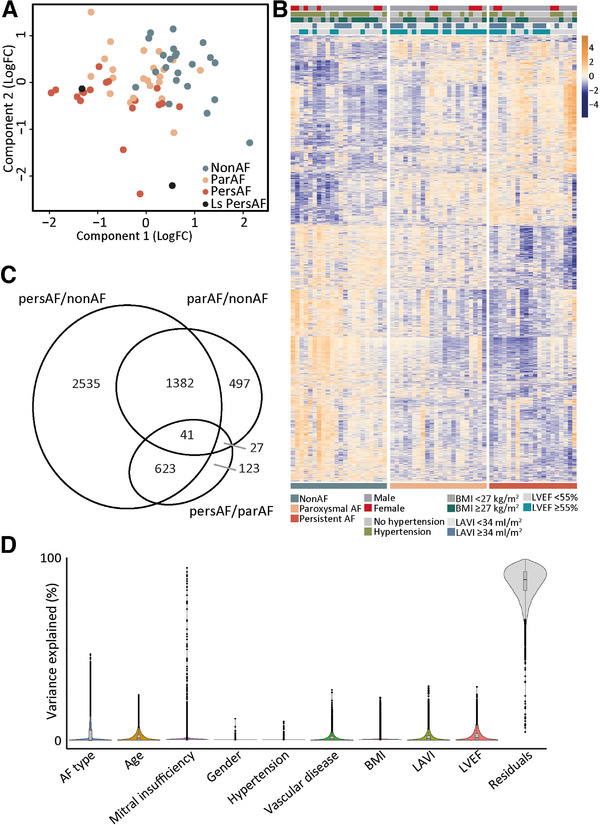
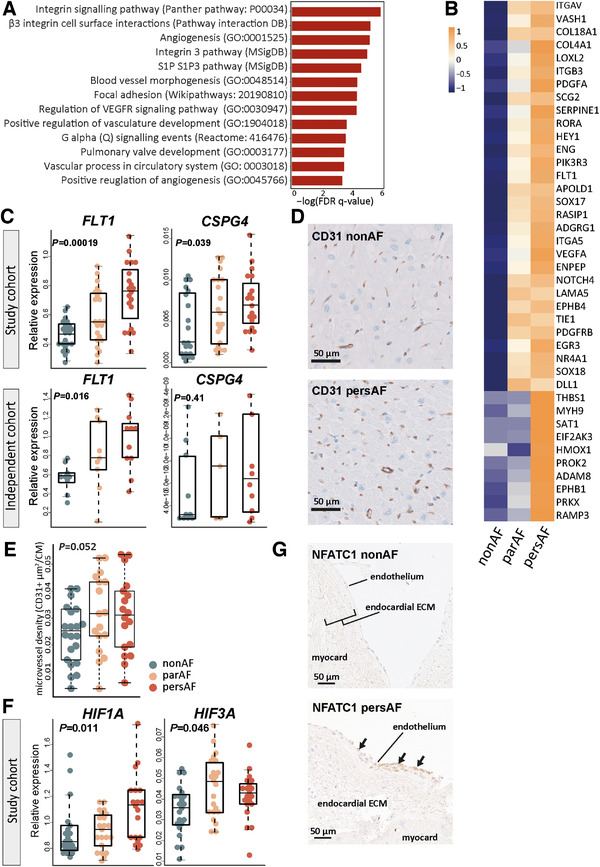
Methods: We present transcriptome sequencing of atrial tissues of patients without AF, with paroxysmal AF, and persistent AF (total n = 64). RNA expression levels were validated in the same and an independent cohort with qPCR. Biological processes were assessed with histological and immunohistochemical analyses.

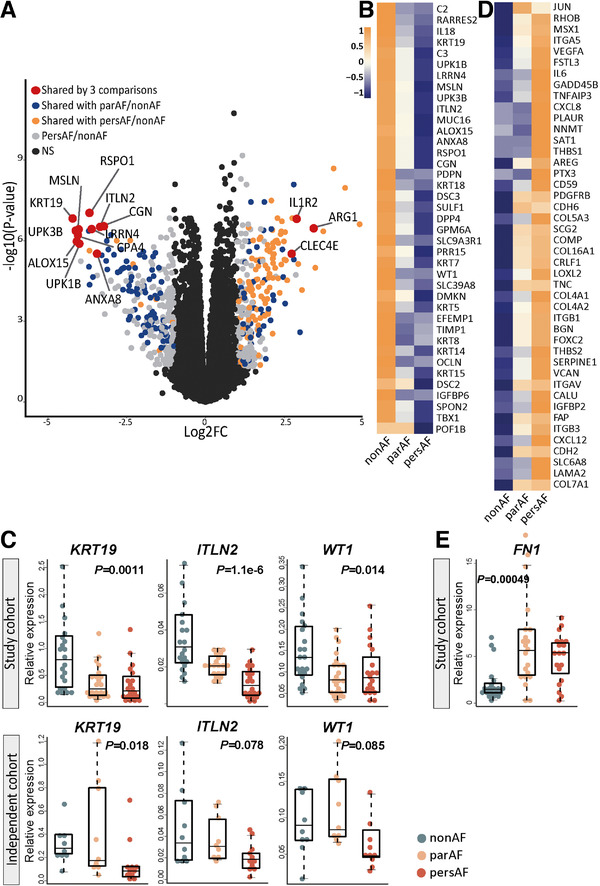
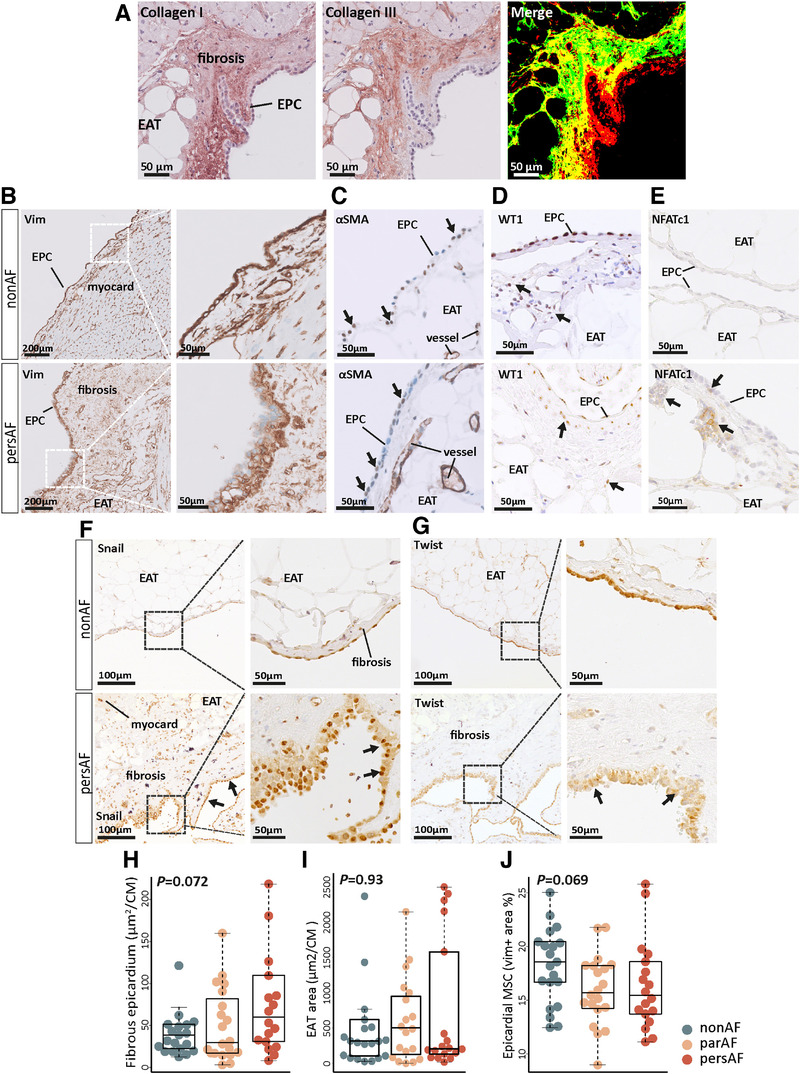
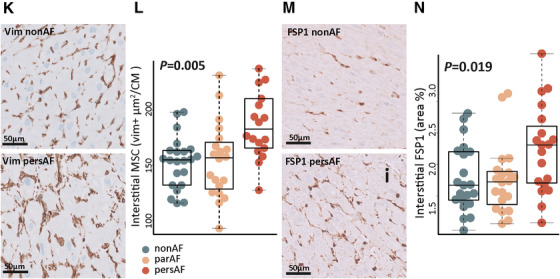
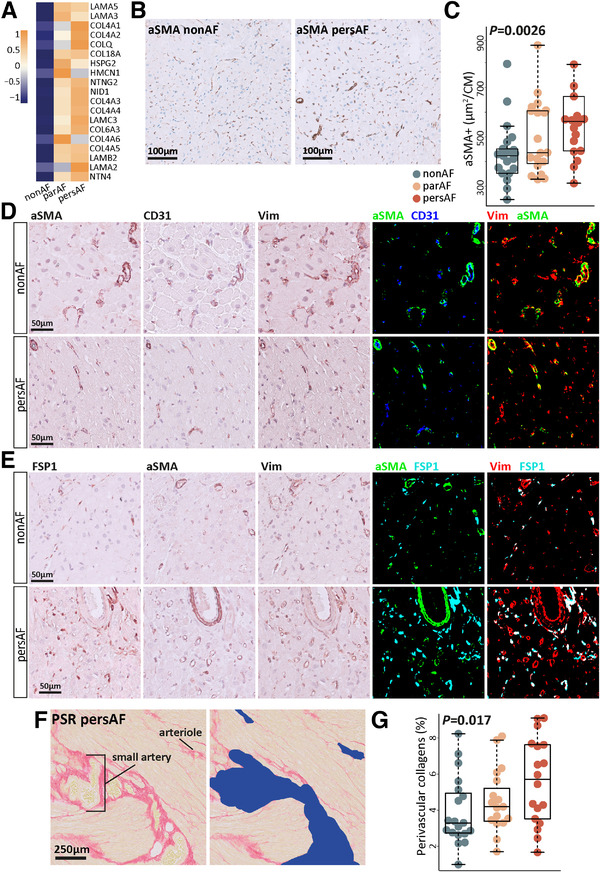
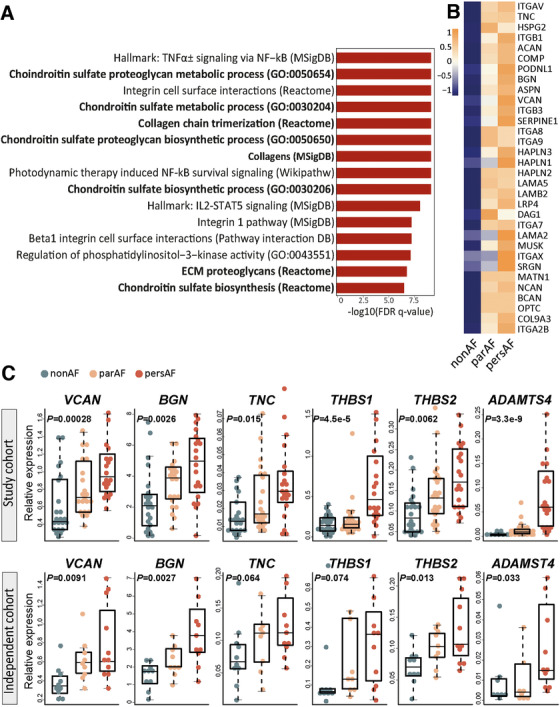
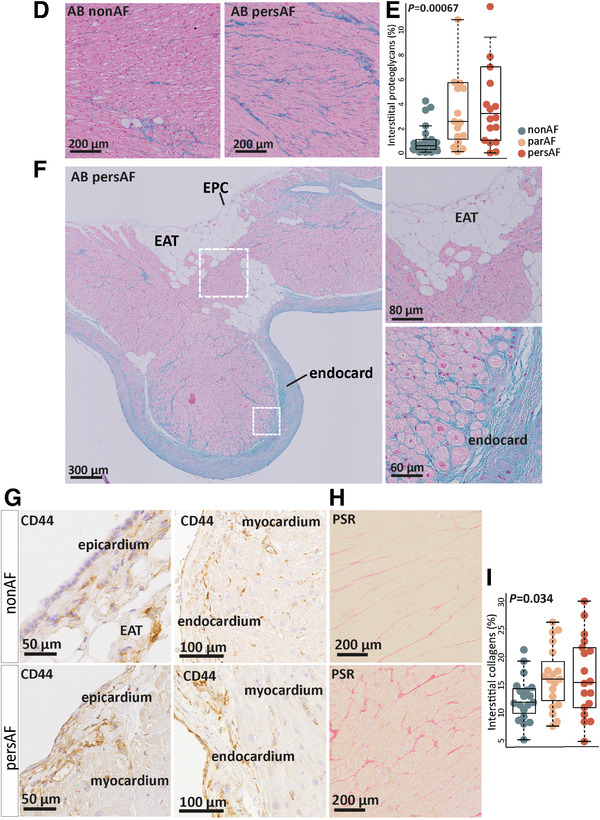
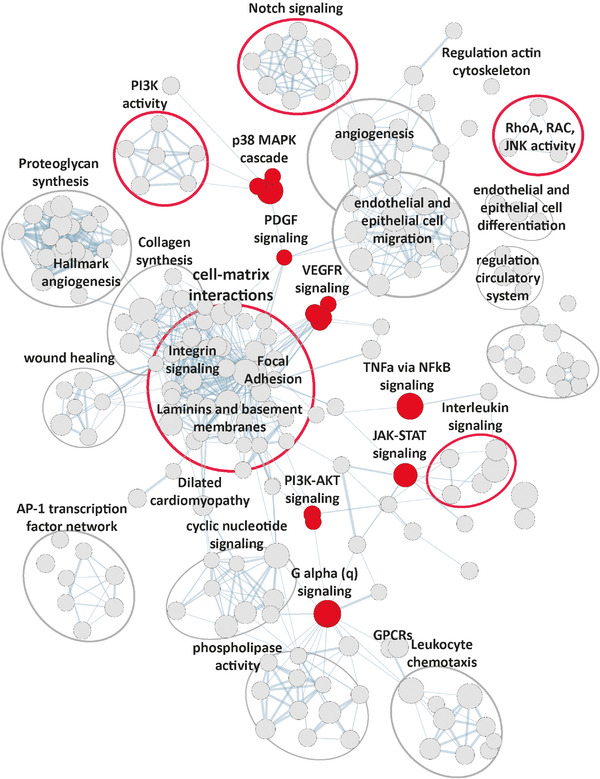
Results: In AF patients, epicardial cell gene expression decreased, contrasting with an upregulation of epithelial-to-mesenchymal transition (EMT) and mesenchymal cell gene expression. Immunohistochemistry demonstrated thickening of the epicardium and an increased proportion of (myo)fibroblast-like cells in the myocardium, supporting enhanced EMT in AF. We furthermore report an upregulation of endothelial cell proliferation, angiogenesis, and endothelial signaling. EMT and endothelial cell proliferation concurred with increased interstitial (myo)fibroblast-like cells and extracellular matrix gene expression including enhanced tenascin-C, thrombospondins, biglycan, and versican. Morphological analyses discovered increased and redistributed glycosaminoglycans and collagens in the atria of AF patients. Signaling pathways, including cell-matrix interactions, PI3K-AKT, and Notch signaling that could regulate mesenchymal cell activation, were upregulated.

Conclusion: Our results suggest that EMT and endothelial cell proliferation work in concert and characterize the (myo)fibroblast recruitment and ECM remodeling of AF. These processes could guide future research toward the discovery of targets for AF therapy.

Keywords: angiogenesis; arrhythmias; atrial fibrillation; atrial remodeling; epithelial-to-mesenchymal transition; extracellular matrix; transcriptome.


Figures

FIGURE 1
FIGURE 1
Human atrial gene signature identifies common and disease stage‐specific expression. (A) Dimensionality reduction showed a separation of non‐AF, par‐AF, and pers‐AF atrial samples. (B) Semi‐supervised heatmap of all DEG showing an ordinal increase in gene expression levels and lack of clustering by clinical characteristics. (C) Number and overlap of DEG found for each comparison. (D) Variation partitioning demonstrating that there is not a single clinical characteristic that has a major impact on gene expression. BMI, body mass index; LAVI, left atrial volume index; LVEF, left ventricular ejection fraction; sign, significant
FIGURE 2
FIGURE 2
Decreased epicardial gene expression reveals epithelial‐to‐mesenchymal transition. (A) Volcano plot of the comparison pers‐AF versus non‐AF identified genes shared by all three comparisons (i.e., par‐AF vs. non‐AF, pers‐AF vs. par‐AF, and pers‐AF vs. non‐AF) that were mostly downregulated epicardial enriched genes. (B) Broad downregulation of epicardial marker genes was found (FDR <0.05). (C) qPCR‐validated epicardial cell gene downregulation in the study cohort and an independent cohort. (D) DEG of the upregulated biological process “Hallmark epithelial‐to‐mesenchymal transition” (MSigDB). (E) Mesenchymal marker fibronectin was highly upregulated. Boxplots depict range and interquartile range
FIGURE 3
FIGURE 3
Morphological changes of the epicardium support epithelial‐to‐mesenchymal transition. (A) Immunohistochemistry of type I and type III collagen and the merged image of the two stainings illustrate the relation between the epicardial cells, the fibrous subepicardium, and epicardial adipose tissue. The subepicardium is highly enriched with collagen 1 and collagen III fibers. Type I collagen is found directly lining the epicardial monolayer. (B) Vimentin‐stained sections identify the epicardial monolayer and (interstitial) myocardial vimentin+ cells. In AF, there is thickening of the epicardium and a loss of epicardial cell organization. (C) αSMA+ cells (arrows) were found in the epicardium of non‐AF and AF patients. (D) WT1+ cells were found in the epicardial monolayer and subepicardial fibrotic layer in both non‐AF and pers‐AF patients. Absolute number of WT+ appeared decreased in pers‐AF (compare a decrease in Vim+ cells in J). Ratio of cells residing in the subepicardium (arrows) compared to the epicardial monolayer increased in pers‐AF. (E) NFATC1 was found in the epicardium and subepicardium of AF patients. Note the clusters of subepicardial NFATC1+ cells in pers‐AF (arrow). Almost no signals were observed in non‐AF. (F) Number of SNAIL+ cells increased in AF patients along with thickening of the epicardial monolayer. Arrows indicate SNAIL+ nuclei localized to the apical layer, suggesting a loss of polarization. (G) TWIST was lower expressed and cytoplasmic (arrows) in AF patients. (H) Quantification of the area of the fibrous subepicardium identified a tended increase in pers‐AF. (I) EAT area did not differ between the study groups, although the spread in pers‐AF patients was remarkable. (J) A tended decrease in subepicardial vimentin+ area fraction was found in par‐AF and pers‐AF. (K and L) Interstitial myocardial vimentin+ area fraction increased in pers‐AF. (M and N) Sections stained with the fibroblast‐specific protein (FSP1) demonstrated an increased FSP1+ area fraction in AF. CM, cardiomyocyte; EAT, epicardial adipose tissue; EPC, epicardial cell genes; MSC, mesenchymal cells; Vim, vimentin. Boxplots depict range and interquartile range
FIGURE 3
FIGURE 3
Morphological changes of the epicardium support epithelial‐to‐mesenchymal transition. (A) Immunohistochemistry of type I and type III collagen and the merged image of the two stainings illustrate the relation between the epicardial cells, the fibrous subepicardium, and epicardial adipose tissue. The subepicardium is highly enriched with collagen 1 and collagen III fibers. Type I collagen is found directly lining the epicardial monolayer. (B) Vimentin‐stained sections identify the epicardial monolayer and (interstitial) myocardial vimentin+ cells. In AF, there is thickening of the epicardium and a loss of epicardial cell organization. (C) αSMA+ cells (arrows) were found in the epicardium of non‐AF and AF patients. (D) WT1+ cells were found in the epicardial monolayer and subepicardial fibrotic layer in both non‐AF and pers‐AF patients. Absolute number of WT+ appeared decreased in pers‐AF (compare a decrease in Vim+ cells in J). Ratio of cells residing in the subepicardium (arrows) compared to the epicardial monolayer increased in pers‐AF. (E) NFATC1 was found in the epicardium and subepicardium of AF patients. Note the clusters of subepicardial NFATC1+ cells in pers‐AF (arrow). Almost no signals were observed in non‐AF. (F) Number of SNAIL+ cells increased in AF patients along with thickening of the epicardial monolayer. Arrows indicate SNAIL+ nuclei localized to the apical layer, suggesting a loss of polarization. (G) TWIST was lower expressed and cytoplasmic (arrows) in AF patients. (H) Quantification of the area of the fibrous subepicardium identified a tended increase in pers‐AF. (I) EAT area did not differ between the study groups, although the spread in pers‐AF patients was remarkable. (J) A tended decrease in subepicardial vimentin+ area fraction was found in par‐AF and pers‐AF. (K and L) Interstitial myocardial vimentin+ area fraction increased in pers‐AF. (M and N) Sections stained with the fibroblast‐specific protein (FSP1) demonstrated an increased FSP1+ area fraction in AF. CM, cardiomyocyte; EAT, epicardial adipose tissue; EPC, epicardial cell genes; MSC, mesenchymal cells; Vim, vimentin. Boxplots depict range and interquartile range
FIGURE 4
FIGURE 4
Angiogenesis is increased throughout the course of atrial fibrillation. (A) The upregulated biological processes shared by all three comparisons related to endothelial cell proliferation, endothelial signaling, and angiogenesis. Presented enrichment scores and FDR q‐values result from the comparison pers‐AF versus non‐AF. (B) Heatmap showing the leading edge genes of angiogenesis (GO:0001525). (C) qPCR validated the upregulation of FLT1 and CSPG4. (D) Typical examples of CD31‐stained transversal sections. (E) Microvessel density (CD31+ area) tended increased in par‐AF and pers‐AF. (F) qPCR validated the upregulation of hypoxia‐induced transcription factors. (G) NFATC1 was found in the endocardium of pers‐AF patients. There were almost no signals found in non‐AF patients. ECM, extracellular matrix. Boxplots depict range and interquartile range
FIGURE 5
FIGURE 5
Perivascular structures increase in atrial fibrillation. (A) Heatmap showing the leading edge genes of the upregulated biological process Naba basement membranes (MSigDB). (B) Typical examples of αSMA‐stained transversal sections. (C) αSMA+ area fraction was increased in par‐AF and pers‐AF patients. (D) αSMA+ cells were mostly found surrounding small arterioles. Few lone αSMA+ myofibroblasts were identified. αSMA+ cells make up a proportion of vimentin+ cells. (E) αSMA+ cells and FSP1+ cells identified distinct cell types. FSP1+ cells make up a proportion of vimentin+ cells. (F) Perivascular collagen fraction was quantified using picrosirius red staining (yellow myocardium; red collagens). Vessels identified by their morphology were manually removed including perivascular collagens (blue right image). Perivascular fibrosis was defined as the difference in collagen (red) fraction between the left and right images. The myocardial area used for normalization was determined after large vessel removal (right image). (G) Perivascular fibrosis was increased in par‐AF and pers‐AF. Boxplots depict range and interquartile range
FIGURE 6
FIGURE 6
Proteoglycan and glycoprotein expression is increased in atrial fibrillation. (A) The top 15 upregulated biological processes in the comparison pers‐AF versus non‐AF. Bold, processes are directly related to ECM production. (B) DEG included in the upregulated biological processes ECM proteoglycans (Reactome) and Naba proteoglycans (MSigDB). The largest fold changes can be found between par‐AF versus non‐AF. (C) qPCR validated increased expression of glycoproteins and proteoglycans in par‐AF and pers‐AF in the study cohort and an independent cohort. (D) Typical examples of interstitial glycosaminoglycans (GAGs) visualized with alcian blue. Contrasts were enhanced for visualization only. (E) GAGs showed an increase in par‐AF and pers‐AF. (F) Typical examples of alcian blue stainings showing that GAGs were most abundant in the endocardium and myocardium adjacent to the endocardium, and fewer proteoglycans were observed in or toward the epicardium. Contrasts were enhanced for visualization only. (G) The hyaluronic acid receptor CD44 could be seen in the epicardial basal layer, the fibrotic subepicardial layer, the endocardium, and surrounding small arterioles. There was no clear difference in CD44 between non‐AF and AF patients. (H and I) Quantification of interstitial collagens on picrosirius red stainings found increased interstitial collagen fractions in par‐AF and pers‐AF patients. AB, alcian blue; EAT, epicardial adipose tissue; PSR, picrosirius red. Boxplots depict range and interquartile range
FIGURE 6
FIGURE 6
Proteoglycan and glycoprotein expression is increased in atrial fibrillation. (A) The top 15 upregulated biological processes in the comparison pers‐AF versus non‐AF. Bold, processes are directly related to ECM production. (B) DEG included in the upregulated biological processes ECM proteoglycans (Reactome) and Naba proteoglycans (MSigDB). The largest fold changes can be found between par‐AF versus non‐AF. (C) qPCR validated increased expression of glycoproteins and proteoglycans in par‐AF and pers‐AF in the study cohort and an independent cohort. (D) Typical examples of interstitial glycosaminoglycans (GAGs) visualized with alcian blue. Contrasts were enhanced for visualization only. (E) GAGs showed an increase in par‐AF and pers‐AF. (F) Typical examples of alcian blue stainings showing that GAGs were most abundant in the endocardium and myocardium adjacent to the endocardium, and fewer proteoglycans were observed in or toward the epicardium. Contrasts were enhanced for visualization only. (G) The hyaluronic acid receptor CD44 could be seen in the epicardial basal layer, the fibrotic subepicardial layer, the endocardium, and surrounding small arterioles. There was no clear difference in CD44 between non‐AF and AF patients. (H and I) Quantification of interstitial collagens on picrosirius red stainings found increased interstitial collagen fractions in par‐AF and pers‐AF patients. AB, alcian blue; EAT, epicardial adipose tissue; PSR, picrosirius red. Boxplots depict range and interquartile range
FIGURE 7
FIGURE 7
Interconnecting signaling. Enrichment map showing all upregulated (FDR q‐value <.05) biological processes discovered by gene set enrichment analysis (pers‐AF vs. non‐AF; Supporting Data File). Cell–matrix interactions can be found interconnecting various processes. Highlighted (red) are the signaling pathways directly related to structural remodeling processes

References

    1. Chugh SS, Havmoeller R, Narayanan K, et al. Worldwide epidemiology of atrial fibrillation: a global burden of disease 2010 study. Circulation. 2014;129(8):837‐847. - PMC - PubMed
    1. Krijthe BP, Kunst A, Benjamin EJ, et al. Projections on the number of individuals with atrial fibrillation in the European Union, from 2000 to 2060. Eur Heart J. 2013;34(35):2746‐2751. - PMC - PubMed
    1. Hindricks G, Potpara T, Dagres N, et al. 2020 ESC guidelines for the diagnosis and management of atrial fibrillation developed in collaboration with the European Association for Cardio‐Thoracic Surgery (EACTS): the Task Force for the diagnosis and management of atrial fibrillation of the European Society of Cardiology (ESC) developed with the special contribution of the European Heart Rhythm Association (EHRA) of the ESC. Eur Heart J. 2021;42(5):373‐498. - PubMed
    1. Schotten U, Neuberger H‐R, Allessie MA. The role of atrial dilatation in the domestication of atrial fibrillation. Prog Biophys Mol Biol. 2003;82(1‐3):151‐162. - PubMed
    1. Dzeshka MS, Lip GYH, Snezhitskiy V, Shantsila E. Cardiac fibrosis in patients with atrial fibrillation: mechanisms and clinical implications. J Am Coll Cardiol. 2015;66(8):943‐959. - PubMed

Publication types

Grants and funding