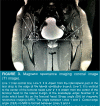
Is Stage 2 idiopathic osteonecrosis of the hip joint associated with version angles on imaging methods?
- PMID: 34842092
- PMCID: PMC8650656
- DOI: 10.52312/jdrs.2021.273
Is Stage 2 idiopathic osteonecrosis of the hip joint associated with version angles on imaging methods?
Abstract
Objectives: In this study, we aimed to investigate whether anatomical variations of acetabulum were associated to idiopathic osteonecrosis (ON) of the femoral head.
Patients and methods: Between January 2014 and March 2020, a total of 46 patients (32 males, 14 females; mean age: 43 years; range, 18 to 66 years) who were diagnosed with unilateral or bilateral ON of the hip joint and 44 healthy age- and sex-matched controls (30 males, 14 females; mean age: 46 years; range, 18 to 79 years) with no signs of ON of the hip joint were retrospectively analyzed. For both groups, measurements were taken of the anatomic parameters, including the acetabular version angle (VA), the sharp angle (SA), and the center-edge angle (CEA) on anteroposterior pelvic radiographs and magnetic resonance imaging (MRI) scans.
Results: The mean VA of both hips was found to be significantly smaller in Group 1 than in Group 2 on both MRI and X-ray (14.9±4.1 and 14.4±3.1 vs. 17.3±3.9 and 18.0±3.7, respectively; p=0.004, p<0.001). The mean SA of both hips was found to be significantly smaller in Group 1 than in Group 2 on both MRI and X-ray (39.0±2.9 and 38.9±2.8 vs. 41.6±3.9 and 40.8±4.9, respectively; p=0.001, p=0.036). The mean CEA of both hips was found to be significantly larger in ON group than in control group on both MRI and X-ray (36.7±6.1 and 36.9±7.0 vs. 32.0±6.0 and 31.5±7.5, respectively; p<0.001, p=0.001).
Conclusion: Version angles were found to be smaller in patients with ON and more acetabular coverage was observed. Greater coverage of the acetabulum may indicate early collapses of the femoral head even in Stage 2 ON patients. The smaller version angles may be associated with ON.
Conflict of interest statement
Figures


Similar articles
-
Acetabular Global Insufficiency in Patients with Down Syndrome and Hip-Related Symptoms: A Matched-Cohort Study.J Bone Joint Surg Am. 2017 Oct 18;99(20):1760-1768. doi: 10.2106/JBJS.17.00341. J Bone Joint Surg Am. 2017. PMID: 29040131
-
Acetabular Retroversion and Decreased Posterior Coverage Are Associated With Sports-related Posterior Hip Dislocation in Adolescents.Clin Orthop Relat Res. 2019 May;477(5):1101-1108. doi: 10.1097/CORR.0000000000000514. Clin Orthop Relat Res. 2019. PMID: 30272610 Free PMC article.
-
A Possible New Radiographic Predictor of Progression of Osteoarthritis in Developmental Dysplasia of the Hip: The Center Gap.Clin Orthop Relat Res. 2018 Nov;476(11):2157-2166. doi: 10.1097/CORR.0000000000000458. Clin Orthop Relat Res. 2018. PMID: 30179949 Free PMC article.
-
Not All Hip Dysplasias are the Same: Preoperative CT Version Study and the Need for Reverse Bernese Periacetabular Osteotomy.J Pediatr Orthop. 2017 Jan;37(1):47-52. doi: 10.1097/BPO.0000000000000583. J Pediatr Orthop. 2017. PMID: 26196495
-
Acetabular Anatomical Parameters in Patients With Idiopathic Osteonecrosis of the Femoral Head.J Arthroplasty. 2020 Feb;35(2):331-334. doi: 10.1016/j.arth.2019.08.065. Epub 2019 Sep 8. J Arthroplasty. 2020. PMID: 31706646
Cited by
-
Comparison of the prophylactic use of ibandronate and its use in early-stage osteonecrosis in rats with steroid-induced osteonecrosis of the femoral head.Jt Dis Relat Surg. 2023 Aug 21;34(3):640-650. doi: 10.52312/jdrs.2023.1096. Jt Dis Relat Surg. 2023. PMID: 37750269 Free PMC article.
-
A radiographic study of dorsovolar wrist axes and a database of angular measurements on axial computed tomography images.Jt Dis Relat Surg. 2023;34(1):176-182. doi: 10.52312/jdrs.2023.872. Epub 2022 Dec 27. Jt Dis Relat Surg. 2023. PMID: 36700280 Free PMC article.
References
-
- Aldridge JM 3rd, Urbaniak JR. Avascular necrosis of the femoral head: Etiology, pathophysiology, classification, and current treatment guidelines. Am J Orthop (Belle Mead NJ) 2004;33:327–332. - PubMed
-
- Carli A, Albers A, Séguin C, Harvey EJ. The medical and surgical treatment of ARCO stage-I and II osteonecrosis of the femoral head: A critical analysis review. e2JBJS Rev. 2014;2 - PubMed
MeSH terms
LinkOut - more resources
Full Text Sources
Medical
Miscellaneous

