CRYPTOCHROMES promote daily protein homeostasis
- PMID: 34842284
- PMCID: PMC8724739
- DOI: 10.15252/embj.2021108883
CRYPTOCHROMES promote daily protein homeostasis
Abstract
The daily organisation of most mammalian cellular functions is attributed to circadian regulation of clock-controlled protein expression, driven by daily cycles of CRYPTOCHROME-dependent transcriptional feedback repression. To test this, we used quantitative mass spectrometry to compare wild-type and CRY-deficient fibroblasts under constant conditions. In CRY-deficient cells, we found that temporal variation in protein, phosphopeptide, and K+ abundance was at least as great as wild-type controls. Most strikingly, the extent of temporal variation within either genotype was much smaller than overall differences in proteome composition between WT and CRY-deficient cells. This proteome imbalance in CRY-deficient cells and tissues was associated with increased susceptibility to proteotoxic stress, which impairs circadian robustness, and may contribute to the wide-ranging phenotypes of CRY-deficient mice. Rather than generating large-scale daily variation in proteome composition, we suggest it is plausible that the various transcriptional and post-translational functions of CRY proteins ultimately act to maintain protein and osmotic homeostasis against daily perturbation.
Keywords: CRYPTOCHROME; circadian rhythm; clock mutant; protein homeostasis; proteotoxic stress.
© 2021 MRC Laboratory of Molecular Biology. Published under the terms of the CC BY 4.0 license.
Conflict of interest statement
The authors declare that they have no conflict of interest.
Figures

- A
An overview of the proteomics experimental workflow. Samples were taken every 3 h for 3 days in constant conditions, starting 24 h after medium change (“Experimental time 0 h”).
- B, C
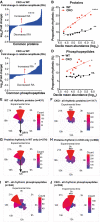
Volcano plots showing the fold change in average expression of all proteins and phosphopeptides, respectively, in CKO cells compared with WT (q = Benjamini–Hochberg‐corrected P‐value, n = 24 time points over 3 days). Statistically significant changes (q ≤ 0.05) are shown in red. Some proteins are labelled as space allows.
- D, E
Venn diagrams showing the numbers of rhythmic proteins and phosphopeptides, respectively, in WT cells and CKO cells, with the overlaps annotated. Mean relative amplitude of rhythmic (phospho)peptides is also provided.

- A
Fold change in relative amplitude (RA) was calculated for each of the proteins found to be rhythmic in both genotypes by RAIN analysis (i.e. no RA cut‐off). The mean fold change (log) in RA was an increase of 14% in CKO cells compared with WT cells (One sample t‐test, ****P < 0.0001).
- B
For each genotype, all proteins were divided into 10 deciles of equal number, ranked by abundance. The mean abundance of each decile was plotted against the proportion of the decile that was rhythmic. Linear regression lines are shown for each genotype, and the slopes were significantly non‐zero (F‐test, WT **P = 0.0016, CKO ****P < 0.0001). The slopes were also significantly different to each other (F‐test, P = 0.0001).
- C
Fold change in relative amplitude (RA) was calculated for each of the phosphopeptides found to be rhythmic in both genotypes by RAIN. On average, the RA was increased in CKO cells compared with WT cells by 6% (one‐sample t‐test, *P < 0.05).
- D
The same analysis in B) was carried out for phosphopeptides. The slopes were significantly non‐zero in CKO but not WT (F‐test, WT P = 0.3 (ns.: non‐significant), CKO *P = 0.04). The slopes were also significantly different to each other (F‐test, P < 0.0001).
- E–H
Circular histograms showing the number of proteins at each rhythmic phase. Phase is defined and estimated by RAIN, as the time of the first predicted peak in a 24‐h period. Concentric circles represent the count scale, with the outermost circle marking the upper end of the counts. Black arrow indicates the phase of CRY1. (E, F) The distributions of rhythmic proteins in CKO cells were significantly different to WT cells (***P < 0.001, Watson’s two‐sample test). (G, H) This was also the case for the proteins rhythmic in only one genotype (***P < 0.001, Watson’s two‐sample test).
- I, J
Circular histograms showing the number of phosphopeptides at each rhythmic phase. The distributions of rhythmic phosphopeptides in CKO cells were significantly different to WT cells (***P < 0.001, Watson’s two‐sample test).

- A
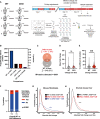
Schematic of proteomics experimental pipeline. Lung fibroblasts from 8 mice (4 WT, 4 CKO) were isolated and expanded. Samples were taken 12 h apart, starting 24 h after a medium change (“Experimental time 0 h”).
- B
Bar chart reports the number and % of detected proteins showing a significant difference in abundance for the listed comparisons by two‐way ANOVA correcting for multiple comparisons, controlling for false discovery rate by the Benjamini, Krieger and Yekutieli method (q = 0.05).
- C
Most of the proteins whose abundance changed significantly over time differed between WT and CKO cells.
- D, E
Proteins with significant abundance change over time had no significant difference in mean absolute fold change between WT and CKO cells (D, P = 0.47), but significantly greater variance in absolute fold change between independent CKO biological replicates than between their WT counterparts (E, **P = 0.0013); Kolmogorov–Smirnov test (n = 4). Continuous lines = median, dotted lines = quartiles.
- F
Proteins with significant differences in overall abundance between CKO and WT cells were more likely to show genotype‐dependent differences in temporal variation (Fisher’s exact test, P < 0.0001), number of proteins in each group reported.
- G
Absolute fold changes were calculated from maximum/minimum for all protein abundances and probability densities plotted. There were significant differences between WT vs. time fold changes and WT vs. CKO fold changes (****P < 0.0001). There was no significant difference between WT vs. time fold changes and CKO vs. time fold changes (P = 0.930), Kruskal–Wallis test with Dunnett’s multiple comparisons test, P‐values adjusted with Benjamini–Hochberg method.
- H
Data were extracted from Mauvoisin et al (2014), where the proteome was quantified in WT and CKO mouse livers extracted under diurnal conditions. Absolute fold change was calculated from maximum/minimum protein abundances. Probability density distributions for fold change are plotted. Kolmogorov–Smirnov test: ****P < 0.0001.

From the quantitative proteomics experiment, average abundance of catalytic proteasome subunits was calculated and normalised to WT means. Trypsin‐like (β2), chymotrypsin‐like (β3) and caspase‐like (β1) catalytic subunits are shown. The average was calculated from all 24 time points of the proteomics experiment. Mean ± SD, 2‐way ANOVA with Holm–Sidak’s multiple comparisons, ****P ≤ 0.0001.
Representative Western blot using an antibody that recognises all 7 α subunits of the 20S proteasome, with anti‐histone H3 as loading control.
Quantification of the blots in (B), using all replicates (n = 3), normalised to WT mean. Mean ± SD, one‐tailed Student’s t‐test with Welch correction‐prior prediction from experiment in (A) that CKO abundance would be lower, *P ≤ 0.05.
Proteasome activity measured using the ProteasomeGlo Assay (Promega), normalised to WT means. Mean ± SD, 2‐way ANOVA with Holm–Sidak’s multiple comparisons. N = 6 experiments, representative experiment shown (n = 4 technical replicates), ****P ≤ 0.0001.
Translation rate was measured using 35S‐methionine labelling and imaging with phosphor screens. The quantification values were normalised to the total protein concentration as measured using Coomassie stain and then normalised to WT mean. Mean ± SD, Student’s t‐test with Welch correction. N = 3 experiments, representative experiment shown (n = 4 technical replicates), **P ≤ 0.01.
Total protein mass per cell in confluent WT and CKO cultures. Cells were grown in two 12‐well plates; one was used for cell counting and the other was used for lysis in RIPA buffer prior to protein quantification by BCA assay. Quantification shown, normalised to WT mean. Mean ± SD, Student’s t‐test with Welch correction, n = 6 technical replicates.

- A–C
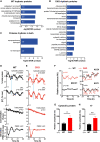
Gene ontology analysis for rhythmic proteins was carried out using Gene ontology enrichment analysis and visualisation (GOrilla) (Eden et al, 2007, 2009). Significantly rhythmic WT proteins were compared against background (all proteins identified in the experiment), and the top non‐overlapping GO Biological Process terms shown, sorted according to FDR q‐value. Fold enrichment is annotated on each bar (A). The same GO analysis was carried out comparing proteins rhythmic that were rhythmic in CKO cells (B) and for proteins that were rhythmic across both genotypes (C).
- D, E
From one time course experiment, ions, cytosolic proteins and total protein were extracted in parallel samples. The presented experiment is representative of 3 separate time course experiments that were carried out (N = 3). Representative experiment shown (n = 4 technical replicates for [K+], n = 3 technical replicates for the other traces). Blue lines highlight the antiphasic relationship between oscillations in cytosolic protein and potassium concentration. Mean ± SEM, P‐values from RAIN, red lines are fits by a damped cosine compared with a straight line (null hypothesis). Parallel PER2::LUC recordings were also performed and plotted as a phase marker.
- F
Examples of key ion transporters are shown, as detected in the proteomics experiment. P values show the results of an F‐test comparing fits of damped cosine against straight line. All proteins except WT NKCC1 had RAIN P < 0.05.
- G, H
Relative amplitudes of cytosolic protein (G) and potassium concentrations oscillations (H) in (D) and (E) were greater in CKO compared to WT (Student’s t‐test with Welch correction, mean ± SD, *P ≤ 0.05, **P ≤ 0.01).

WT and CKO cells were treated with 500 nM tunicamycin (TUN) and lysed in RIPA buffer at time points between 0 and 24 h afterwards. Western blots were carried out, probing for phosphorylated eIF2α, total eIF2α and actin. Representative blots shown, n = 4.
Quantification of all replicates represented in (A), where phosphorylated eIF2α is normalised to total eIF2α. Mean ± SD. 2‐way ANOVA (TWA) with Holm‐Sidak’s multiple comparisons.
Mice were housed in 12‐h:12‐h light–dark cycles, with unrestricted feeding. Mouse lungs were collected 7 h after transition to the light phase, 5 h after intraperitoneal injection of mice with bortezomib (BTZ, 2.5 mg/kg) or vehicle (Veh, 1% DMSO in sterile PBS). Tissues were lysed in RIPA buffer and Western blots were performed, probing for phosphorylated STAT3, total STAT3 and actin. Male (left) and female (right) replicates shown, N = 2 mice for each condition.
Quantification of the blots shown in (C), where phosphorylated STAT3 is normalised to total STAT3. Mean ± SD. Multiple t‐tests, corrected for multiple comparisons with the Holm–Sidak method, *P ≤ 0.05, ***P ≤ 0.001.

- A
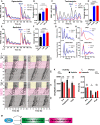
WT PER2::LUC cells were treated with epoxomicin or vehicle control. Blue arrows show the time points where drug was washed off. Mean (solid lines) ± SD (dotted lines).
- B
Quantification of damping rate of the PER2::LUC recordings shown in (A), for the duration of drug treatment. Mean ± SD. One‐way ANOVA with Holm–Sidak’s multiple comparisons, **P ≤ 0.01, ****P ≤ 0.0001.
- C
WT PER2::LUC cells were treated with tunicamycin or vehicle control. Mean (solid lines) ± SD (dotted lines).
- D
Quantification of damping rate of the PER2::LUC recordings shown in (C), for the duration of drug treatment. Mean ± SD. One‐way ANOVA with Holm–Sidak’s multiple comparisons, ****P ≤ 0.0001.
- E
WT PER2::LUC cells were treated with radicicol or vehicle control. Blue arrows show the time points where drug was washed off. Mean (solid lines) ± SD (dotted lines).
- F
Quantification of damping rate of the PER2::LUC recordings shown in (E), for the duration of drug treatment. Mean ± SD. One‐way ANOVA with Holm–Sidak’s multiple comparisons, ****P ≤ 0.0001.
- G, H
WT and CKO cells were treated with 0.3 µM cycloheximide (CHX) or DMSO vehicle control, and kept in constant conditions, n = 4, Mean ± SD. Panels above show baseline‐subtracted raw data, and panels below show data detrended with a 24‐h moving average.
- I, J
Representative double‐plotted actograms of WT mice receiving drinking water with DMSO vehicle control (N = 7 mice) or 35 µg/ml ixazomib (N = 8 mice). Two representative actograms are shown per condition. For the first 7 days, the mice were in 12:12‐h light–dark cycles (LD), and had drinking water supplemented with blackcurrant squash. Ixazomib/DMSO was added to this, and the lighting was changed to constant darkness (DD). After 7 days, the drug/vehicle was removed, and the mice remained in DD until the end of the experiment.
- K, L
Quantification of the amplitude of wheel‐running activity and period length from the experiment shown in (I), (J), including pre‐treatment, during treatment and post‐drug treatment. Mean ± SEM. 2‐way ANOVA with Holm‐Sidak’s multiple comparisons, *P ≤ 0.05, ***P ≤ 0.001, ****P ≤ 0.0001, TWAINT = two‐way ANOVA interaction.
- M
Schematic diagram: our data suggest that CRY deficiency is associated with proteome imbalance, which in turn disrupts circadian regulation of physiology.
References
-
- Agyemang AF, Harrison SR, Siegel RM, McDermott MF (2015) Protein misfolding and dysregulated protein homeostasis in autoinflammatory diseases and beyond. Semin Immunopathol 37: 335–347 - PubMed
-
- Aragón JJ, Sols A (1991) Regulation of enzyme activity in the cell: effect of enzyme concentration. FASEB J 5: 2945–2950 - PubMed
-
- Balchin D, Hayer‐Hartl M, Hartl FU (2016) In vivo aspects of protein folding and quality control. Science 353: aac4354 - PubMed
-
- Barclay JL, Shostak A, Leliavski A, Tsang AH, Johren O, Muller‐Fielitz H, Landgraf D, Naujokat N, van der Horst GTJ, Oster H (2013) High‐fat diet‐induced hyperinsulinemia and tissue‐specific insulin resistance in Cry‐deficient mice. AJP Endocrinol Metab 304: E1053–E1063 - PubMed
-
- Baumgarten CM, Feher JJ (2012) Osmosis and regulation of cell volume. In Cell physiology source book, Sperelakis N (ed), 4 th edn, Chapter 16, pp 261–302. London: Academic Press;
Publication types
MeSH terms
Substances
Grants and funding
LinkOut - more resources
Full Text Sources
Other Literature Sources

