

Atlas of the HIV-1 Reservoir in Peripheral CD4 T Cells of Individuals on Successful Antiretroviral Therapy
- PMID: 34844430
- PMCID: PMC8630536
- DOI: 10.1128/mBio.03078-21
Atlas of the HIV-1 Reservoir in Peripheral CD4 T Cells of Individuals on Successful Antiretroviral Therapy
Abstract
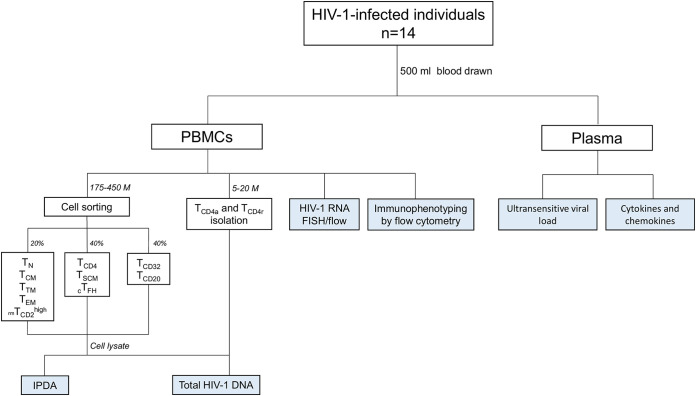
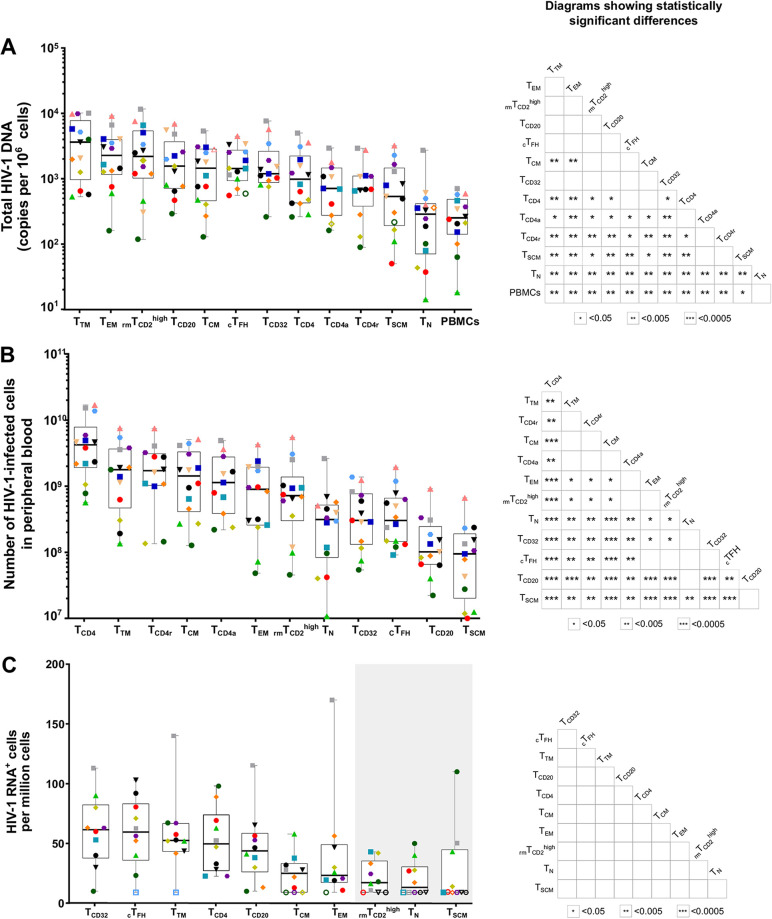
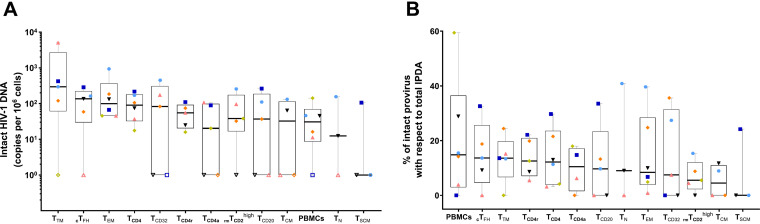
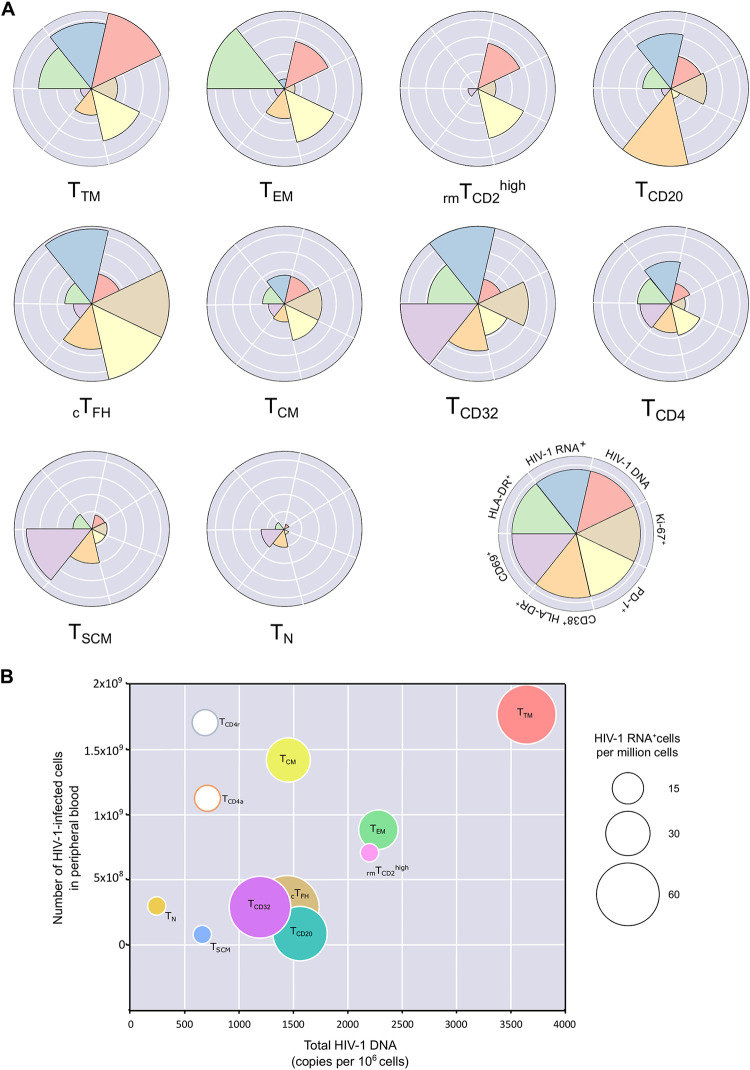
Knowing the mechanisms that govern the persistence of infected CD4+ subpopulations could help us to design new therapies to cure HIV-1 infection. We evaluated the simultaneous distribution of the HIV-1 reservoir in 13 CD4+ subpopulations from 14 HIV-1-infected individuals on antiretroviral therapy to analyze its relationship with HIV-1 transcription, immune activation, and cell proliferation. A unique large blood donation was used to isolate CD4, CD4 resting (CD4r), CD4 activated (CD4a), T naive (TN), T stem cell memory (TSCM), T central memory (TCM), T transitional memory (TTM), T effector memory (TEM), circulating T follicular helper (cTFH), TCD20, TCD32, and resting memory TCD2high (rmTCD2high) cells. HIV-1 DNA measured by droplet digital PCR ranged from 3,636 copies/106 in TTM to 244 in peripheral blood mononuclear cells (PBMCs), with no subpopulation standing out for provirus enrichment. Importantly, all the subpopulations harbored intact provirus by intact provirus DNA assay (IPDA). TCD32, cTFH, and TTM had the highest levels of HIV-1 transcription measured by fluorescent in situ hybridization with flow cytometry (FISH/flow), but without reaching statistical differences. The subpopulations more enriched in provirus had a memory phenotype, were less activated (measured by CD38+/HLA-DR+), and expressed more programmed cell death 1 (PD-1). Conversely, subpopulations transcribing more HIV-1 RNA were not necessarily enriched in provirus and were more activated (measured by CD38+/HLA-DR+) and more proliferative (measured by Ki-67). In conclusion, the HIV reservoir is composed of a mosaic of subpopulations contributing to the HIV-1 persistence through different mechanisms such as susceptibility to infection, provirus intactness, or transcriptional status. The narrow range of reservoir differences between the different blood cell subsets tested suggests limited efficacy in targeting only specific cell subpopulations during HIV-1 cure strategies. IMPORTANCE The main barrier for HIV-1 cure is the presence of latently infected CD4+ T cells. Although various cell subpopulations have been identified as major HIV-1 reservoir cells, the relative contribution of infected CD4 subpopulations in the HIV-1 reservoir remains largely unknown. Here, we evaluated the simultaneous distribution of the HIV-1 reservoir in 13 CD4+ T-cell subpopulations in peripheral blood from HIV-1-infected individuals under suppressive antiretroviral therapy. We found that the HIV-1 reservoir is composed of a mosaic of cell subpopulations, with heterogeneous proviral DNA, HIV-1 transcription, and activation status. Hence, each cell subpopulation contributes to the HIV-1 persistence through different mechanisms such as susceptibility to infection, rates of intact provirus, transcriptional status or half-life. This research provides new insights into the composition of the HIV-1 reservoir, suggesting that, to be effective, eradication strategies must simultaneously target multiple cell subpopulations.
Keywords: HIV-1; HIV-1 DNA; HIV-1 RNA; HIV-1 cure; HIV-1 reservoir; HIV-1 reservoir size.
Figures
References
-
- Finzi D, Blankson J, Siliciano JD, Margolick JB, Chadwick K, Pierson T, Smith K, Lisziewicz J, Lori F, Flexner C, Quinn TC, Chaisson RE, Rosenberg E, Walker B, Gange S, Gallant J, Siliciano RF. 1999. Latent infection of CD4+ T cells provides a mechanism for lifelong persistence of HIV-1, even in patients on effective combination therapy. Nat Med 5:512–517. doi: 10.1038/8394. - DOI - PubMed
-
- Chomont N, El-Far M, Ancuta P, Trautmann L, Procopio FA, Yassine-Diab B, Boucher G, Boulassel MR, Ghattas G, Brenchley JM, Schacker TW, Hill BJ, Douek DC, Routy JP, Haddad EK, Sékaly RP. 2009. HIV reservoir size and persistence are driven by T cell survival and homeostatic proliferation. Nat Med 15:893–900. doi: 10.1038/nm.1972. - DOI - PMC - PubMed
Publication types
MeSH terms
Substances
LinkOut - more resources
Full Text Sources
Medical
Research Materials
Miscellaneous
