. 2021 Nov 29;19(1):485.
doi: 10.1186/s12967-021-03154-0.

Analysis of changes in microbiome compositions related to the prognosis of colorectal cancer patients based on tissue-derived 16S rRNA sequences

Affiliations

Analysis of changes in microbiome compositions related to the prognosis of colorectal cancer patients based on tissue-derived 16S rRNA sequences

Sukjung Choi et al. J Transl Med. .

Abstract

Background: Comparing the microbiome compositions obtained under different physiological conditions has frequently been attempted in recent years to understand the functional influence of microbiomes in the occurrence of various human diseases.

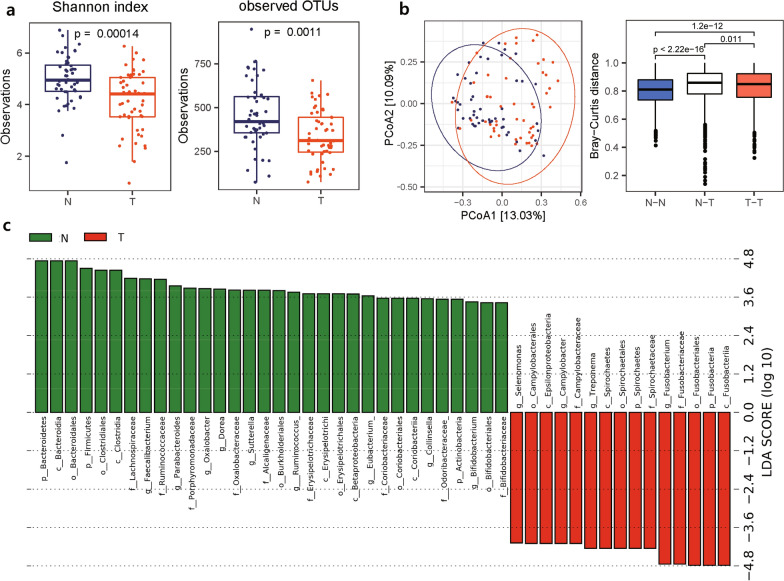
Methods: In the present work, we analyzed 102 microbiome datasets containing tumor- and normal tissue-derived microbiomes obtained from a total of 51 Korean colorectal cancer (CRC) patients using 16S rRNA amplicon sequencing. Two types of comparisons were used: 'normal versus (vs.) tumor' comparison and 'recurrent vs. nonrecurrent' comparison, for which the prognosis of patients was retrospectively determined.

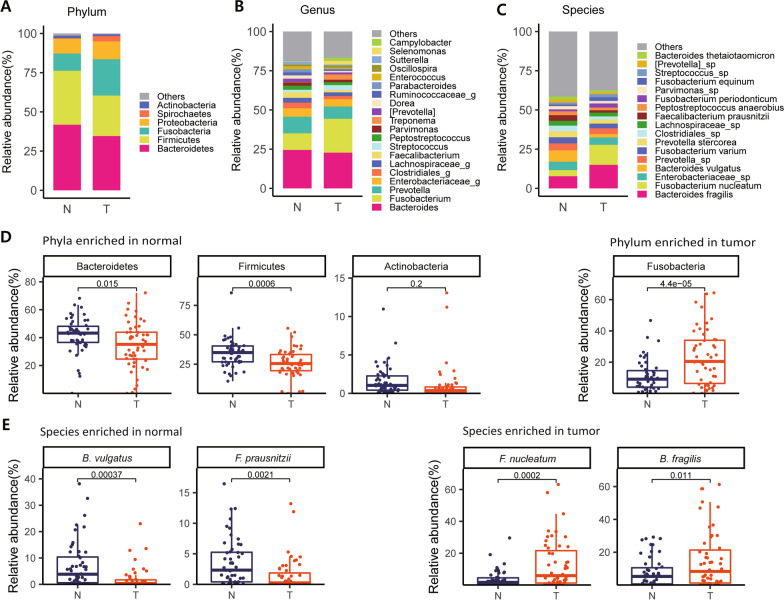
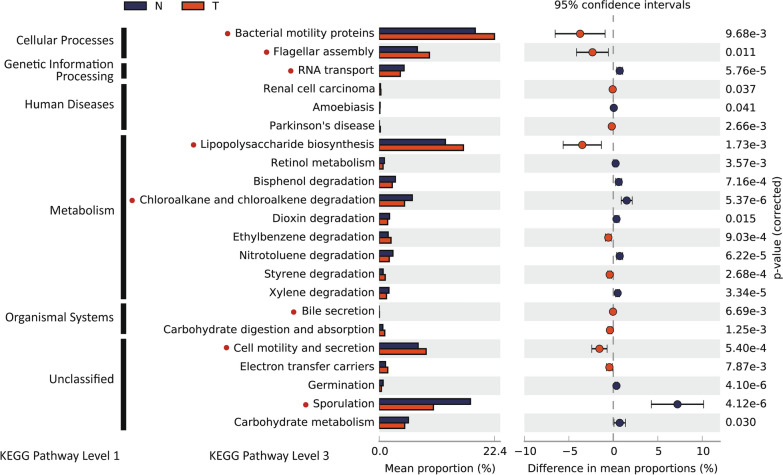
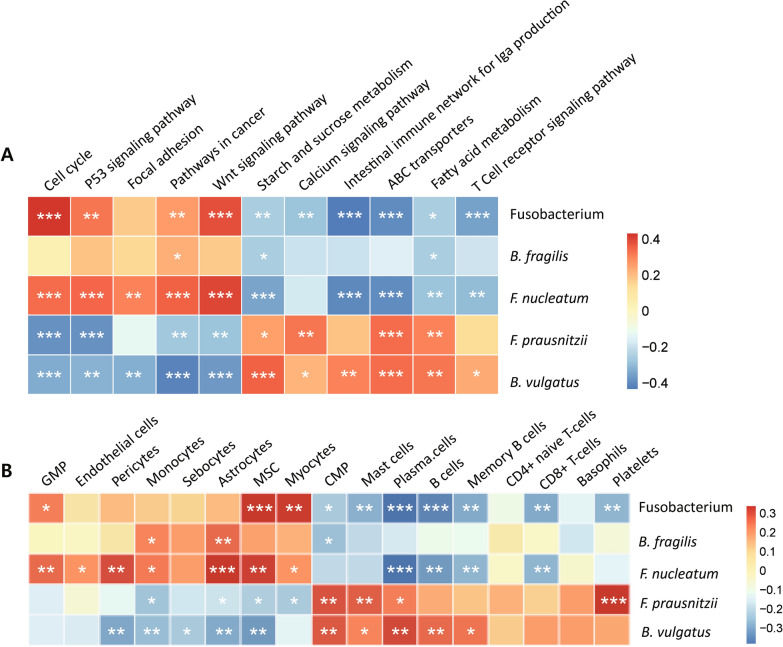
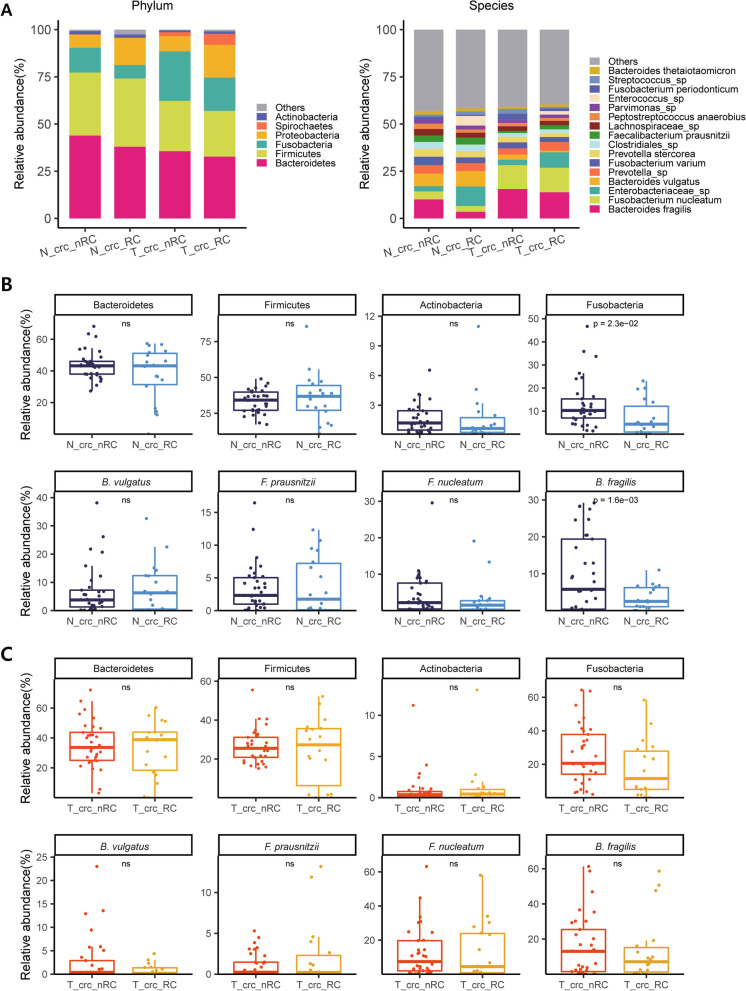
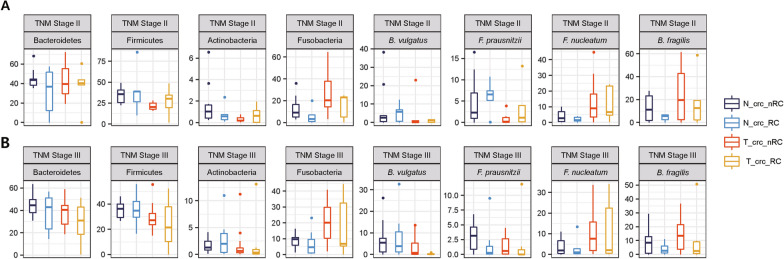
Results: As a result, we observed that in the 'normal vs. tumor' comparison, three phyla, Firmicutes, Actinobacteria, and Bacteroidetes, were more abundant in normal tissues, whereas some pathogenic bacteria, including Fusobacterium nucleatum and Bacteroides fragilis, were more abundant in tumor tissues. We also found that bacteria with metabolic pathways related to the production of bacterial motility proteins or bile acid secretion were more enriched in tumor tissues. In addition, the amount of these two pathogenic bacteria was positively correlated with the expression levels of host genes involved in the cell cycle and cell proliferation, confirming the association of microbiomes with tumorigenic pathway genes in the host. Surprisingly, in the 'recurrent vs. nonrecurrent' comparison, we observed that these two pathogenic bacteria were more abundant in the patients without recurrence than in the patients with recurrence. The same conclusion was drawn in the analysis of both normal and tumor-derived microbiomes.

Conclusions: Taken together, it seems that understanding the composition of tissue microbiomes is useful for predicting the prognosis of CRC patients.

Keywords: 16S rRNA; B. fragilis; Colorectal cancer; F. nucleatum; Microbiome.


Conflict of interest statement

The authors declare that they have no competing interests.

Figures

Fig. 1
Fig. 1
Bacterial diversity of normal and tumor tissues in CRC patients. a The α-diversity estimated by the Shannon index and observed OTUs. b (left) The β-diversity estimated using PCoA of OTUs. (right) Distribution of Bray–Curtis distances of OTUs in normal samples (N–N), tumor samples (T-T), and normal and tumor samples (N-T). c LEfSe plot illustrating microbial taxa enriched in normal compared with CRC tumor tissues. N: normal, T: tumor
Fig. 2
Fig. 2
Colorectal cancer-associated bacterial composition. Average relative composition of the bacterial community at the phylum (a), genus (b) and species levels (c). d Box plot analysis of the relative abundance of four bacterial phyla, Bacteroidetes, Firmicutes, Actinobacteria and Fusobacteria. e Box plot analysis of the relative abundance of four species, B. vulgatus and F. prausnitzii, F. nucleatum and B. fragilis. Statistical significance was estimated by T-test
Fig. 3
Fig. 3
Functional pathways predicted with tumor- and normal tissue-enriched bacteria. KEGG pathways of OTUs enriched differentially between normal and tumor tissues were analyzed using PICRUSt (see “Materials and methods”). P-values were estimated by Welch's t-test
Fig. 4
Fig. 4
Correlations between the expression levels of host genes and the microbiome composition. a The relationship between the abundance of some selected bacteria enriched differently between normal and tumor tissues and the pathways of genes expressed in CRC tissues estimated by ssGSEA. b Correlation between the composition of cell types deconvoluted by xCell and the bacteria used in a. The color of the squares indicates the magnitude of the correlation according to the scales indicated in the bar on the right side, and asterisks indicate the significance of the correlation (***P < 0.001, **P < 0.01, *P < 0.05)
Fig. 5
Fig. 5
Comparison of the microbiome composition in four different tissue types. a Patients were divided into four subgroups by adding prognostic information that was retrospectively determined (RC: recurrence; nRC: nonrecurrence), accompanied by normal tissue- and tumor-derived microbiomes, i.e., ‘N_crc_RC’, ‘N_crc_nRC’, ‘T_crc_RC’, and ‘T_crc_nRC’, as described in the main text. Differences in microbial composition are displayed at the phylum (left) and species levels (right). b Box plot analysis of the relative abundance of selected OTUs at the phylum level (top) and the species level (bottom) between ‘N_crc_RC’ and ‘N_crc_nRC’. c Box plot analysis of the relative abundance of selected OTUs at the phylum level (top) and the species level (bottom) between ‘T_crc_RC’ and ‘T_crc_nRC’. a, b The samples used were derived from a total of 33 ‘crc_nRC’ and 18 ‘crc_RC’ samples for both normal and tumor samples (Additional file 1: Table S1)
Fig. 6
Fig. 6
Difference in bacterial abundance between ‘crc_RC’ and ‘crc_nRC’ when the TNM stages were controlled. a Comparison of the abundances of selected OTUs for patients with TNM stage II (from 12 ‘crc_nRC’ and 3 ‘crc_RC’ samples) and b Comparison of the abundances of selected OTUs for patients with TNM stage III (from 17 ‘crc_nRC’ and 6 ‘crc_RC’ samples). a, b Refer to Additional file 1: Table S1 for the numbers of samples used

References

    1. Nguyen HT, Duong H. The molecular characteristics of colorectal cancer: implications for diagnosis and therapy. Oncol Lett. 2018;16(1):9–18. - PMC - PubMed
    1. Schatoff EM, Leach BI, Dow LE. Wnt signaling and colorectal cancer. Curr Colorectal Cancer Rep. 2017;13(2):101–110. - PMC - PubMed
    1. Armaghany T, Wilson JD, Chu Q, Mills G. Genetic alterations in colorectal cancer. Gastrointest Cancer Res. 2012;5(1):19–27. - PMC - PubMed
    1. Macrae FA. Colorectal cancer: epidemiology, risk factors, and protective factors. Uptodate com [ažurirano 9.lipnja 2017]. 2016.
    1. Sandler RS. Epidemiology and risk factors for colorectal cancer. Gastroenterol Clin N Am. 1996;25(4):717–735. - PubMed

Publication types

Substances