Review
. 2022 Jul:82:68-93.
doi: 10.1016/j.semcancer.2021.11.001. Epub 2021 Nov 26.

Understanding and targeting prostate cancer cell heterogeneity and plasticity

Affiliations
Review

Understanding and targeting prostate cancer cell heterogeneity and plasticity

Dean G Tang. Semin Cancer Biol. 2022 Jul.

Abstract

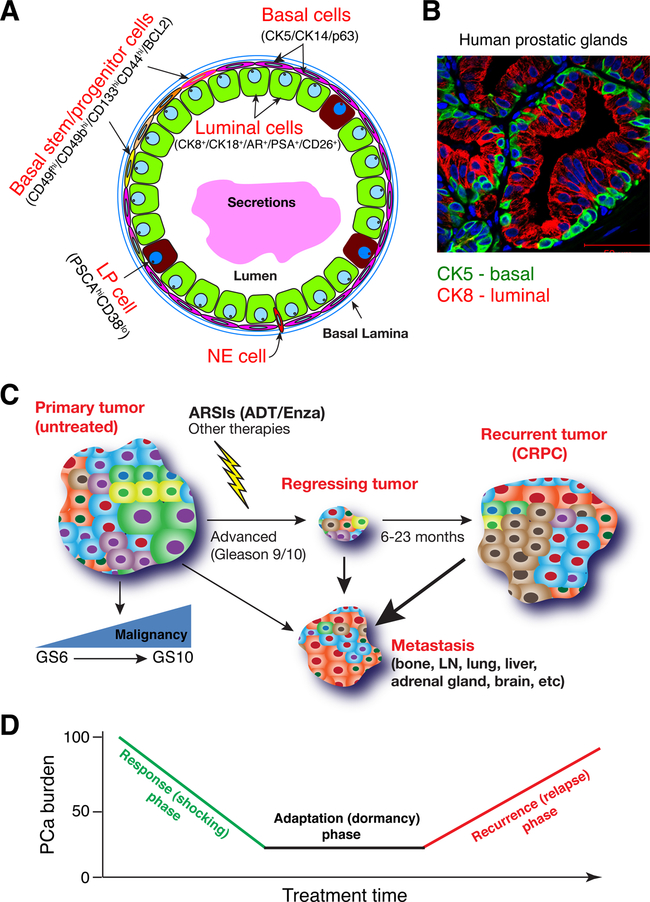
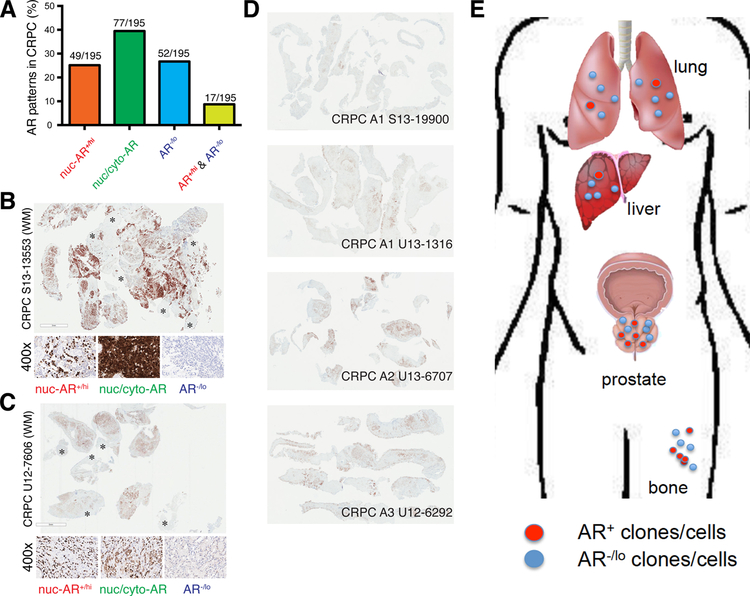
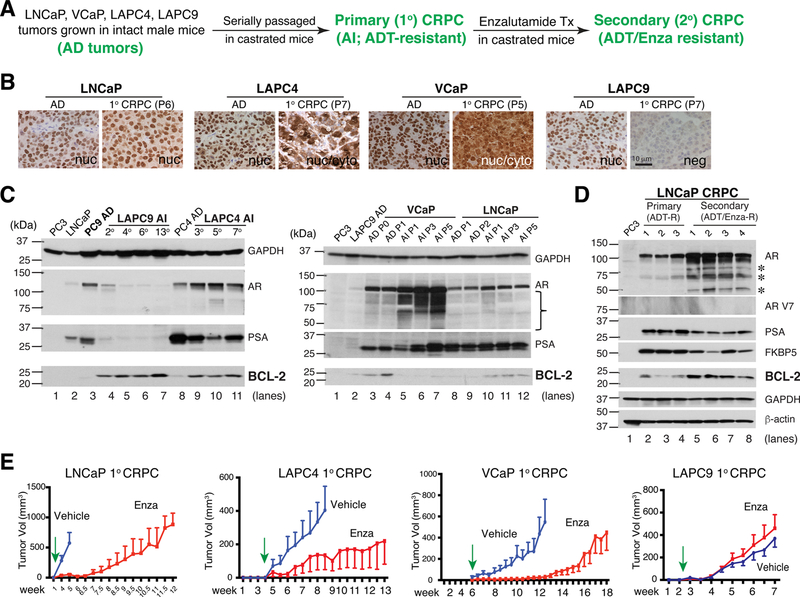
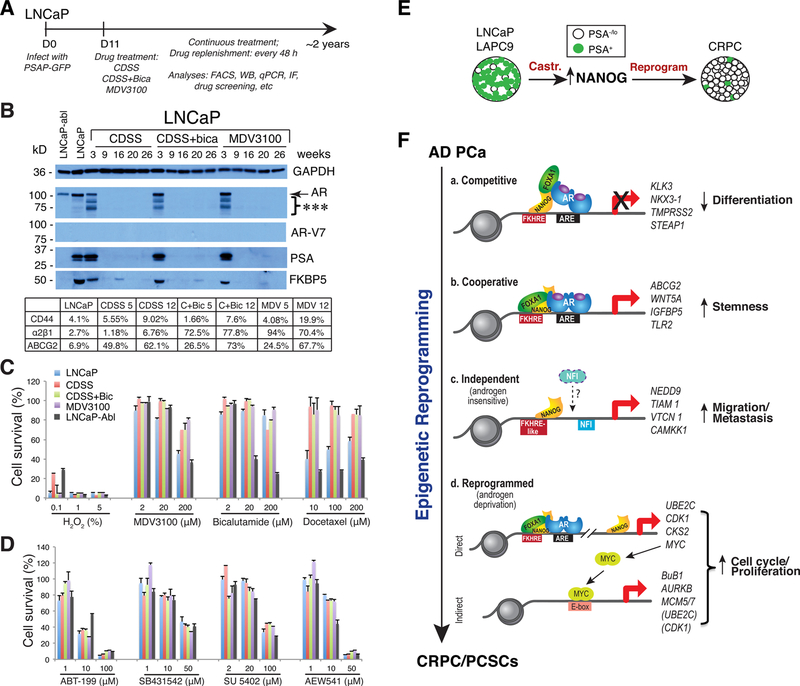
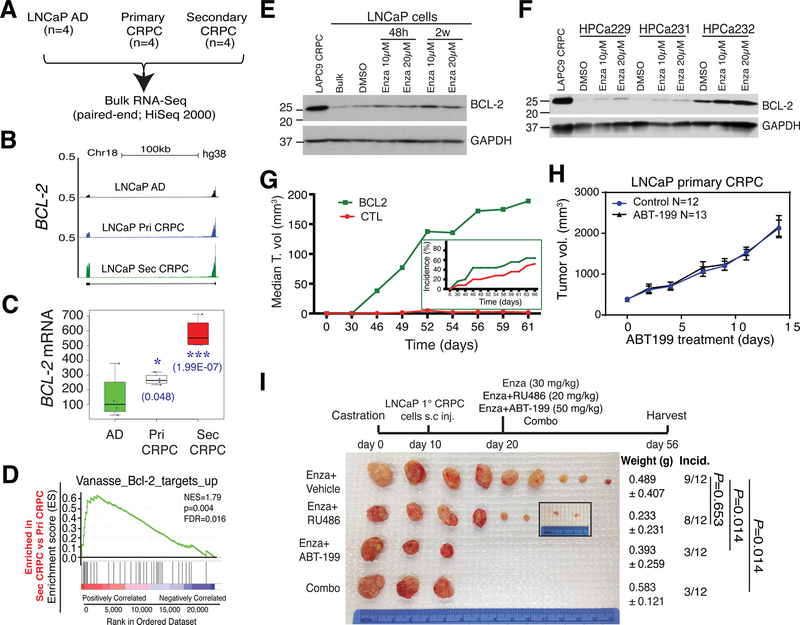
Prostate cancer (PCa) is a prevalent malignancy that occurs primarily in old males. Prostate tumors in different patients manifest significant inter-patient heterogeneity with respect to histo-morphological presentations and molecular architecture. An individual patient tumor also harbors genetically distinct clones in which PCa cells display intra-tumor heterogeneity in molecular features and phenotypic marker expression. This inherent PCa cell heterogeneity, e.g., in the expression of androgen receptor (AR), constitutes a barrier to the long-term therapeutic efficacy of AR-targeting therapies. Furthermore, tumor progression as well as therapeutic treatments induce PCa cell plasticity such that AR-positive PCa cells may turn into AR-negative cells and prostate tumors may switch lineage identity from adenocarcinomas to neuroendocrine-like tumors. This induced PCa cell plasticity similarly confers resistance to AR-targeting and other therapies. In this review, I first discuss PCa from the perspective of an abnormal organ development and deregulated cellular differentiation, and discuss the luminal progenitor cells as the likely cells of origin for PCa. I then focus on intrinsic PCa cell heterogeneity in treatment-naïve tumors with the presence of prostate cancer stem cells (PCSCs). I further elaborate on PCa cell plasticity induced by genetic alterations and therapeutic interventions, and present potential strategies to therapeutically tackle PCa cell heterogeneity and plasticity. My discussions will make it clear that, to achieve enduring clinical efficacy, both intrinsic PCa cell heterogeneity and induced PCa cell plasticity need to be targeted with novel combinatorial approaches.

Keywords: Androgen receptor; Cancer cell heterogeneity; Cancer cell plasticity; Cancer stem cells; Prostate cancer.


Conflict of interest statement

Declaration of Competing Interest

The authors report no declarations of interest.

Figures

Fig. 1.
Fig. 1.. Normal human prostatic glands and PCa.
A. Schematic of human prostatic glands. Both basal and luminal cell compartments harbor differentiated as well as less mature stem/progenitor cells. LP, luminal progenitor; NE, neuroendocrine. B. Double immunofluorescence staining of CK5 and CK8 in benign human prostatic glands. C. Human PCa at different clinical stages of development. Shown are 4 representative types of PCa, i.e., primary, regressing tumors (during therapy), recurrent tumors (i.e., CRPC in the prostate) and metastasis in different organs. D. PCa response to clinical treatments goes through 3 typical phases, i.e., response, adaptation and recurrence. ‘PCa burden’ is measured by serum PSA levels, primary tumor sizes, and imaging analyses. see Text for details.
Fig. 2.
Fig. 2.. Histo-structural, cellular and molecular heterogeneity in human PCa.
Shown are the Aperio ScanScope images of whole-mount sections (4x) of HPCa57 (A–C), HPCa58 (E–F), HPCa70 (G–I) and HPCa101 (J–L) stained for HE (C, F, I, L), AR (B, E, H, K), and PSA (A, D, G, J). HPCa 57, 58 and 70 are Gleason score 7 (GS7) tumors while HPCa101 is a Gleason 9 tumor. Serially transplantable PDX have been established from all 4 HPCa samples. Shown on the right are representative enlarged (zoom-in) HE images (200x) of differentiated (D) and poorly or undifferentiated (U) areas. For AR/PSA IHC images, a higher magnification (400x) inset was shown for each HPCa sample to illustrate AR−/lo and PSA−/lo PCa cells, and to illustrate the frequently discordant AR and PSA expression. For instance, in HPCa57, ARhi (demarcated by a solid circle) and AR−/lo (dashed line) areas could be discerned. In HPCa58, two AR−/lo areas are indicated by dashed circles. In HPCa70 and HPCa101, areas marked by dashed lines indicate discordant expression of AR and PSA. Note that AR IHC was performed using an antibody against the N-terminus, which recognizes both full-length AR and all c-terminally truncated splice variants.
Fig. 3.
Fig. 3.. PCa heterogeneity: Inverse correlation between tumor PSA (KLK3) mRNA levels and tumor grade, metastasis, and patient survival.
A-E. Tumor KLK3 mRNA levels are inversely correlated with the tumor grade. Shown are results from 4 PCa cohorts (A–D) in Oncomine. E, the heatmap legend. Data in B also illustrates discordant PSA and AR mRNA expression in patient tumors. F. Reducing PSA (KLK3) mRNA levels with increasing Gleason grade (GS) of prostate tumors in TCGA. Patient numbers are indicated in parentheses. #, P < 0.001 compared with normal and *P < 0.00001 compared with GS6 tumors (paired Student’s t-test). The PSA mRNA levels display a statistically significant decreasing trend with increasing tumor grade (**P < 0.0001, Proportion Trend test). G. Tumor PSA mRNA levels inversely correlate with tumor grade, metastasis, recurrence and survival in the Nakagawa data set. Shown are reduced PSA mRNA levels in high-grade (GS9–10) tumors, patients with lymph node (N) metastasis, patients that had recurrent diseases within 3 years, and in patients who were dead 3 years after diagnosis. H-J. Tumor PSA mRNA levels were reduced in metastases in most Oncomine data sets (H) as illustrated in Varambally (I) and Yu (J) data sets. P values were determined by Student’s t-test. K-L. High tumor PSA mRNA levels correlate with better biochemical recurrence (BCR) free and overall survival of PCa patients in the Nakagawa data set (K) and with better patient survival in 3 other data sets (L). P values were determined by log-rank test. Panels A, C–E, G, I–K were adapted with permission from reference [131]. Panels B, H and L were adapted with permission from reference [144].
Fig. 4.
Fig. 4.. PCa cell heterogeneity: Pre-existence of PSA−/lo PCa cells in treatment-naive HPCa and enrichment of PSA−/lo cells in advanced and treatment-failed PCa.
A-B. Representative immunofluorescence images (x400) illustrating discordant PSA and AR protein expression and the presence of PSA−/lo PCa cells in untreated HPCa 14 (GS7; A) and quantification of 4 subpopulations of PCa cells in the 9 HPCa samples (B). In A, AR+PSA+ PCa cells are marked by red nuclei and green cytoplasm, AR+PSA−/lo cells by red staining (panel c, white circled areas), AR-PSA+ cells by green staining (panel c, asterisks), and AR-PSA−/lo /lo cells by being negative (or low) for both red and green staining (panel d, white circle). C. The abundance of PSA−/lo tumor cells is increased in high-grade (GS9/10) and in treatment-failed (Tx) PCa compared to untreated low/intermediate grade (GS7) tumors (n = 20–24 for each type of tumor samples). D. IHC analysis of AR and PSA in the TMA samples. Shown are 4 CRPC samples illustrating homogeneous loss of PSA in all 4 samples and heterogeneous expression of AR (insets: 400x). E. Schematic illustration of increasing PSA−/lo PCa cells from low-grade (LG) tumors to untreated high-grade (HG) tumors and to CRPC. Panels A, B and D were adapted with permission from reference [144]. Panel C was adapted with permission from reference [131].
Fig. 5.
Fig. 5.. Studying PCa cell heterogeneity in PCa cell and xenograft models: PSA−/lo PCa cells accumulate in experimental CRPC models.
A–B. Accumulation of PSA−/lo cells in LNCaP-AI tumors. (A) Double immunofluorescence (IF) staining of AR and PSA in AD (androgen-dependent) vs. AI (androgen-independent) LNCaP xenograft tumors. In panel c, the white line demarcates 3 AR+PSA+ cells and the arrows point to 2 AR+PSA−/lo cells. In panel d, the white circle demarcates several AR-PSA−/lo cells and the arrows point to 3 AR-PSA+ cells. In panel h, the arrows illustrate several AR-PSA−/lo cells. Shown are representative confocal images (original magnification; x400). (B) Quantification of the 4 subtypes of PCa cells in AD and AI LNCaP xenograft tumors. A total of 809 and 907 cells were counted from several AD and AI tumors, respectively. *P < 0.001 in AI compared in AD tumors. C. WB analysis of AR and PSA heterogeneity in cultured LNCaP cell sublines. PC3 and IGR1 cells, which are negative for both proteins, were used as controls. Note that the wild-type LNCaP cells (lane 3) were AR+PSA+ whereas LNCaP-abl cells AR+PSA (lane 2). LNCaP-CDSS and LNCaP-MDV cells were both ARPSA (lanes 5–6). The arrow indicates the ~114 kD full-length AR and lower bands represent AR splice variants (top panel). D. Heterogeneity in expression of phenotypic markers in cultured LNCaP cells. Shown are representative IF images of AR, PSA, pan-cytokeratin, EpCAM and PSMA. E. Double IF staining of AR and PSA in AD vs. AI LAPC4 xenograft tumors. In panel c, the white circle indicates several AR+PSA−/lo cells and arrows indicate AR-PSA+ cells. In panel d, arrows point to AR-PSA−/lo cells. Note significantly increased PSA−/lo LAPC4 cells in the AI tumor (f). Shown are representative confocal images (original magnification; x400). All panels (except most of D) were adapted with permission from reference [144].
Fig. 6.
Fig. 6.. The PSA−/lo PCa cell population harbors cells that exhibit CSC properties.
A. Most PSA−/lo PCa cells are also AR. Shown are IF images of LNCaP cells separated by the PSAP-GFP lentiviral reporter and stained for AR. Note that all GFP+ (PSA+) LNCaP have high nuclear AR whereas the majority of PSA−/lo cells are also AR−/lo. B. PSA−/lo PCa cells are more dormant and can undergo ACD (bottom) whereas PSA+ PCa cells are more proliferative and only undergo symmetrical cell division. Shown are time-lapse images of LNCaP cells infected with the PSAP-GFP reporter and recorded at the indicated time points. C. PSA−/lo LNCaP cells have much longer cell-cycle transit times than the corresponding PSA+ cells. The number of cells analyzed by time lapse videomicroscopy are indicated in parentheses. D. The PSA−/lo PCa cells can initiate long-term xenografts that can be serially propagated. PSA+(GFP+) and PSA−/lo (GFP−/lo) LAPC9 cells were purified from reporter tumors and 10,000 cells each (+10 K or −10 K) were implanted subcutaneously in intact male NOD-SCID mice. The first-generation (1 °) tumors were harvested ~2 months later. One +10 K tumor and two −10 K tumors were utilized to purify GFP+ and GFP-/lo LAPC9 cells, respectively, which were used in secondary (2 °) tumor transplantation experiments. One +10 K and one −10 K 2 ° tumors were utilized to purify GFP+ and GFP- LAPC9 cells, respectively, for 3 ° transplantation. The 4 °, 5 ° and 6 ° transplantation experiments were carried out in a similar fashion. For each generation, tumor images (shown not to the same scale), tumor incidence (%; *P = 0.045 and **P = 0.006, when compared to the corresponding +10 K groups, χ2 test), time (d) of harvest, tumor weights (mean ± S.D), and P values (Student’s t-test) were indicated. For the 6 ° generation, statistics was not applicable due to the small number of tumors developed in the PSA+ group. E. PSA−/lo LNCaP cells are resistant to androgen deprivation (i.e., CDSS plus bicalutamide) as well as chemotherapeutics and hydrogen peroxide. Shown are % PSA−/lo cells in PSAP-GFP infected LNCaP cells treated with the conditions indicated for 2, 4, and 7 days (d). Differences between all individual treatments and DMSO are statistically significant (P < 0.01). F. PSA−/lo PCa cells are more resistant to apoptosis as assessed by the Vybrant apoptosis assays. Bulk cultured LNCaP cells infected with the PSAP-GFP lentiviral reporter were plated at 120,000 cells/well in 6-well plates. Cells were treated for 4 days with either DMSO, 2% CDSS plus 20 μM Bicalutamide (CDSS/Bic), 20 nM Paclitaxel, 1 μM etoposide, or 1 μM H2O2. The % apoptosis represents the mean ± S.D (n = 3) and P values determined by Student’s t-test. No difference in apoptosis was observed in the two populations in response to vehicle DMSO (not shown). Panels A–C and F were adapted with permission from reference [144]. Panels D and E were adapted with permission from reference [131].
Fig. 7.
Fig. 7.. Studying PCa cell heterogeneity in treatment-naïve patient primary prostate tumors.
A. Pie chart presentation of the Gleason grade distribution of 210 HPCa samples out of a total of 232 (please change the number to 232) HPCa our lab used and studied from Feb. of 2005 to April of 2016 at the M.D Anderson Cancer Center. HPCa, human prostate cancer (specimens or samples). B. Experimental uses for the HPCa (1–6) and matching benign samples (7–8) in our lab. CAFs, carcinoma-associated fibroblasts; FFPE, formalin-fixed and paraffin embedded; NGS, next-generation sequencing (studies); NHP, normal human prostate (epithelial) cells; N/S, NOD/SCID mice; NSG, NOD/SCID-γ mice. C. An example of tumor regeneration from purified CD44+ HPCa cells. CD44+ and CD44 HPCa52 cells were MACS-purified from patient tumor (GS8) and co-injected, at the indicated cell numbers, with 10k Hs5 cells in 50 % Matrigel s.c into irradiated NOD/SCID-γ mice. The 10k and 100k tumors were harvested at ~4 months whereas 100 and 1k tumors were harvested at 7 months after implantation. Shown on the right are TIF (tumor-initiating cell frequency). The difference in CD44+ HPCa 52 cell TIF and the corresponding CD44- cell TIF is highly statistically significant (P = 1.73e-13). D. Success rate (%) of PDX (patient-derived xenograft) regeneration plotted based on total # of HPCa patient specimens (left bars; e.g., for GS7 tumors, 34 of the 43 patient HPCa pieces implanted in immunodeficient mice regenerated PDX [79 %]) or total # of implants (right bars; e.g., 89 of the 194 GS7 HPCa pieces implanted in all 3 sites (i.e., sc, KC, and AP) regenerated PDX [thus 46 %]). E. Serially transplantable HPCa101 (GS9[4 + 5]) PDX derived from tumor piece implantation. Shown are representative tumor images of HPCa101 PDX at multiple generations (G). castr, castrated; sc, subcutaneously. F. qPCR analysis of CD44, AR, and PSA mRNAs in CD44+ and CD44 HPCa cells freshly purified from untreated primary prostate tumors. The results are expressed as the mRNA levels in CD44+ HPCa cells relative to those in the matched CD44 HPCa cells. *P < 0.05; #P < 0.01 (Student’s t-test). Panels F was adapted with permission from reference [144].
Fig. 8.
Fig. 8.. Studying PCa cell heterogeneity in treatment-naïve patient primary prostate tumors.
Shown are examples of PDXs established in our lab from treatment-naïve patient prostate tumors using tumor pieces xenotransplanted in immune deficient mice. A. Basic experimental flow. AP, anterior prostate; CAFs, carcinoma-associated fibroblasts; Hs5, immortalized human BM mesenchymal stem cells; KC, kidney capsule; sc, subcutaneously; UGM, urogenital mesenchyme. B-D. Examples of PDXs established from Gleason 7 (B; 6 HPCa examples shown), Gleason 8 (C; 3 HPCa examples shown), and Gleason 9 (D; 6 HPCa samples shown) HPCa samples. IR, irradiated; P, passage. E. Four generations (G) of HPCa70 PDX tumors are illustrated. A representative HE staining for G1 and G4 tumor was shown on the right.
Fig. 9.
Fig. 9.. AR heterogeneity in CRPC and PCa metastases.
A. Quantitative summary of the 4 AR expression patterns in CRPC based on the AR IHC analysis in 195 TMA cores. B-C. Whole-mount (WM) sections showing AR heterogeneity in both expression levels and subcellular distribution patterns in two cases of patient CRPC. AR was stained using an antibody recognizing an N-terminal epitope that will capture full-length AR and all C-terminally truncated AR splice variants. AR−/lo cells/areas are indicated by asterisks (*). Shown below the WM sections are enlarged images of 3 main patterns of AR expression, i.e., AR−/lo, nuclear AR (nuc-AR+/hi) and mixed nuclear/cytoplasmic AR (nuc/cyto-AR). D. AR IHC in another 4 cases of patient CRPC. AR staining in WM sections was conducted as in B–C. E. Metastases in PCa patients also exhibit AR+ and AR−/lo clonal patterns, based on recent imaging analysis [212,213]. Panels A–D were adapted with permission from reference [163].
Fig. 10.
Fig. 10.. AR−/lo CRPC is insensitive to Enza and BCL-2 is upregulated by castration.
A. Schema in generating paired xenograft AD tumors, primary CRPC (ADT-resistant) and secondary CRPC (both ADT/Enza-resistant) in LNCaP, VCaP, LAPC4 and LAPC9 models. B. The above 4 xenografts develop unique AR expression patterns as they evolve towards CRPC. P, passage (of tumors in mice). C. BCL-2 was elevated in 3 of the 4 CRPC xenograft (except VCaP) models. D. BCL-2 was further increased in the LNCaP secondary CRPC model. E. Distinct responses of the 4 xenograft CRPC models to Enza (see Text). Green arrows indicate the time when treatment of tumor-bearing mice was started. All panels in the Figure were adapted with permission from reference [163].
Fig. 11.
Fig. 11.. PCa cell plasticity induced by ARSIs and stemness factor NANOG.
A–D. LNCaP cell plasticity and reprogramming by ARSIs. Shown in (A) is the experimental schema, in which bulk LNCaP cells were infected with the PSAP-GFP lentiviral reporter. In (B), LNCaP cells treated with 3 regimens of castration, i.e., CDSS, CDSS plus bicalutamide, and MDV3100 (Enza) for up to 26 weeks were used in Western blot analysis of AR, AR-V7 and two AR downstream targets, PSA and FKBP5. Regular LNCaP cells and LNCaP-abl cells were used as controls. Shown below is the summary of flow analysis of 3 PCSC markers in regular LNCaP and in 3 LNCaP-CRPC cells treated with CDSS, CDSS/bicalutamide (C + Bic) and MDV3100 (MDV) for 5 or 12 weeks. LNCaP-CRPC cells, in contrast to LNCaP and LNCaP-abl cells, were highly refractory to Enza, Bicalutamide and docetaxel (C) but were sensitive to BCL-2 inhibitor (ABT-199) and inhibitors of ALK (SB431542), VEGFR2/FGFR/PDGFR (SU 5402) and IGFR1 (AEW541). E–F. Inducible NANOG expression time-dependently reprograms LNCaP-AD cells to the CRPC state. Shown in E is a schematic to illustrate that in LNCaP and LAPC9, PSA−/lo PCa cells normally comprise the minor population but castration upregulates NANOG that subsequently contributes to the generation of CRPC in which PSA−/lo cells now constitute the majority. Shown in F is a model depicting modes of operation of NANOG during reprogramming of androgen-dependent PCa cells to the CRPC state (see Text). Panels A–D were adapted with permission from reference [152] and panels E–F from reference [150].
Fig. 12.
Fig. 12.. BCL-2 represents a therapeutic target in AR+/hi subtype of CRPC.
A–D. In whole-genome RNA-seq experiments (A), BCL-2 mRNA was increased in LNCaP primary (Pri; ADT-resistant) CRPC but dramatically upregulated in LNCaP secondary (Sec; both ADT/Enza-resistant) CRPC (B–C). Consequently, a BCL-2 target signature was enriched in LNCaP secondary CRPC compared to the LNCaP primary CRPC (D). E–F. BCL-2 protein was upregulated by Enza in cultured LNCaP cells (E) as well as in primary tumor cells freshly purified from 3 HPCa patients. G. BCL-2 overexpression is sufficient to promote LNCaP tumor growth (i.e., median tumor (T) volume) and also increase tumor incidence (inset). Please introduce a space between this sentence and the next sentence (in front of H). H-I. BCL-2 inhibitor, ABT-199, did not appreciably affect the LNCaP primary CRPC growth (H) but, when used in combination with Enza, dramatically curbed development of castration/Enza-resistant secondary CRPC (I). All panels in this Figure were adapted with permission from reference [163].
Fig. 13.
Fig. 13.. BCL-2 represents a therapeutic target in AR−/lo subtype of CRPC.
A. BCL-2 was upregulated in LAPC9-CRPC and remained at increased levels in LAPC9-CRPC further treated with Enza. B-C. BCL-2 mRNA was significantly upregulated in LAPC9-CRPC compared to LAPC-AD. Also upregulated in LAPC9-CRPC were integrin α2 (ITA2) and N-cadherin (CDH2) (B). D. BCL-2 inhibitor, ABT-199, dose-dependently inhibited the growth of LAPC9-CRPC (i.e., LAPC9-AI) organoids whereas Enza demonstrated minimal effects and combination of ABT-199 and Enza (Combo) exhibited similar inhibitory effects to ABT-199 alone. E–F. BCL-2 antagonist, ABT-199, alone inhibited LAPC9-CRPC in vivo, which was further inhibited by the combination of ABT-199 and JQ1. All panels in this Figure were adapted with permission from reference [163].
Fig. 14.
Fig. 14.. Potential strategies to tackle PCa cell heterogeneity and plasticity.
A. A hypothetical model of intrinsic PCa cell heterogeneity. Primary (treatment-naïve) PCa consist of both bulk differentiated (AR+PSA+) cells as well as a subset of phenotypically undifferentiated (PSA−/lo) cells. The latter cells represent the PCSC pool in which other subsets of tumorigenic cells can be further identified and purified. While AR+PSA+ PCa cells are highly proliferative, most cells in the PSA−/lo PCSC pool remain dormant (below). ARSIs including ADT and Enza primarily and preferentially target the differentiated AR+PSA+ PCa cells while largely ignoring the PSA−/lo cells. We have identified BCL-2, NANOG and deregulated alternative splicing program as positive regulators of PCSCs and several tumor-suppressive miRNAs including miR-34a, let-7 and miR-141 as negative regulators of PCSCs. In principle, these tumor-suppressive miRNAs or the inhibitors of positive regulators can be used in conjunction with ADT/Enza to tackle PCa cell heterogeneity and plasticity. B. PCa cell plasticity (or de-differentiation) can be induced by genetic mutations, therapeutic treatments, inflammatory cytokines in the TME and by stemness gene overexpression. The reprogrammed PCa cells can be AR−/lo adenocarcinoma or AR−/lo NE-like cells (left). C. Persistent ADT leads to two subtypes of CRPC, AR+/hi and AR−/lo. D. Many of the stemness and neurogenesis genes are commonly enriched in PSA−/lo PCSCs, NEPC, CRPC and CRPC-NE, which are often called AVPC. Panel A was adapted with permission from reference [144].

References

    1. Shen MM, Abate-Shen C, Molecular genetics of prostate cancer: new prospects for old challenges, Genes Dev. 24 (18) (2010) 1967–2000. - PMC - PubMed
    1. Jamroze A, Chatta G, Tang DG, Androgen receptor (AR) heterogeneity in prostate cancer and therapy resistance, Cancer Lett. 518 (October 10) (2021) 1–9, 10.1016/j.canlet.2021.06.006. Online ahead of print. - DOI - PMC - PubMed
    1. Basu S, Dong Y, Kumar R, Jeter C, Tang DG, Slow-cycling (dormant) cancer cells in therapy resistance, cancer relapse and metastasis, Semin. Cancer Biol. (May 9) (2021), 10.1016/j.semcancer.2021.04.021.S1044-1579X(21)00122-X. Online ahead of print. - DOI - PMC - PubMed
    1. Fenelon JC, Banerjee A, Murphy BD, Embryonic diapause: development on hold, Int. J. Dev. Biol. 58 (2014) 163–174. - PubMed
    1. Bulut-Karslioglu A, Biechele S, Jin H, Macrae TA, Hejna M, Gertsenstein M, Song JS, Ramalho-Santos M, Inhibition of mTOR induces a paused pluripotent state, Nature 540 (2016) 119–123. - PMC - PubMed

Publication types

Substances