. 2022 Feb;81(2):214-224.
doi: 10.1136/annrheumdis-2021-220875. Epub 2021 Nov 29.

Targeting the IL-6-Yap-Snail signalling axis in synovial fibroblasts ameliorates inflammatory arthritis

Affiliations

Targeting the IL-6-Yap-Snail signalling axis in synovial fibroblasts ameliorates inflammatory arthritis

Rebecca A Symons et al. Ann Rheum Dis. 2022 Feb.

Abstract

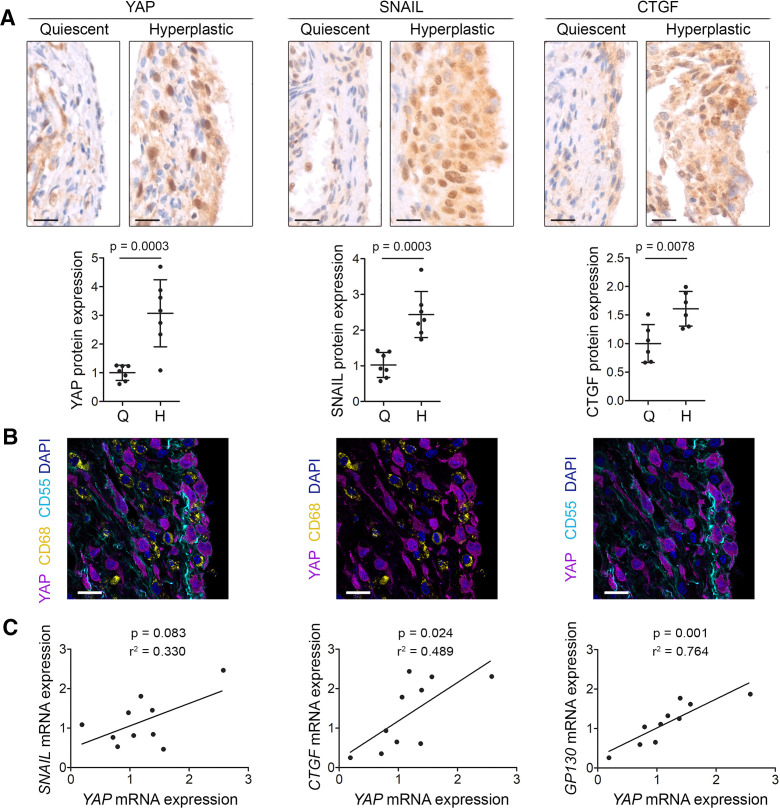
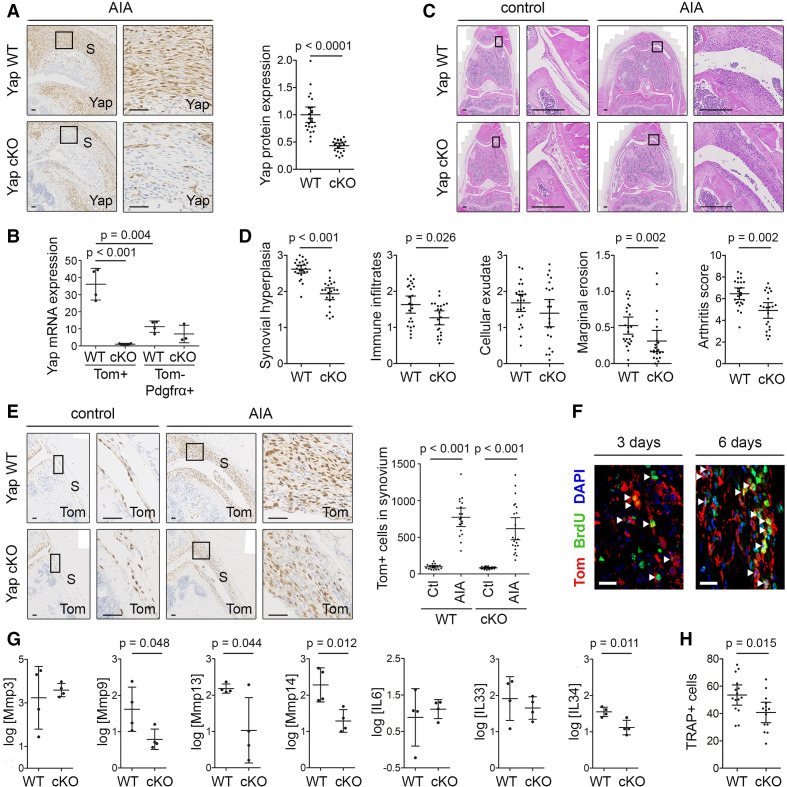
Objective: We aimed to understand the role of the transcriptional co-factor Yes-associated protein (Yap) in the molecular pathway underpinning the pathogenic transformation of synovial fibroblasts (SF) in rheumatoid arthritis (RA) to become invasive and cause joint destruction.

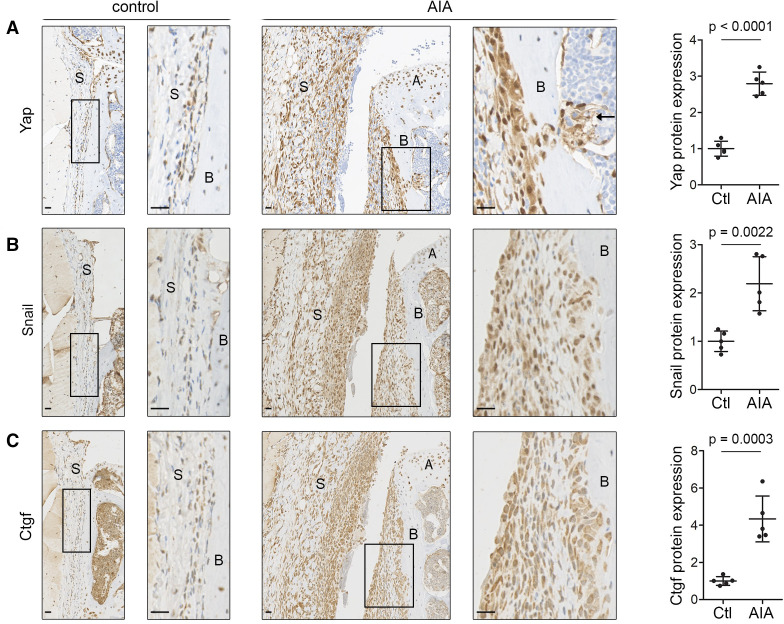
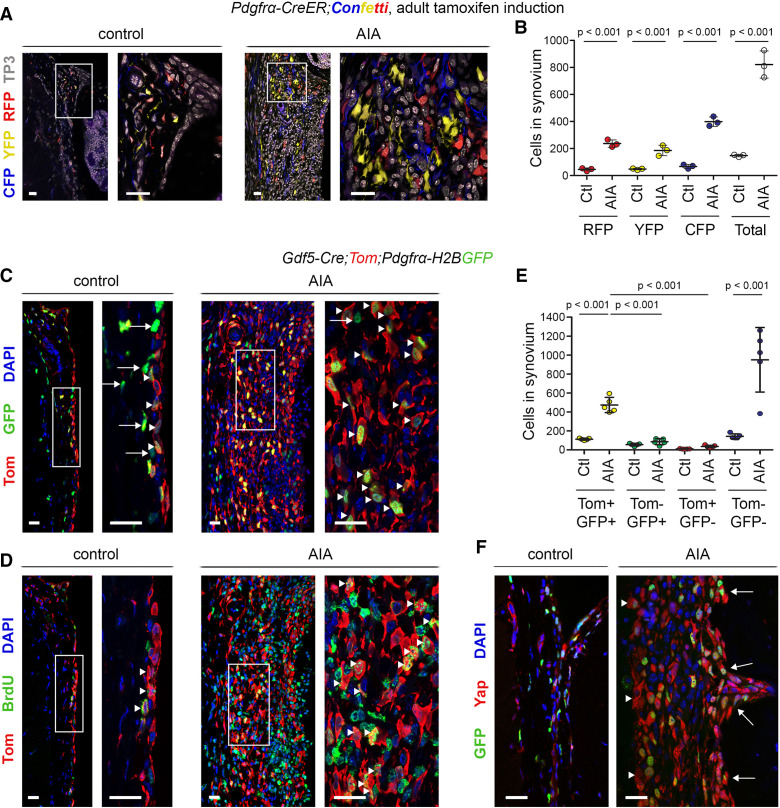
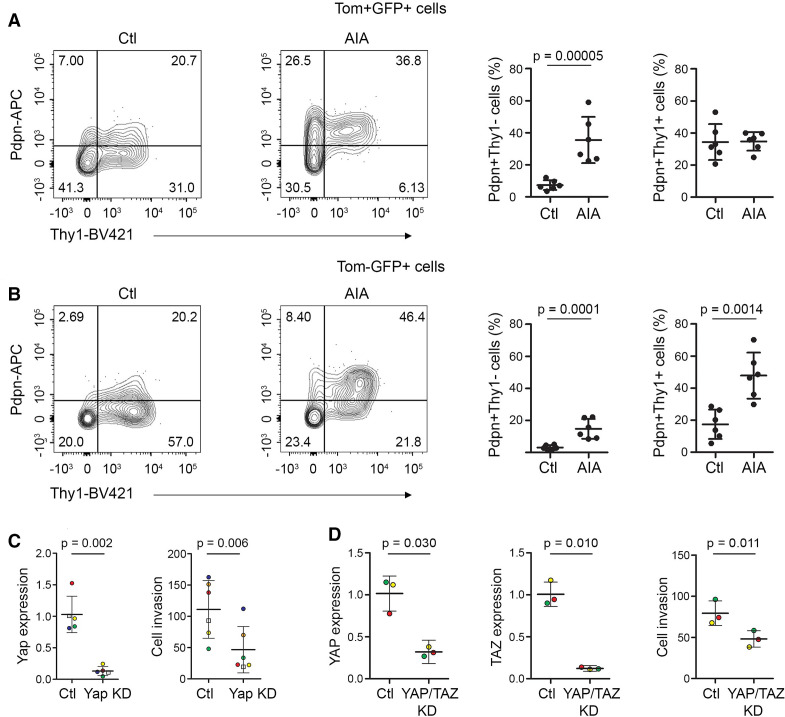
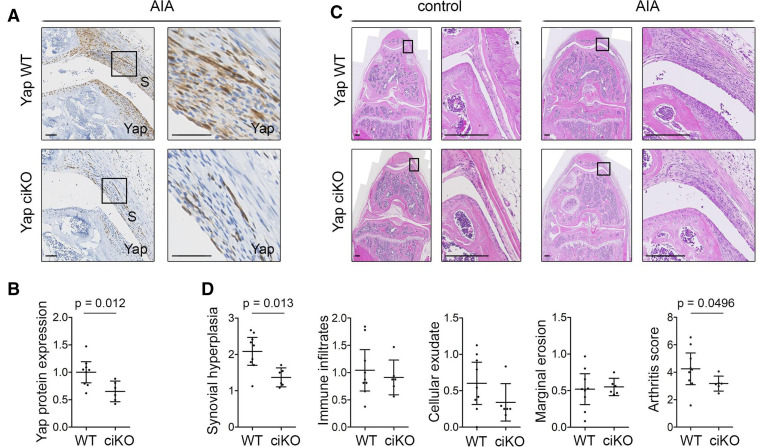
Methods: Synovium from patients with RA and mice with antigen-induced arthritis (AIA) was analysed by immunostaining and qRT-PCR. SF were targeted using Pdgfrα-CreER and Gdf5-Cre mice, crossed with fluorescent reporters for cell tracing and Yap-flox mice for conditional Yap ablation. Fibroblast phenotypes were analysed by flow cytometry, and arthritis severity was assessed by histology. Yap activation was detected using Yap-Tead reporter cells and Yap-Snail interaction by proximity ligation assay. SF invasiveness was analysed using matrigel-coated transwells.

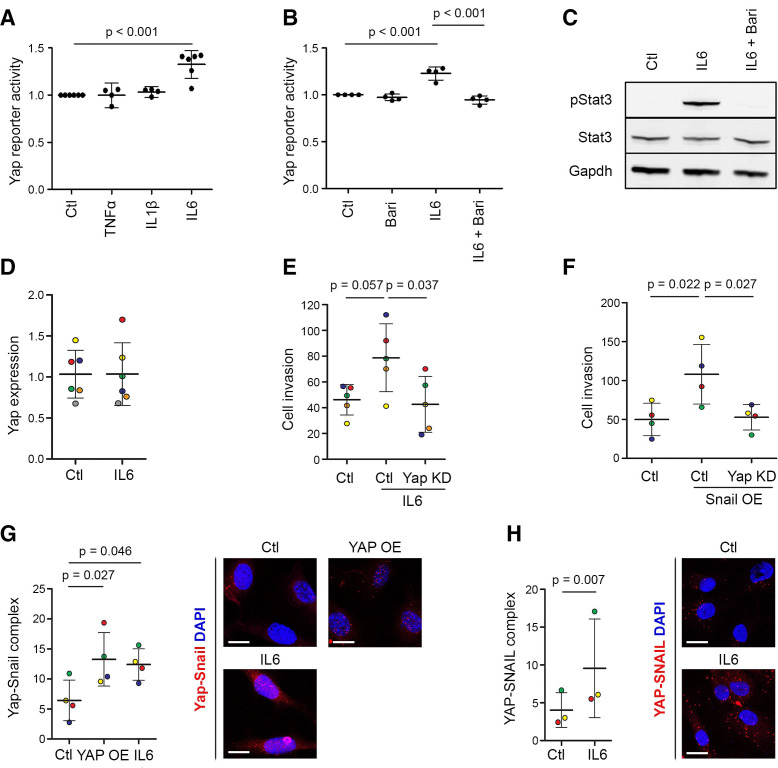
Results: Yap, its binding partner Snail and downstream target connective tissue growth factor were upregulated in hyperplastic human RA and in mouse AIA synovium, with Yap detected in SF but not macrophages. Lineage tracing showed polyclonal expansion of Pdgfrα-expressing SF during AIA, with predominant expansion of the Gdf5-lineage SF subpopulation descending from the embryonic joint interzone. Gdf5-lineage SF showed increased expression of Yap and adopted an erosive phenotype (podoplanin+Thy-1 cell surface antigen-), invading cartilage and bone. Conditional ablation of Yap in Gdf5-lineage cells or Pdgfrα-expressing fibroblasts ameliorated AIA. Interleukin (IL)-6, but not tumour necrosis factor alpha (TNF-α) or IL-1β, Jak-dependently activated Yap and induced Yap-Snail interaction. SF invasiveness induced by IL-6 stimulation or Snail overexpression was prevented by Yap knockdown, showing a critical role for Yap in SF transformation in RA.

Conclusions: Our findings uncover the IL-6-Yap-Snail signalling axis in pathogenic SF in inflammatory arthritis.

Keywords: arthritis; experimental; fibroblasts; inflammation; rheumatoid.


Conflict of interest statement

Competing interests: None declared.

Figures

Figure 1
Figure 1
YAP, SNAIL and CTGF are upregulated in hyperplastic rheumatoid arthritis synovium. (A) Immunohistochemical detection of YAP, SNAIL and CTGF in quiescent and hyperplastic areas of human RA synovium (YAP n=7, SNAIL n=7, and CTGF n=6). Haematoxylin counterstain is shown in blue. Scale bars: 20 µm. For isotype negative control stainings, see online supplemental figure 10a–c. Graphs indicate protein expression in quiescent (Q) and hyperplastic (H) synovium based on immunohistochemistry (IHC) staining intensity, with lines and error bars indicating mean±SD (n=6–7). P values indicate statistical significance using an unpaired two-tailed t-test. (B) Expression of YAP (magenta), the SF marker CD55 (cyan) and the macrophage marker CD68 (yellow) in human RA synovium (n=4). DAPI (4′,6-diamidino-2-phenylindole) nuclear counterstain is shown in blue. The same image is shown three times with different channels overlaid, for clarity. Scale bars: 20 µm. For isotype negative control stainings, see online supplemental figure 10d. (C) Correlation between YAP gene expression and expression of SNAIL, CTGF or GP130 in RA synovial biopsies (n=10) as determined by qRT-PCR. P values indicate results of Pearson’s correlation test and R2 values the square of the correlation coefficient. CTGF, connective tissue growth factor; RA, rheumatoid arthritis; SF, synovial fibroblast; YAP, Yes-associated protein.
Figure 2
Figure 2
Yap, Snail and Ctgf are upregulated in inflammatory arthritis in mice. (A–C) Immunohistochemical detection of Yap (A), Snail (B) and Ctgf (C) in mouse synovium 6 days after AIA induction (n=5; 2 male mice, 3 female mice, 11–13 weeks). Contralateral knee served as control. Haematoxylin counterstain is shown in blue. Boxed areas on the left are shown at higher magnification on the right. Arrow (A) indicates Yap-expressing cells penetrating through the bone into the underlying marrow space. Scale bars: 20 µm. For isotype negative control stainings, see online supplemental figure 10f–h. Graphs indicate protein expression in synovium based on IHC staining intensity, with lines and error bars indicating mean±SD (n=5). P values indicate statistical significance using an unpaired two-tailed t-test. AIA, antigen-induced arthritis; A, articular cartilage; B, bone; Ctgf, connective tissue growth factor; S, synovium; Yap, Yes-associated protein.
Figure 3
Figure 3
Pdgfrα-expressing Gdf5-lineage cells expand during inflammatory arthritis. (A, B) Detection of Pdgfrα-traced cells, marked by expression of CFP, YFP or RFP, in synovium of Pdgfrα-CreER;Confetti mice induced with tamoxifen from 8 weeks of age prior to AIA induction and analysed after 6 days of AIA (n=3; 3 male mice, 14–15 weeks). Contralateral knee served as control. (A) Cells labelled by CFP (blue), YFP (yellow) and RFP (red) in synovium. TO-PRO-3 (TP3) nuclear counterstain is shown in grey. (B) Numbers of CFP, YFP and RFP-labelled cells per mm length of synovium. P values indicate statistical significance based on two-way ANOVA with Tukey’s post-test after log transformation (n=3). (C–F) Gdf5-Cre;Tom;Pdgfrα-H2BGFP mice 6 days after AIA induction (n=5; 2 male mice, 3 female mice, 11–13 weeks). Mice received bromodeoxyuridine (BrdU) to label proliferating cells from arthritis induction until the end. (C, D) Expansion of Tom-labelled Gdf5-lineage cells (red) in synovium during AIA, co-staining for (C) GFP (green), indicative of Pdgfrα expression (arrowheads indicate Tom+GFP+ cells; arrows indicate Tom-GFP+ cells), or (D) the BrdU proliferation label (green; arrowheads indicate Tom+BrdU+ cells). Consecutive tissue sections are shown. For isotype negative control stainings, see online supplemental figure 10i, j. (E) Numbers of Tom-labelled and GFP-labelled cells per mm length of synovium. P values indicate statistical significance based on two-way ANOVA with Tukey’s post-test after log-transformation (n=5). (F) Detection of Yap (red) in GFP-expressing cells (green) in synovial lining (arrowheads) and along the periosteal surface (arrows). Scale bars: 20 µm. For isotype negative control stainings, see online supplemental figure 10k. Lines and error bars on all graphs indicate mean±SD. AIA, antigen-induced arthritis; ANOVA, analysis of variance.
Figure 4
Figure 4
Phenotypic analysis of SF in inflammatory arthritis. (A, B) Freshly isolated cells from knees of adult Gdf5-Cre;Tom;Pdgfrα-H2BGFP mice 6 days after AIA induction (n=6; 5 male mice and one female mouse, 11–14 weeks, pooled data from two experiments) were analysed by flow cytometry for the expression of Pdpn and Thy1 within (A) the Gdf5-lineage Pdgfrα-expressing cells (Tom+GFP+) and (B) the remaining Pdgfrα-expressing cells (Tom-GFP+). The contralateral knees served as controls. Graphs show the percentage of cells expressing Pdpn with or without coexpression of Thy1. P values indicate statistical significance based on unpaired two-tailed t-test after log transformation. For gating strategy and staining controls, see online supplemental figure 2. (C) Yap KD decreased AIA-SF invasiveness through matrigel in a transwell assay. Dots are colour-coded to indicate different experiments (n=5 for Yap expression, n=6 for cell invasion) using cells from three different mice for DsiRNA#1 (circles), and from a fourth mouse for DsiRNA#2 (squares). P values indicate results of two-tailed paired Student’s t-test. (D) YAP/TAZ KD decreased human RA-SF invasiveness through matrigel in a transwell assay. Dots are colour-coded to indicate independent experiments using cells from different donors (n=3). P values indicate results of two-tailed paired Student’s t-test. AIA, antigen-induced arthritis; KD, knockdown; Pdpn, podoplanin; RA, rheumatoid arthritis; SF, synovial fibroblast; Thy1, Thy-1 cell surface antigen.
Figure 5
Figure 5
Ablation of Yap in Gdf5-lineage cells reduces inflammatory arthritis severity. AIA was induced in one knee of Yap WT or Yap cKO mice, with contralateral knee serving as control, and mice were analysed after 3 or 6 days (F), 7 days (B, G) or 9 days (A, C–E, H). See online supplemental table 2 for mouse genotypes, sex, age and exclusions. (A) Yap expression in inflamed synovium detected by IHC. Images show mice with highest arthritis score in their group. Scale bars: 50 µm. P value: unpaired two-tailed t-test after log transformation (WT: n=24; cKO: n=22; five experiments). (B) Yap mRNA expression detected by qRT-PCR in fluorescence-activated cell sorting (FACS)-sorted SF from AIA knees of Yap WT (n=4) and Yap cKO mice (n=3–4; 1 Yap cKO Tom-Pdgfrα+ sorted sample was excluded from analysis due to very low cell yield). P values indicate results of two-way analysis of variance with Tukey’s post-test after log transformation. (C, D) H&E staining and histological scoring of arthritis severity. Images show matched control and AIA knees from mice with arthritis scores (WT: 6.33; cKO: 4.66) close to their group average. Scale bars: 200 µm. P values: Mann-Whitney U test (WT: n=24; cKO: n=22; five experiments). (E) Tom+ Gdf5-lineage cells in synovium detected by IHC. Images are from the same mice as in (C). Scale bars: 50 µm. Graph shows Tom+ cells per millimetre length of synovium. P values: Kruskal-Wallis test with Dunn’s post-test (WT: n=18; cKO: n=22; five experiments). (F) Immunofluorescent detection of BrdU (green) in Tom+ Gdf5-lineage cells (red) in the synovium of Yap cKO mice at 3 (n=5) or 6 days (n=3) after AIA induction. Scale bars: 20 µm. (G) Expression of Mmps and cytokines detected by qRT-PCR in Gdf5-lineage cells FACS-sorted from knees of Yap WT (n=4) or Yap cKO (n=4) mice. P values: unpaired two-tailed t-test after log transformation. (H) TRAP+ cells along the medial and lateral femoral periosteal surface of female mice. P value: unpaired two-tailed t-test (WT: n=15; cKO: n=14; five experiments). Boxed areas in images on the left are shown at higher magnification on the right. For isotype negative control stainings, see online supplemental figure 10e, f, j. For FACS strategy, see online supplemental figure 4. Data on graphs are shown as mean±95% CI (A, D, E, H) or mean±SD (B, G). AIA, antigen-induced arthritis; S, synovium; SF, synovial fibroblast; WT, wild type; Yap, Yes-associated protein.
Figure 6
Figure 6
Inducible ablation of Yap in Pdgfrα-expressing fibroblasts reduces inflammatory arthritis severity. Adult Yapfl/fl (Yap WT) or Pdgfrα-CreER;Yapfl/fl (Yap ciKO) mice received tamoxifen to activate Cre and KO Yap, prior to induction of AIA in one knee, with the contralateral knee serving as control. Histological analysis was performed 9 days after arthritis induction. See online supplemental table 3 for mouse genotypes, sex and age. (A) Yap expression in the inflamed synovium detected by IHC with haematoxylin counterstain. Histological images were selected from the same mice as shown in panel (C). Boxed areas in images on the left are shown at higher magnification on the right. Scale bars: 50 µm. For isotype negative control staining, see online supplemental figure 10f. (B) Yap expression in synovium, based on IHC staining intensity. P value indicates result of two-tailed unpaired t-test (WT: n=9; ciKO n=6; pooled data from two experiments). (C) Synovitis and erosive damage in AIA knees detected by H&E staining. Images show matched control and AIA knees from female mice in the same experiment with arthritis scores (WT: 5.00; ciKO: 2.99) close to the average of their respective groups. Boxed areas in images on the left are shown at higher magnification on the right. Scale bars: 200 µm. (D) Histological assessment of severity of synovial hyperplasia, immune infiltrates, cellular exudate and marginal erosions (all on scale 0–3), and overall arthritis severity (scale 0–12). P values indicate results of Mann-Whitney U test (WT: n=9; ciKO: n=6, pooled data from two experiments). Lines and error bars on all graphs indicate mean±95% CI. AIA, antigen-induced arthritis; S, synovium; WT, wild type; Yap, Yes-associated protein.
Figure 7
Figure 7
IL-6 activates Yap through Jak and drives SF invasion by stimulating Yap–Snail interaction. (A) IL-6 activates Yap. Yap–Tead GFP reporter cells were stimulated with 10 ng/mL TNF-α, 10 ng/mL IL-1β or 20 ng/mL IL-6/sIL6R, and GFP expression was quantified by flow cytometry (n=4–6 experiments). P value: one-way repeated measures ANOVA with Tukey’s post-test, performed on data before normalisation. (B) The Jak inhibitor baricitinib prevents IL-6-induced Yap activation. Yap–Tead GFP reporter cells were treated with IL-6/sIL6R (20 ng/mL) and baricitinib (1 or 2 µM) for 48 hours under vehicle-controlled conditions, and GFP expression was quantified by flow cytometry (n=4 experiments). P values: one-way repeated measures ANOVA with Tukey’s post-test, performed on data before normalisation. (C) Baricitinib prevents IL-6/sIL6R-induced Stat3 phosphorylation. Yap–Tead GFP reporter cells were pretreated for 1 hour with baricitinib (10 µM) and then treated with IL-6/sIL6R (140 ng/mL) for 30 min, as indicated, under vehicle-controlled conditions. Data are representative of n=3 experiments. See online supplemental figure 11 for uncropped Western blot images. (D) IL-6/sIL6R treatment (10 ng/mL) does not affect Yap mRNA expression in AIA-SF after 24 hours. (E) Yap KD prevents the increased AIA-SF invasiveness after IL-6/sIL6R treatment (10 ng/mL) for 48 hours. Dots are colour-coded to indicate five independent experiments using cells from four different mice. P values: one-way repeated measures ANOVA with Tukey’s post-test. (F) Yap KD prevents the increased invasion of AIA-SF induced by Snail overexpression. Dots are colour-coded to indicate four independent experiments using cells from three different mice. P values: one-way repeated measures ANOVA with Tukey’s post-test. (G) Treatment with IL-6/sIL6R (5 ng/mL) for 4 hours increased Yap–Snail complex formation in mouse SF, detected using proximity ligation assay. Transfection with constitutively active YAP-S127A was used as a positive control. Dots are colour-coded to indicate independent experiments using cells from different mice (n=4). P values: repeated measures one-way ANOVA with Dunnet’s post-test. Scale bars: 20 µm. (H) Treatment with IL-6/sIL6R (5 ng/mL) for 4 hours increased YAP–SNAIL complex formation in human SF, detected using proximity ligation assay. Dots are colour-coded to indicate independent experiments using cells from different donors (n=3). P value: two-tailed paired Student’s t-test. Scale bars: 20 µm. Lines and error bars on all graphs indicate mean±SD. ANOVA, analysis of variance; IL, interleukin; KD, knockdown; OE, overexpression; SF, synovial fibroblast; Yap, Yes-associated protein.

References

    1. Smolen JS, Aletaha D, Barton A, et al. . Rheumatoid arthritis. Nat Rev Dis Primers 2018;4:18001. 10.1038/nrdp.2018.1 - DOI - PubMed
    1. Croft AP, Campos J, Jansen K, et al. . Distinct fibroblast subsets drive inflammation and damage in arthritis. Nature 2019;570:246–51. 10.1038/s41586-019-1263-7 - DOI - PMC - PubMed
    1. Rountree RB, Schoor M, Chen H, et al. . BMP receptor signaling is required for postnatal maintenance of articular cartilage. PLoS Biol 2004;2:e355. 10.1371/journal.pbio.0020355 - DOI - PMC - PubMed
    1. Koyama E, Shibukawa Y, Nagayama M, et al. . A distinct cohort of progenitor cells participates in synovial joint and articular cartilage formation during mouse limb skeletogenesis. Dev Biol 2008;316:62–73. 10.1016/j.ydbio.2008.01.012 - DOI - PMC - PubMed
    1. Roelofs AJ, Zupan J, Riemen AHK, et al. . Joint morphogenetic cells in the adult mammalian synovium. Nat Commun 2017;8:15040. 10.1038/ncomms15040 - DOI - PMC - PubMed

Publication types

Substances