. 2021 Nov 29;5(2):e202101119.
doi: 10.26508/lsa.202101119. Print 2022 Feb.

Temporal and sequential order of nonoverlapping gene networks unraveled in mated female Drosophila

Affiliations

Temporal and sequential order of nonoverlapping gene networks unraveled in mated female Drosophila

Claude Pasquier et al. Life Sci Alliance. .

Abstract

In this study, we reanalyzed available datasets of gene expression changes in female Drosophila head induced by mating. Mated females present metabolic phenotypic changes and display behavioral characteristics that are not observed in virgin females, such as repulsion to male sexual aggressiveness, fidelity to food spots selected for oviposition, and restriction to the colonization of new niches. We characterize gene networks that play a role in female brain plasticity after mating using AMINE, a novel algorithm to find dysregulated modules of interacting genes. The uncovered networks of altered genes revealed a strong specificity for each successive period of life span after mating in the female head, with little conservation between them. This finding highlights a temporal order of recruitment of waves of interconnected genes which are apparently transiently modified: the first wave disappears before the emergence of the second wave in a reversible manner and ends with few consolidated gene expression changes at day 20. This analysis might document an extended field of a programmatic control of female phenotypic traits by male seminal fluid.


Conflict of interest statement

The authors declare that they have no conflict of interest.

Figures

Figure 1.
Figure 1.. Volcano plots of differentially expressed genes.
Volcano plots showing the significance of the differential expression of genes between mated and virgin flies at day 1, 4, and 20. Log2 FC is plotted on the x-axis, and adjusted P-values are plotted on the y-axis. Genes with a variation of at least a factor of 1.25 (i.e., a log2-fold change greater than 0.32 or less than −0.32) and an adjusted P-value of 0.05 or less are considered differentially expressed and are represented in red. Triangles correspond to genes with a too-high adjusted P-value to be displayed on the plot or a P-value equal to NA. Genes appearing in the three plots are listed in Tables S1–S3. (A) Mated versus virgin females at day 1. The analysis highlighted 625 differentially expressed genes identified with high confidence (most of these genes are associated with an adjusted P-value well below 0.05). (B) Mated versus virgin females at day 4. Eighty-two genes are considered differentially expressed. Important variations were found between replicates because most of the adjusted P-values were higher than 0.1, as seen in the panel. (C) Mated versus virgin females at day 20. At this time period, the large variations between the quantifications performed with the different replicates only allowed the identification of six differentially expressed genes.
Figure 2.
Figure 2.. Line graph showing the evolution of log2 FC values over the three time points (days 1, 4, and 20) for genes that were identified as differentially expressed.
(A) Evolution of log2 FC values for all genes identified as differentially expressed at day 1. The 11 colored lines correspond to the genes that were also differentially expressed at day 4 or 20. (B) Evolution of log2 FC values for genes identified as differentially expressed at day 4. The colored lines represent the genes that were also differentially expressed at any of the other time points. (C) Evolution of log2 FC values for genes identified as differentially expressed at day 20. The blue line illustrates the log2 FC value of PPO1, which was the only gene that was also overexpressed at day 1. (C, D) Cropped version of the panel shown in (C), which allows better differentiation among the different colored lines.
Figure 3.
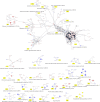
Figure 3.. Representation of active modules identified at day 1.
On the networks, the nodes correspond to genes, and the edges correspond to interactions reported in the String database with an evidence score ≥0.7. The number associated with each module corresponds to the module ID specified in Table S6. Each module is annotated with a representative enrichment. The complete lists of the enrichments of all the modules are shown in Table S9. The node colors represent the log2 FC values of the corresponding gene on a scale varying from blue (for the most underexpressed genes) to red (for the most overexpressed genes). The diamond-shaped nodes represent genes that are considered differentially expressed based on the DESeq2 method.
Figure 4.
Figure 4.. Representation of active modules identified at day 4.
On the networks, the nodes correspond to genes, and the edges correspond to interactions reported in the String database with an evidence score ≥0.7. The number associated with each module corresponds to the module ID specified in Table S7. Each module is annotated with a representative enrichment (when available). The complete lists of the enrichments of all the modules are shown in Table S10. The node colors represent the log2 FC values of the corresponding gene on a scale varying from blue (for the most underexpressed genes) to red (for the most overexpressed genes). The diamond-shaped nodes represent genes that are considered differentially expressed based on the DESeq2 method.
Figure 5.
Figure 5.. Representation of active modules identified at day 20.
On the networks, the nodes correspond to genes, and the edges correspond to interactions reported in the String database with an evidence score ≥0.7. The number associated with each module corresponds to the module ID specified in Table S8. Each module is annotated with a representative enrichment. The complete lists of the enrichments of all the modules are shown in Table S11. The node colors represent the log2 FC values of the corresponding gene on a scale varying from blue (for the most underexpressed genes) to red (for the most overexpressed genes). The diamond-shaped nodes represent genes that are considered differentially expressed based on the DESeq2 method.
Figure 6.
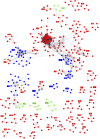
Figure 6.. Union of the active modules identified at each time point.
The network combines the active modules identified at days 1 (in blue), 4 (in red), and 20 (in green). The module numbers correspond to those specified in Figs 3–5.
Figure 7.
Figure 7.. Interactions between modules at different time points.
Visualization of the intermodule interactions in the form of a network in which each node is a module and each link represents an interaction between one or more genes of the corresponding modules. The modules are labeled with the time point followed by the number of modules. Thus, the module name “d4_m1” refers to module number 1 identified at day 4.
Figure S1.
Figure S1.. Euler diagram illustrating the overlap of the five modules identified by JActiveModules.
On the diagram, each area represents one module found by JActiveModules. The sizes of the areas and the overlaps correspond to the sizes of the data sets. The figure was generated using the online tool nVenn, accessible at http://degradome.uniovi.es/cgi-bin/nVenn/nvenn.cgi (Pérez-Silva et al, 2018).
Figure S2.
Figure S2.. Euler diagram illustrating the overlap of the enrichment terms corresponding to the modules identified by AMINE, ClustEx2, JActiveModules, DIAMOnD, and GiGA.
On the diagram, each area represents GO Biological Process enrichment for the modules revealed by the five methods. The sizes of the areas and the overlaps correspond to the sizes of the data sets. The figure was generated using the online tool nVenn, accessible at http://degradome.uniovi.es/cgi-bin/nVenn/nvenn.cgi (Pérez-Silva et al, 2018).
Figure S3.
Figure S3.. Euler diagram illustrating the overlap of the total of genes considered as important by several methods.
On the diagram, each area represents the set of genes identified. The sizes of the circles and the overlaps correspond to the sizes of the data sets. The figure was generated using the online tool nVenn, accessible at http://degradome.uniovi.es/cgi-bin/nVenn/nvenn.cgi (Pérez-Silva et al, 2018). (A) Comparison between AMINE, ClustEx2, JActiveModules, DIAMOnD, and GiGA methods. (B) Comparison between the genes detected by the five module detection methods and those identified by differential expression analysis using a P-value less than 0.05 and a log2FC greater than 0.32 or less than −0.32.
Figure S4.
Figure S4.. Euler diagram illustrating the overlap between the genes belonging to modules associated with “chitin-based cuticle development” by AMINE, ClustEx2, JActiveModules, and GiGA.
On the diagram, each area represents the set of genes identified. The sizes of the circles and the overlaps correspond to the sizes of the data sets. The figure was generated using the online tool nVenn, accessible at http://degradome.uniovi.es/cgi-bin/nVenn/nvenn.cgi (Pérez-Silva et al, 2018). (A) Comparison between AMINE, ClustEx2, JActiveModules, and GiGA methods. (B) Comparison between the genes detected by the four module detection methods and those identified by differential expression analysis using a P-value less than 0.05 and a log2FC greater than 0.32 or less than −0.32.
Figure 8.
Figure 8.. Workflow of the AMINE method.
(A) Input data are composed of a table storing the significance of the expression variation of genes between two conditions and a network representing known gene interactions. Gene variations must be provided by the user, whereas data concerning gene interactions are included in the application. (B) Data about gene interactions and gene variations are merged to generate an attributed gene network. (C) Nodes belonging to the attributed gene network are mapped to a low-dimensional space through the use of a biased Node2Vec method. (D) Sets of genes that are both cohesive and differentially expressed are identified in the embedded space by maximizing both the scores of the nodes and the cosine distance between the vectors representing the nodes. (E) Each gene from the gene network is associated with the cluster that maximizes the z-score. (F) Redundancy in the content of modules is ruled out by combining sets of nodes obtained in the previous step while ensuring that the result remains spatially cohesive.

Similar articles

Cited by

References

    1. Alfonso-Parra C, Ahmed-Braimah YH, Degner EC, Avila FW, Villarreal SM, Pleiss JA, Wolfner MF, Harrington LC (2016) Mating-induced transcriptome changes in the reproductive tract of female Aedes aegypti. PLoS Negl Trop Dis 10: e0004451. 10.1371/journal.pntd.0004451 - DOI - PMC - PubMed
    1. Ameku T, Niwa R (2016) Mating-induced increase in germline stem cells via the neuroendocrine system in female Drosophila. PLoS Genet 12: e1006123. 10.1371/journal.pgen.1006123 - DOI - PMC - PubMed
    1. Amgalan B, Lee H (2014) WMAXC: A weighted maximum clique method for identifying condition-specific sub-network. PLoS One 9: e104993. 10.1371/journal.pone.0104993 - DOI - PMC - PubMed
    1. Avila FW, Sirot LK, Laflamme BA, Rubinstein CD, Wolfner MF (2011) Insect seminal fluid proteins: Identification and function. Annu Rev Entomol 56: 21–40. 10.1146/annurev-ento-120709-144823 - DOI - PMC - PubMed
    1. Basha O, Mauer O, Simonovsky E, Shpringer R, Yeger-Lotem E (2019) ResponseNet v.3: Revealing signaling and regulatory pathways connecting your proteins and genes across human tissues. Nucleic Acids Res 47: W242–W247. 10.1093/nar/gkz421 - DOI - PMC - PubMed

Publication types

Substances

LinkOut - more resources