. 2021 Nov 29;12(12):1115.
doi: 10.1038/s41419-021-04400-5.

MICU3 regulates mitochondrial Ca2+-dependent antioxidant response in skeletal muscle aging

Affiliations

MICU3 regulates mitochondrial Ca2+-dependent antioxidant response in skeletal muscle aging

Yun-Fei Yang et al. Cell Death Dis. .

Abstract

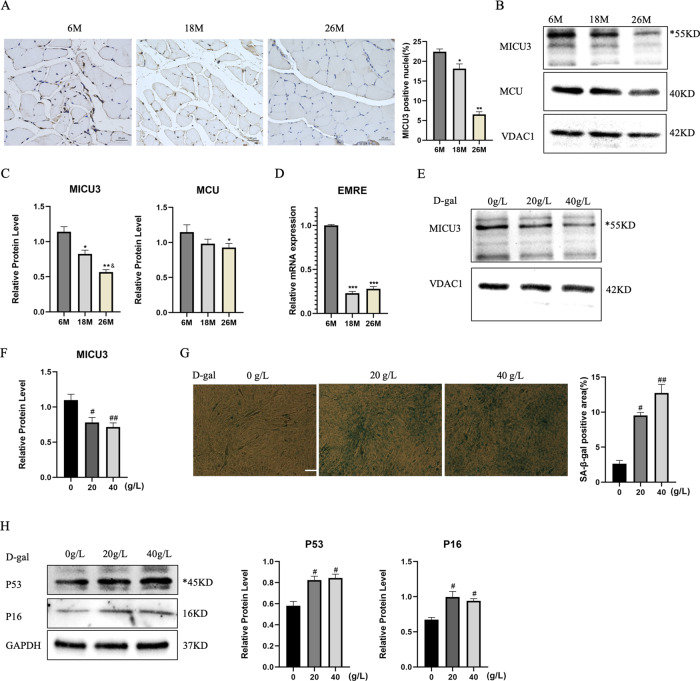
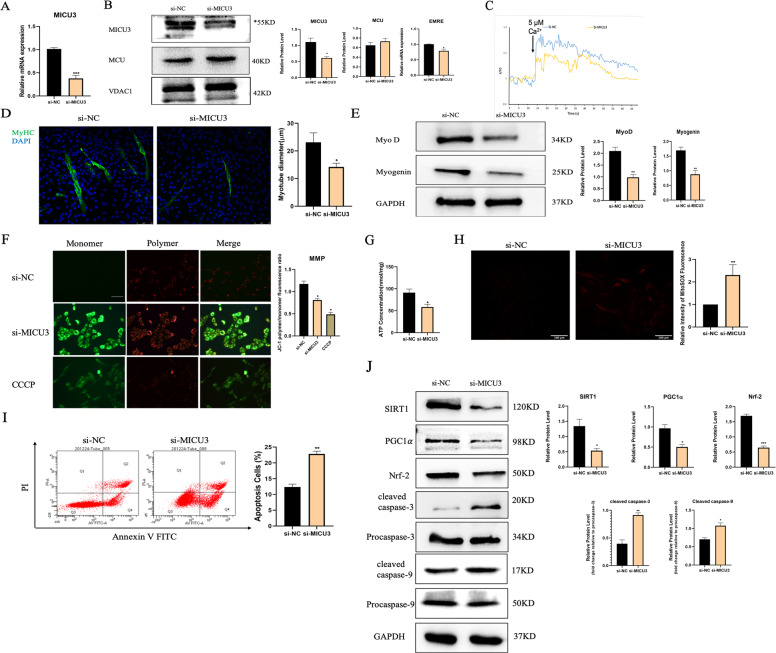
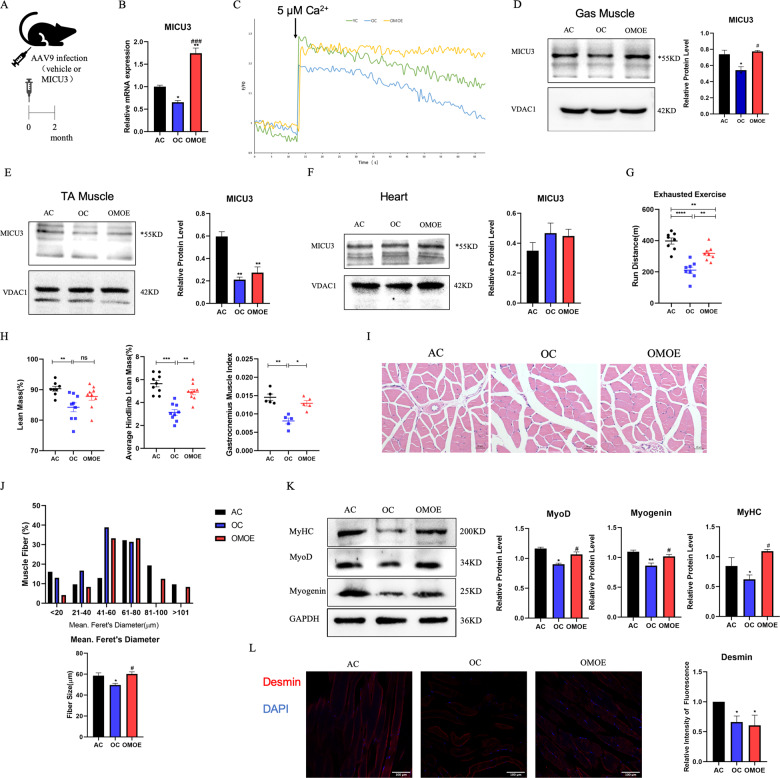
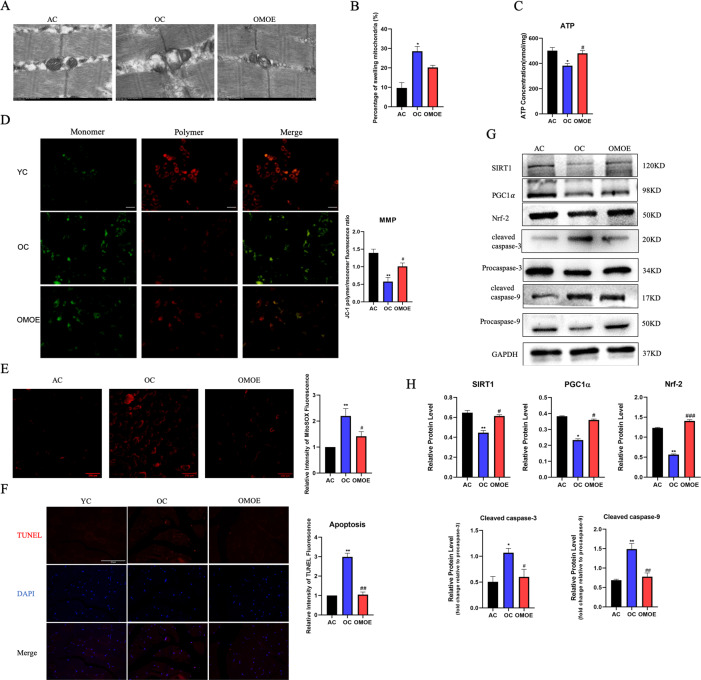
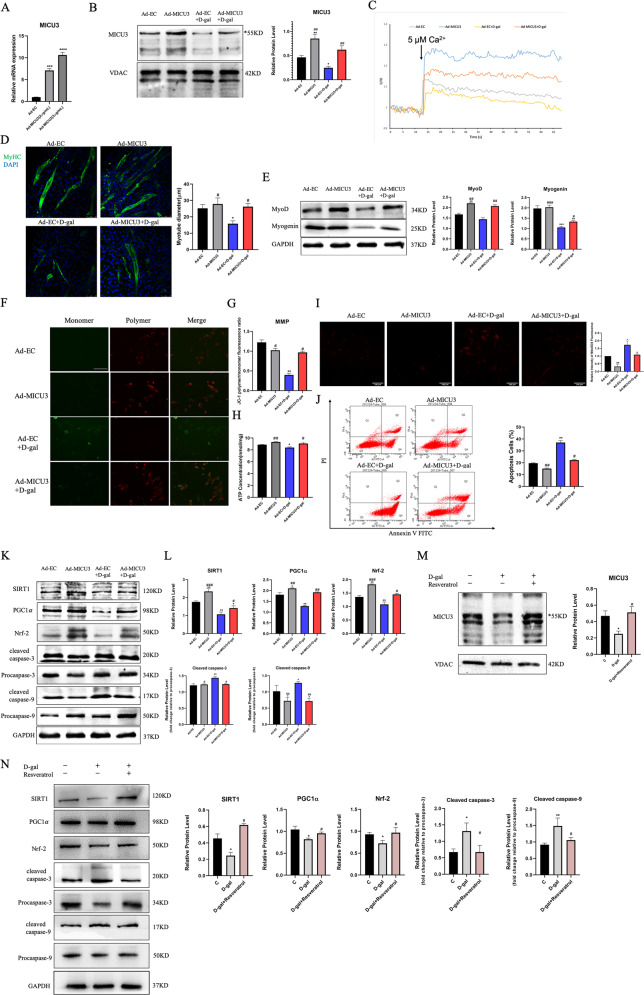
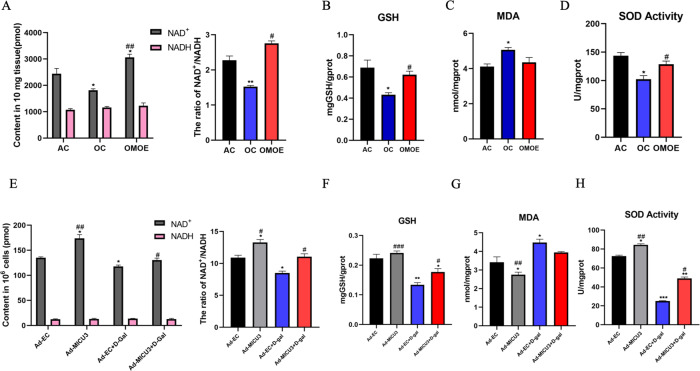
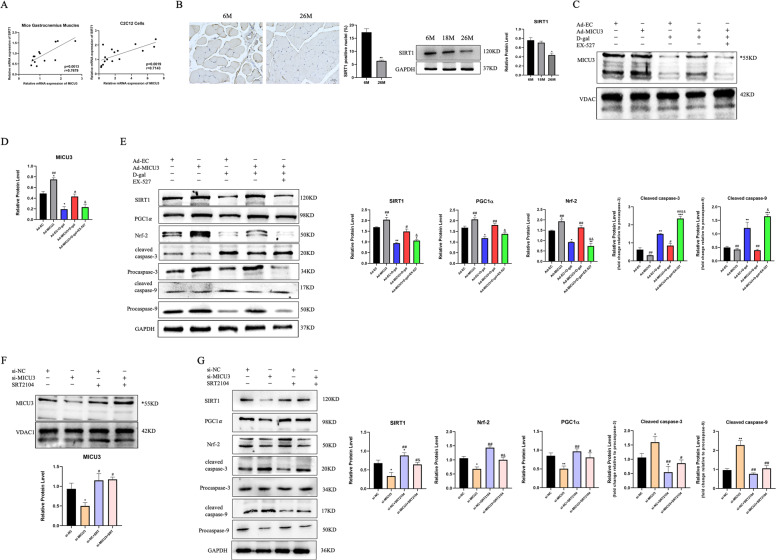
Age-related loss of skeletal muscle mass and function, termed sarcopenia, could impair the quality of life in the elderly. The mechanisms involved in skeletal muscle aging are intricate and largely unknown. However, more and more evidence demonstrated that mitochondrial dysfunction and apoptosis also play an important role in skeletal muscle aging. Recent studies have shown that mitochondrial calcium uniporter (MCU)-mediated mitochondrial calcium affects skeletal muscle mass and function by affecting mitochondrial function. During aging, we observed downregulated expression of mitochondrial calcium uptake family member3 (MICU3) in skeletal muscle, a regulator of MCU, which resulted in a significant reduction in mitochondrial calcium uptake. However, the role of MICU3 in skeletal muscle aging remains poorly understood. Therefore, we investigated the effect of MICU3 on the skeletal muscle of aged mice and senescent C2C12 cells induced by D-gal. Downregulation of MICU3 was associated with decreased myogenesis but increased oxidative stress and apoptosis. Reconstitution of MICU3 enhanced antioxidants, prevented the accumulation of mitochondrial ROS, decreased apoptosis, and increased myogenesis. These findings indicate that MICU3 might promote mitochondrial Ca2+ homeostasis and function, attenuate oxidative stress and apoptosis, and restore skeletal muscle mass and function. Therefore, MICU3 may be a potential therapeutic target in skeletal muscle aging.


Conflict of interest statement

The authors declare no competing interests.

Figures

Fig. 1
Fig. 1. MICU3 was downregulated in skeletal muscle from old mice and senescent C2C12 cells induced by d-gal.
A IHC for MICU3 in mice gastrocnemius muscle (magnification ×400; scale bar = 20 μm). B, C Western blot and quantification of MICU3 and MCU protein level in mice gastrocnemius muscle. VDAC was used as the loading control. *indicates target bands. D The mRNA level of EMRE in mice gastrocnemius muscle. E, F Western blot and quantification for MICU3 in C2C12 cells. VDAC was used as the loading control. *indicates target bands. G SA-β-gal staining and quantification for C2C12 cells (scale bar = 50 μm). H Western blot and quantification for P16 and P53 in C2C12 cells. *indicates target bands. GAPDH was used as the loading control. Data were expressed as mean ± SEM, and data were analyzed using a one-way ANOVA. *p < 0.05 vs. the 6 M group; &p < 0.05, vs. The 18M group; n = 3 mice in each group; #p < 0.05, vs. the 0 g/L group; n = 3.
Fig. 2
Fig. 2. Downregulation of MICU3 in C2C12 cells induced impairment of differentiation capacity and mitochondrial dysfunction.
A The mRNA level of MICU3 in C2C12 cells. B Western blot and quantification for MICU3 and MCU, and mRNA level of EMRE. VDAC was used as the loading control for western blot, and GAPDH was used as the loading control for RT-PCR. *indicates target bands. C The mitochondrial calcium uptake assay in C2C12 cells. F0 = Initial fluorescence value, F = Arbitrary fluorescence values. D The photo and quantification of myotubes (scale bar = 75 μm). E Western blot and quantification for MyoD, and Myogenin. GAPDH was used as the loading control. F The fluorescence staining for JC-1, indicator of mitochondrial membrane potential (scale bar = 100 μm). CCCP was used as a positive control. G The ATP concentration of C2C12 cells. H The fluorescence staining for MitoSOX, indicator of mitochondrial ROS (scale bar = 100 μm). I Representative pictures of flow cytometry analysis in Annexin V- FITC/PI staining. (J)Western blot and quantification of SIRT1, PGC1α, Nrf-2, cleaved caspase-3, cleaved caspase-9, Procaspase-3, and Procaspase-9. GAPDH was used as the loading control. Data were expressed as means ± SEM, and data were analyzed using t-test and one-way ANOVA. *p < 0.05 vs. the si-NC group; n = 3.
Fig. 3
Fig. 3. Overexpression of MICU3 improved aging mice muscle mass and function.
A Schematic diagram of AAV9 injection. B The mRNA level of MICU3 in mice gastrocnemius muscle. C The mitochondrial calcium uptake assay in primary myoblasts from mice gastrocnemius muscle. DF Western blot and quantification for MICU3 in mice gastrocnemius muscle, tibialis anterior (TA) muscle, and myocardium. VDAC was used as the loading control. *indicates target bands. G The furthest running distance in exhausted exercise. H Lean mass (%), defined as lean mass/body weight. Average hindlimb lean mass (%), defined as average hindlimb lean mass/body weight. Gastrocnemius muscle index (GMI), defined as the gastrocnemius wet weight/body weight. I, J Myofibers were stained with H&E (magnification ×400; scale bar = 20 μm), and the Feret’s diameter of the gastrocnemius muscle fibers was measured by ImageProPlus software. K Western blot for MyoD, Myogenin and MyHC. GAPDH was used as the loading control. L The immunofluorescence of Desmin in mice gastrocnemius muscle. (magnification = ×200; scale bar = 100 μm). Data were expressed as means ± SEM, and data were analyzed using a one-way ANOVA. *p < 0.05 vs. the AC group; #p < 0.05 vs. the OC group; n = 3 mice per group for western blot and RT-PCR analyses; n = 4 for H&E staining; n = 5 for GMI measurements; n = 9 for dual-energy X-ray absorptiometry (DEXA) measurements.
Fig. 4
Fig. 4. Overexpression of MICU3 improved mitochondrial function in aging mice by reducing mitoROS-mediated apoptosis.
A, B Representative mitochondria were observed by transmission electron micrographs (magnification ×20,000; scale bar = 500 nm). C The ATP concentration in mice gastrocnemius muscle. D The JC-1 staining of mice primary myoblasts (scale bar = 100 μm). E The fluorescence staining and quantification of MitoSOX in mice gastrocnemius muscle (magnification ×200; scale bar = 100 μm). F The myofibers were stained with TUNEL, and the fluorescence intensity was measured by ImageJ software (magnification ×400; scale bar = 50 μm). G, H Western blot and quantification of SIRT1, PGC1α, Nrf-2, cleaved caspase-3, cleaved caspase-9, Procaspase-3, and Procaspase-9. GAPDH was used as the loading control. Data were expressed as means ± SEM, and data were analyzed using one-way ANOVA. *p < 0.05 vs. the AC group; #p < 0.05 vs. the OC group; n = 3–4 in each group.
Fig. 5
Fig. 5. MICU3 alleviated differentiation capacity impairment and mitochondrial dysfunction in D-gal-treated C2C12 cells.
A The mRNA level of MICU3 in C2C12 cells. B Western blot and quantification for MICU3 in C2C12 cells. VDAC was used as the loading control. *indicates target bands. C The mitochondrial calcium uptake assay in C2C12 cells. D The photo and quantification of myotubes (magnification = ×200; scale bar = 75 μm). E Western blot for MyoD and Myogenin. GAPDH was used as the loading control. F, G The JC-1 staining of C2C12 cells (scale bar = 100 μm). H The ATP concentration in C2C12 cells. I The fluorescence staining for MitoSOX (magnification = ×200; scale bar = 100 μm). J Representative pictures of flow cytometry analysis in Annexin V- FITC/PI staining. K, L Western blot for SIRT1, PGC1α, Nrf-2, cleaved caspase-3, cleaved caspase-9, Procaspase-3, and Procaspase-9. GAPDH was used as the loading control. Data were expressed as means ± SEM, and data were analyzed using one-way ANOVA and two-way ANOVA. *p < 0.05 vs. the Ad-EC group; #p < 0.05 vs. the Ad-EC + d-gal group; n = 3. M Western blot and quantification for MICU3 in C2C12 cells treated with d-gal and resveratrol. VDAC was used as the loading control. *indicates target bands. N Western blot for SIRT1, PGC1α, Nrf-2, cleaved caspase-3, cleaved caspase-9, Procaspase-3, and Procaspase-9. GAPDH was used as the loading control. Data were expressed as means ± SEM, and data were analyzed using one-way ANOVA. *p < 0.05 vs. The C (d-gal = 0 g/L) group; #p < 0.05 vs. the d-gal (d-gal = 20 g/L) group; n = 3.
Fig. 6
Fig. 6. MICU3-mediated mitochondrial Ca2+-enhanced antioxidant effect.
A NAD+, NADH contents, and the ratio of NAD+ and NADH in mice gastrocnemius muscle. B The GSH contents in mice gastrocnemius muscle. C The MDA contents in mice gastrocnemius muscle. D The activity of SOD in mice gastrocnemius muscle. *p < 0.05 vs. the AC group; #p < 0.05 vs. the OC group; n = 3 mice in each group. E NAD+, NADH contents, and the ratio of NAD+ and NADH in C2C12 cells. F The GSH contents in C2C12 cells. G The MDA contents in C2C12 cells. H The activity of SOD in C2C12 cells. *p < 0.05 vs. the Ad-EC group; #p < 0.05 vs. the Ad-EC + d-gal group; n = 3. Data were expressed as means ± SEM, and data were analyzed using a one-way ANOVA.
Fig. 7
Fig. 7. SIRT1 plays a critical role in the effect of MICU3.
A Correlation graphs between the mRNA expression of MICU3 and SIRT1. B IHC and western blot for SIRT1 in mice from different age groups (magnification ×400; scale bar = 20 μm, *p < 0.05 vs. the 6M group; n = 3). C, D Western blot and quantification of MICU3. VDAC was used as the loading control. *indicates target bands. E Western blot and quantification of SIRT1, PGC1α, Nrf-2, cleaved caspase-3, cleaved caspase-9, Procaspase-3, and Procaspase-9. GAPDH was used as the loading control. (*p < 0.05 vs. the Ad-EC group; #p < 0.05 vs. the Ad-EC + d-gal group; &p < 0.05 vs. the Ad-MICU3 + d-gal group; n = 3). F Western blot and quantification of MICU3. VDAC was used as the loading control. *indicates target bands. G Western blot and quantification of SIRT1, PGC1α, Nrf-2, cleaved caspase-3, cleaved caspase-9, Procaspase-3, and Procaspase-9. GAPDH was used as the loading control. (*p < 0.05 vs. the si-NC group; #p < 0.05 vs. the si- MICU3 group; &p < 0.05 vs. the si-NC + SRT2104 group; n = 3). Data were expressed as means ± SEM, and data were analyzed using a one-way ANOVA.

Similar articles

Cited by

References

    1. McKendry J, Currier BS, Lim C, Mcleod JC, Thomas Aaron CQ, Phillips Stuart M. Nutritional supplements to support resistance exercise in countering the sarcopenia of aging. Nutrients. 2020;12:2057. - PMC - PubMed
    1. Cruz-Jentoft AJ, Sayer AA. Sarcopenia. Lancet. 2019;393:2636–46. - PubMed
    1. Funamizu T, Nagatomo Y, Saji M, Iguchi N, Daida H, Yoshikawa T. Low muscle mass assessed by psoas muscle area is associated with clinical adverse events in elderly patients with heart failure. PLoS ONE. 2021;16:e0247140. - PMC - PubMed
    1. Campanario S, Ramírez-Pardo I, Hong X, Isern J, Munoz-Canoves P. Assessing autophagy in muscle stem cells. Front Cell Dev Biol. 2020;8:620409. - PMC - PubMed
    1. Mankhong S, Kim S, Moon S, Kwak H, Park D, Kang J. Experimental models of sarcopenia: bridging molecular mechanism and therapeutic strategy. Cells. 2020;9:1385. - PMC - PubMed

Publication types