. 2021 Nov 29;12(1):6965.
doi: 10.1038/s41467-021-27037-6.

Multi-species host range of staphylococcal phages isolated from wastewater

Affiliations

Multi-species host range of staphylococcal phages isolated from wastewater

Pauline C Göller et al. Nat Commun. .

Abstract

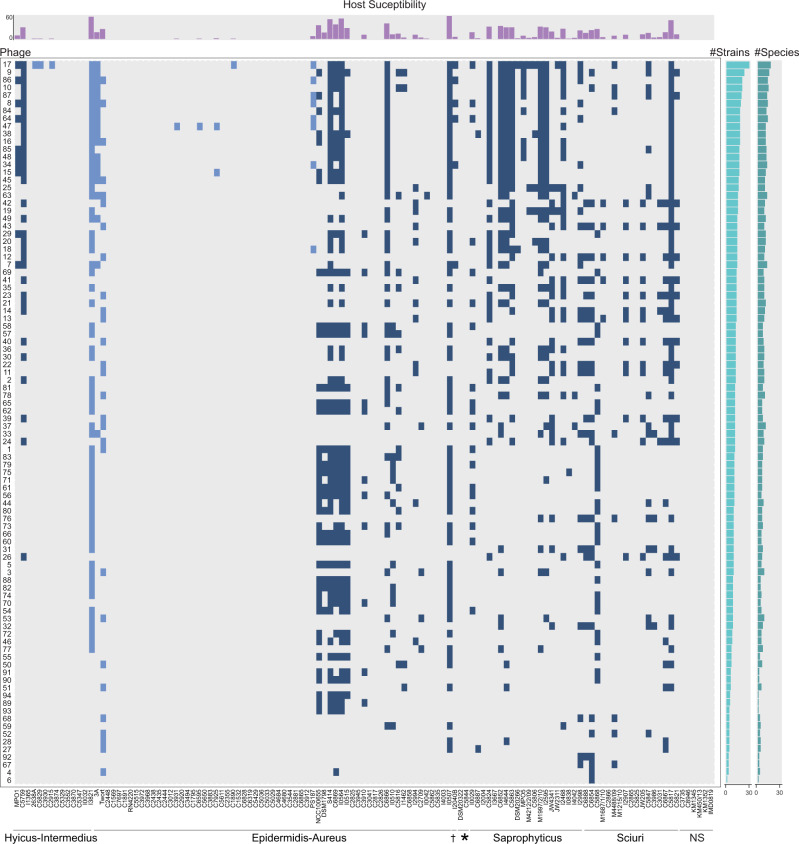
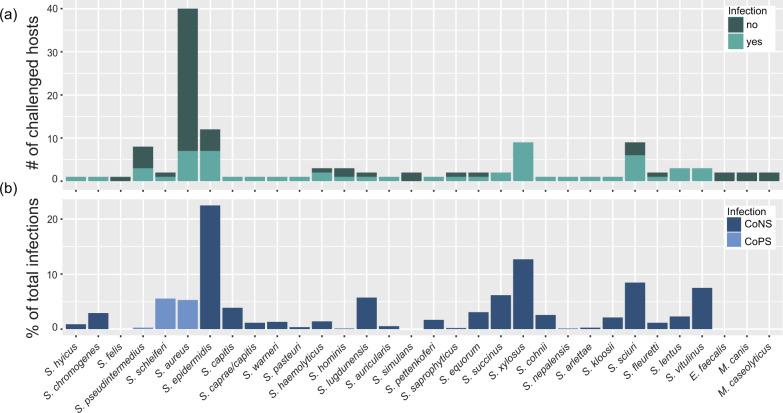
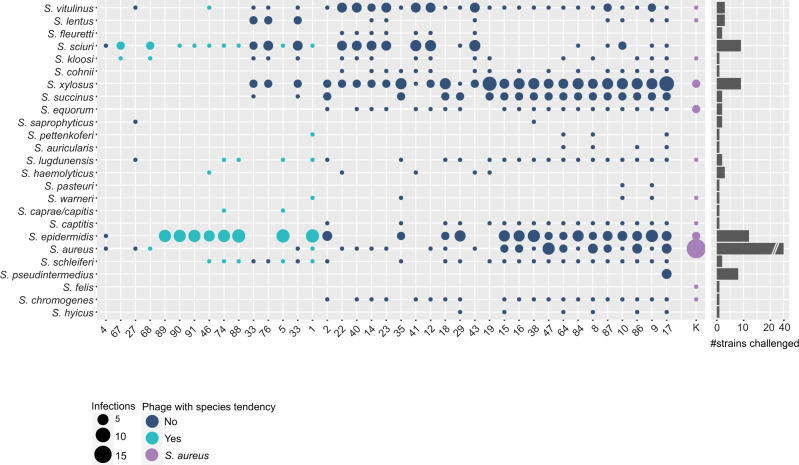
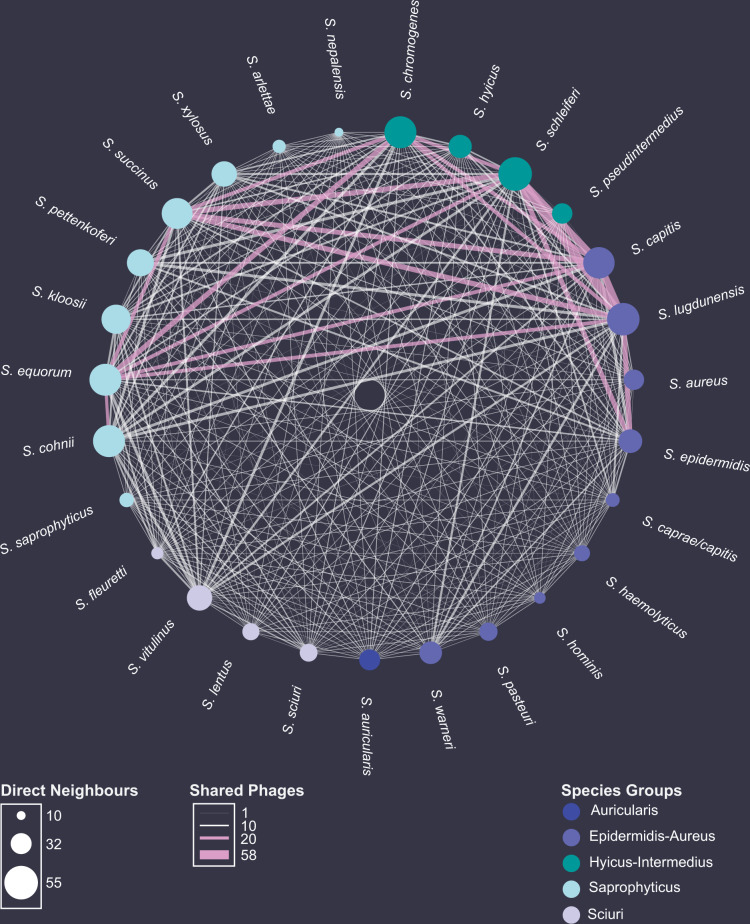
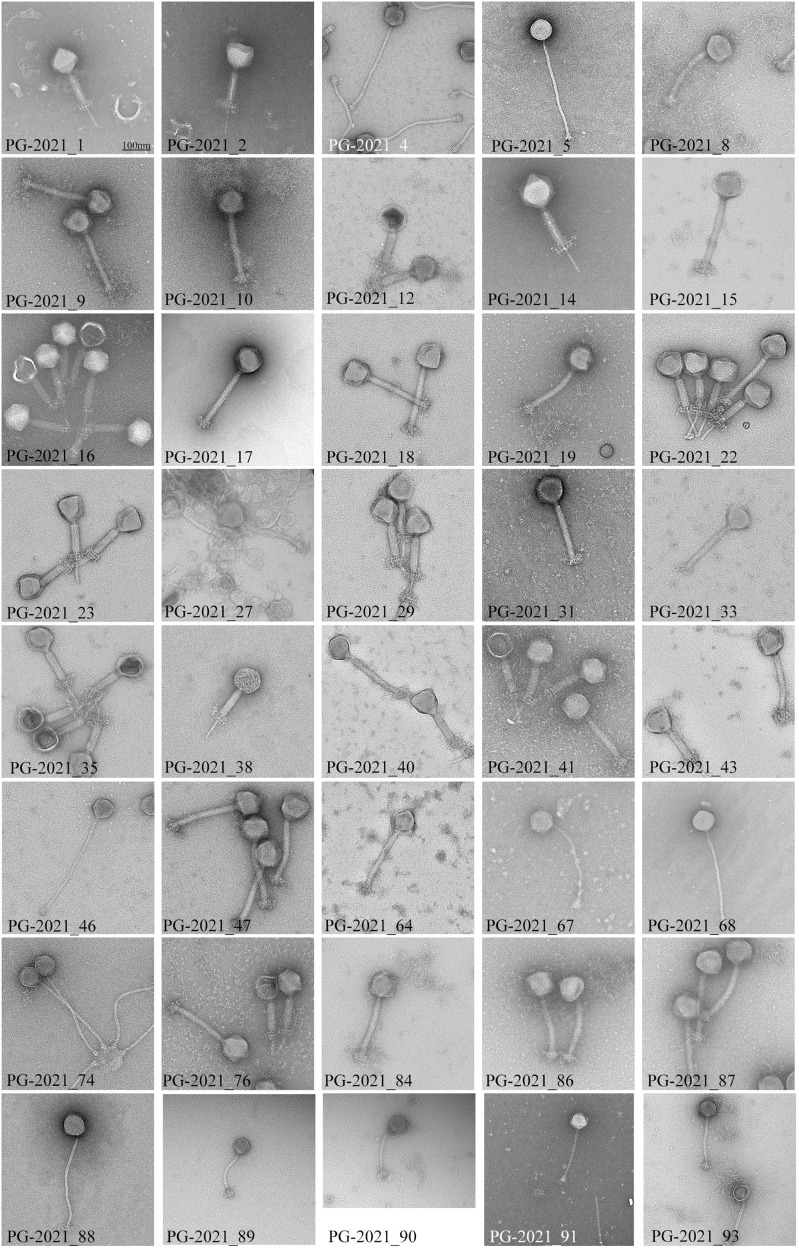
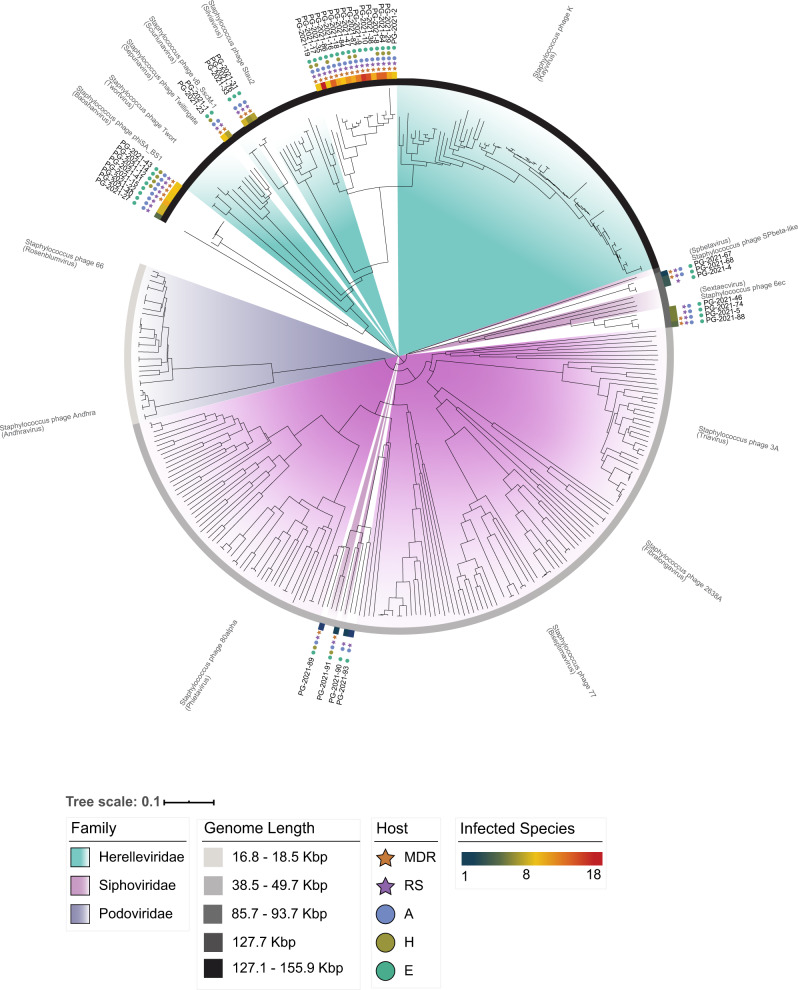
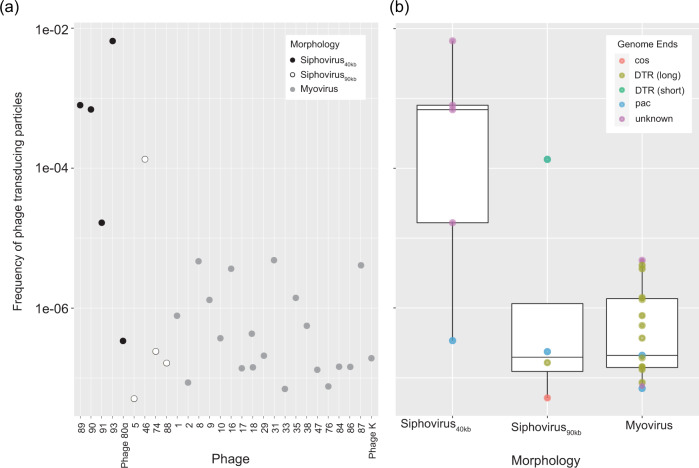
The host range of bacteriophages defines their impact on bacterial communities and genome diversity. Here, we characterize 94 novel staphylococcal phages from wastewater and establish their host range on a diversified panel of 117 staphylococci from 29 species. Using this high-resolution phage-bacteria interaction matrix, we unveil a multi-species host range as a dominant trait of the isolated staphylococcal phages. Phage genome sequencing shows this pattern to prevail irrespective of taxonomy. Network analysis between phage-infected bacteria reveals that hosts from multiple species, ecosystems, and drug-resistance phenotypes share numerous phages. Lastly, we show that phages throughout this network can package foreign genetic material enclosing an antibiotic resistance marker at various frequencies. Our findings indicate a weak host specialism of the tested phages, and therefore their potential to promote horizontal gene transfer in this environment.


Conflict of interest statement

The authors declare no competing interests.

Figures

Fig. 1
Fig. 1. Staphylococcal phage-bacteria incidence matrix.
Bacterial lawns of 123 hosts from 32 species were challenged with 94 different staphylococcal phages from wastewater and phage K. Phages on the y-axis are sorted from broad host range to narrow. Bacterial hosts in columns are sorted after cluster-groups and subdivided species as established in. Dagger: Cluster-group Auricularis. Asterisk: cluster-group Simulans. NS: Non-Staphylococcus hosts. Each blue-colored square of the incidence matrix corresponds to a phage-host infection where single plaques were visible. Squares in dark blue indicate infections on CoNS and squares in light blue on CoPS. The phage permissiveness for each host is indicated in the host susceptibility bar chart on top of the incidence matrix, which represents the number of phages infecting a strain. The two bar charts on the right indicate the total number of strains (number of strains, left) and species (number of species, right) a phage infected. The incidence matrix has a diameter of six and a density of 0.1 (=1135/11562). Phages are abbreviated with their final unique numerical identifier (PG-2021_*). Source data are provided as a Source Data file.
Fig. 2
Fig. 2. Phage infections on staphylococcal species.
Species challenged in the phage-bacteria interaction matrix are shown on the x-axis and sorted after the established Staphylococcus species groups. a For each species, the number of phage resistant and susceptible strains are depicted. b Phage infections on each respective species were plotted as a percentage of the total infections detected in the interaction matrix. CoNS coagulase-negative staphylococci, CoPS coagulase-positive staphylococci. Source data are provided as a Source Data file.
Fig. 3
Fig. 3. Illustration of the host ranges collapsed on the species level for the 40 sequenced phages.
Phages on the x-axis are sorted from narrow (left) to broad host range (right). Species on the y-axis are sorted after phylogenetic relationship in species groups. A phage host range is depicted as a column, where infection of a staphylococcal species is illustrated using circles. For each respective species, the area of the circle is scaled according to the number of strains a phage can replicate on (scale: 1–15). The total number of strains challenged per species is depicted in the bar-chart on the right. Host ranges on this host array are colored as follows: Phage with species tendency (≥50% of all infections on a single species) in turquoise; phages with no clear species tendency in dark blue; polyvalent phage K in violet. Phages are abbreviated with their final unique numerical identifier (PG-2021_*). Source data are provided as a Source Data file.
Fig. 4
Fig. 4. Species network with phages as coupling links.
Staphylococcal host species are represented as nodes and sorted after cluster affiliation. The area of each node directly correlates with the average number of strain neighbors a species is connected to. The number of shared phages between species is represented as weighted edges. If >20 phages are shared between two staphylococcal species, edges are colored in pink. Source data are provided as a Source Data file.
Fig. 5
Fig. 5. Electron micrographs of the sequenced staphylococcal phages.
Phages were isolated from the wastewater treatment plant inlet, outlet, or by induction of bacterial lysogens. For each phage, at least 10 representative pictures were taken. All pictures are adjusted according to the displayed scale-bar in the top-left picture.
Fig. 6
Fig. 6. Phylogenomic tree of staphylococcal phages.
All published staphylococcal phages are displayed together with the here isolated and sequenced CoNS-infecting viruses. For each phage genus in brackets, a representative phage is indicated. The host range of the here characterized phages is represented as follows: the number of infected species is indicated using a continued color scale; isolation origin, and antimicrobial-resistant phenotype of infected hosts are represented using colored circles and stars, respectively. Phages infect A: hosts isolated from animals, H: hosts isolated from humans, E: hosts isolated from the environment. MDR: host is multidrug resistant. RS: phage infects hosts with antimicrobial-resistant and susceptible phenotypes.
Fig. 7
Fig. 7. Frequency of transducing particles for diverse staphylococcal phages.
a Estimated frequency of transducing particles for each respective phage and corresponding phage morphology. Phages are abbreviated with their final unique numerical identifier (PG-2021_*). b Mean (+ sd) frequencies of transducing particles for each phage morphology, i.e., 40 Kb Siphovirus (n = 5 phages), 90 Kb Siphovirus (n = 4), Myovirus (n = 19). Phage termini were predicted using PhageTerm and are illustrated using colors. DTR: direct terminal repeats. Data are represented as boxplots where the middle line is the median, the lower and upper hinges correspond to the first and third quartiles (the 25th and 75th percentiles), the upper whisker extends from the hinge to the largest value at most than 1.5 X IQR from the hinge (where IQR refers to the range between the first and third quartile) and the lowest whisker extends from the hinge to the smallest value no further than 1.5 X IQR, while data beyond the end of the whiskers are outlying points (b). All datapoints are plotted individually. Source data are provided as a Source Data file.

References

    1. Bernheim A, Sorek R. The pan-immune system of bacteria: antiviral defence as a community resource. Nat. Rev. Microbiol. 2020;18:113–119. - PubMed
    1. de Jonge PA, Nobrega FL, Brouns SJJ, Dutilh BE. Molecular and evolutionary determinants of bacteriophage host range. Trends Microbiol. 2019;27:51–63. - PubMed
    1. Munson-McGee JH, et al. A virus or more in (nearly) every cell: ubiquitous networks of virus-host interactions in extreme environments. ISME J. 2018;12:1706–1714. - PMC - PubMed
    1. Dion MB, Oechslin F, Moineau S. Phage diversity, genomics, and phylogeny. Nat. Rev. Microbiol. 2020;18:125–138. - PubMed
    1. Flores CO, Valverde S, Weitz JS. Multi-scale structure and geographic drivers of cross-infection within marine bacteria and phages. ISME J. 2013;7:520–532. - PMC - PubMed

Publication types

MeSH terms