. 2021 Nov 29;11(1):23054.
doi: 10.1038/s41598-021-02270-7.

Selective activation of central thalamic fiber pathway facilitates behavioral performance in healthy non-human primates

Affiliations

Selective activation of central thalamic fiber pathway facilitates behavioral performance in healthy non-human primates

A P Janson et al. Sci Rep. .

Abstract

Central thalamic deep brain stimulation (CT-DBS) is an investigational therapy to treat enduring cognitive dysfunctions in structurally brain injured (SBI) patients. However, the mechanisms of CT-DBS that promote restoration of cognitive functions are unknown, and the heterogeneous etiology and recovery profiles of SBI patients contribute to variable outcomes when using conventional DBS strategies,which may result in off-target effects due to activation of multiple pathways. To disambiguate the effects of stimulation of two adjacent thalamic pathways, we modeled and experimentally compared conventional and novel 'field-shaping' methods of CT-DBS within the central thalamus of healthy non-human primates (NHP) as they performed visuomotor tasks. We show that selective activation of the medial dorsal thalamic tegmental tract (DTTm), but not of the adjacent centromedian-parafascicularis (CM-Pf) pathway, results in robust behavioral facilitation. Our predictive modeling approach in healthy NHPs directly informs ongoing and future clinical investigations of conventional and novel methods of CT-DBS for treating cognitive dysfunctions in SBI patients, for whom no therapy currently exists.


Conflict of interest statement

J.B, A.B, C.B and K.P have applied for a patent based on these results.

Figures

Figure 1
Figure 1
Targeting the central lateral (CL) nucleus and DTTm fiber pathway in healthy NHPs with scaled multi-contact DBS leads. (A) Coronal view of a gradient echo (GRE) image from the NHP MRI-DTI brain atlas used in this study (Calabrese et al., 2015) with cortical across consecutive trials hemisphere. CL is colored in red in the right hemisphere and the schematic outline of the scaled DBS lead (0.84 mm OD) illustrates the trajectory used to target CL and the DTTm fiber pathway. Shown is image 83 (148), − 9.3 mm from the anterior commissure, which can be found here: https://scalablebrainatlas.incf.org/macaque/CBCetal15. APUL—anterior pulvinar; CL—centrolateral thalamic nucleus; Cm-Pf—centromedian thalamic nucleus, lateral part; CM—centromedian thalamic nucleus, medial part; Hip—hippocampus; LGN—lateral geniculate nucleus; MDC—mediodorsal thalamic nucleus, central part; MDD—mediodorsal thalamic nucleus, dorsal part; MDL—mediodorsal thalamic nucleus, lateral part; MDM—mediodorsal thalamic nucleus, medial part; Pf—parafascicularus nucleus; Pu—putamen; R—reticular thalamic nucleus; VLM—ventral lateral thalamic nucleus, medial part; VPL—ventral posterolateral thalamic nucleus; VPM—ventral posteromedial thalamic nucleus; 1—area 1 of cortex (somatosensory); 3a—area 3a of cortex (somatosensory); 3b—area 3b of cortex (somatosensory). (B) Sagittal view of the T2 imaging used for surgical planning of DBS lead trajectories. Here one of the three six contact DBS leads (NuMed Inc.) implanted into the right thalamus of NHP3 is shown. The CL nucleus, shown in red, and the targeted fibers of the DTTm reconstructed from a high-resolution ex vivo dataset (see “Methods” section, Sani et al., 2019), shown in blue, illustrate the pathway of brainstem and anterior forebrain projections of fibers passing through and/or originating in the CL nucleus. The geometry of the CL nucleus spans ~ 5 mm A-P, 4 D-V, 1 mm M-L in the adult NHP.
Figure 2
Figure 2
Central thalamic deep brain stimulation (CT-DBS) of primary ascending arousal system pathway. (A) Post-operative localization of the three DBS leads in the right thalamus of NHP3, with axial (left) and coronal (right) views. The computed tomography artifact of the DBS lead contacts, see insets with individual contact, is fused with the macaque MRI atlas and overlaid with segmentations of the thalamic reticular nucleus (TRN) shown in purple, the central lateral (CL) nucleus in red, and the centromedian-parafascicularus complex (Cm-Pf) in magenta. (B) Reconstruction of the lead locations for the three NHP subjects in the sagittal (left), axial (middle), and coronal (right) planes, along with the thalamic nuclei in A and the two predominant fiber pathways: the medial Dorsal Tegmental Tract (DTTm) shown in blue and the Cm-Pf fibers in orange.
Figure 3
Figure 3
The effects of CT-DBS amplitude on behavioral performance across animals. (A) The performance estimate of NHP1 on the visuomotor reaction time task is shown in the upper plot as a smoothly varying black line and thalamic boundaries shown on the left. Periods of continuous high-frequency CT-DBS are colored according to the significance of the LOR value (p < 0.05); facilitation in green, suppression in red, and gray for no effect. Stimulation amplitudes (0.75–3.0 mA) are noted above each CT-DBS period and the same anode–cathode configuration was used. The lower plot shows the reaction times of correctly performed trials with the same color code; reaction times are in black for CT-DBS OFF periods. (B) Same as in A, but for NHP2 (partial reproduction of Fig. 2C,D in Baker et. al., 2016). In this session, CT-DBS stimulation amplitudes greater than 1.5 mA significantly suppressed performance whereas amplitudes 1.5 mA and below had either no effect or modestly facilitated performance. The same anode–cathode configuration was used throughout. (C) Same as in A and B, but for NHP3. This animal performed a variation of the vigilance task that required more engagement with the task (see “Methods” section); hence, the great number of trials. (D) Reconstruction of the lead locations for each NHP shown in the sagittal plane, along with the CL, CM and TRN nuclei and the fibers of the DTTm are shown in blue. The anode (+) and cathode (−) field-shaping configurations are shown for each.
Figure 4
Figure 4
CT-DBS configuration-dependent effects on behavioral performance. (A) Stimulation configurations across the three animals are grouped by the configurations that had a positive effect on performance (left), no effect (middle), and a negative effect (right) and box plots showing the distribution of log odds ratio (LOR) changes. Each configuration group has significantly different effects on performance compared to the other two groups, with a two-tailed t-test and all p-values < 0.001. (B) The normalized occurrence of significant increases, significant decreases, and no significant change for the same three configurations groups determined by the significance of the LOR score at an α level of 0.05. Configurations in the positive effect group predominantly show significant increases in performance with no occurrence of significant decreases whereas configurations in the negative effect group predominantly show the opposite.
Figure 5
Figure 5
Effective stimulation configurations selectively activate thalamic pathways. (A) Combined lead locations of all three NHPs in one coronal image with the two predominant fiber pathways: the DTTm in blue and the Cm-Pf fibers in orange. (B) Stimulation configurations across all animals grouped by those that had a positive effect on performance (left), no effect (middle), and a negative effect (right) and the normalized percentage of how many configurations in that group activated the fibers in each pathway. 100% means that every configuration in the effect group activated that specific fiber, and 0% means that no configuration in that group activated that specific fiber. Nearly every stimulation configuration in the positive effect group activates nearly every fiber in the DTTm while activating minimal Cm-Pf fibers. The no effect group and the negative effect groups had reduced percentages of configuration activation of the DTTm and increasing activation of the Cm-Pf fibers.
Figure 6
Figure 6
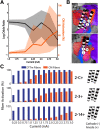
Selective activation of targeted fibers through electrical field-shaping. (A) Anode–cathode configurations that resulted in positive behavioral effects show decreased log odds ratios as the current exceeds 2 mA. This decline in performance coincides with increased Cm-Pf fiber activation. (B) Lead locations and numbering scheme of the active contacts for NHP3 positioned within the DTTm target (blue) and anteromedially to the Cm-Pf fibers (orange). (C) Fiber activation profiles for the DTTm (blue) and Cm-Pf fibers (orange) for three configurations in NHP 3 in which the standard monopolar (2-C +) and bipolar (2–3 +) each show early activation of Cm-Pf fibers. These two configurations were not effective in facilitating behavioral performance despite the cathodic contact being in prime position to activate the DTTm. The third configuration, which utilizes field shaping across multiple leads (2–14 +), was one of the most effective configurations because it provided a larger working range of amplitudes that activated the target DTTm before spreading into the Cm-Pf pathway.

Similar articles

Cited by

References

    1. Schiff ND. Central thalamic contributions to arousal regulation and neurological disorders of consciousness. Ann. N. Y. Acad. Sci. 2008;1129:105–118. - PubMed
    1. Stierwalt JAG, Murray LL. Attention impairment following traumatic brain injury. Semin. Speech Lang. 2002;23:129–138. - PubMed
    1. Stuss DT. Traumatic brain injury. Curr. Opin. Neurol. 2011;24:584–589. - PubMed
    1. Shah SA, Goldin Y, Conte MM, Goldfine AM, Mohamadpour M, Fidali BC, Cicerone K, Schiff ND. Executive attention deficits after traumatic brain injury reflect impaired recruitment of resources. NeuroImage Clin. 2017;14:233–241. - PMC - PubMed
    1. Dikmen SS, Machamer JE, Powell JM, Temkin NR. Outcome 3 to 5 years after moderate to severe traumatic brain injury. Arch. Phys. Med. Rehabil. 2003;84:1449–1457. - PubMed

Publication types