

Connectivity modulations induced by reach&grasp movements: a multidimensional approach
- PMID: 34845265
- PMCID: PMC8630117
- DOI: 10.1038/s41598-021-02458-x
Connectivity modulations induced by reach&grasp movements: a multidimensional approach
Abstract
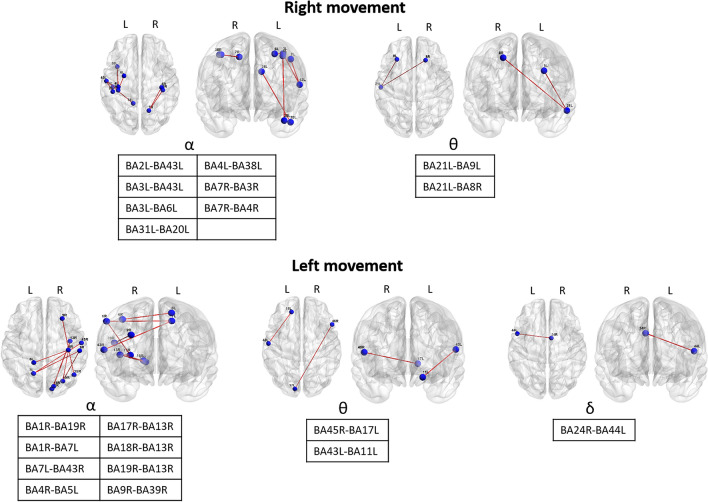
Reach&grasp requires highly coordinated activation of different brain areas. We investigated whether reach&grasp kinematics is associated to EEG-based networks changes. We enrolled 10 healthy subjects. We analyzed the reach&grasp kinematics of 15 reach&grasp movements performed with each upper limb. Simultaneously, we obtained a 64-channel EEG, synchronized with the reach&grasp movement time points. We elaborated EEG signals with EEGLAB 12 in order to obtain event related synchronization/desynchronization (ERS/ERD) and lagged linear coherence between Brodmann areas. Finally, we evaluated network topology via sLORETA software, measuring network local and global efficiency (clustering and path length) and the overall balance (small-worldness). We observed a widespread ERD in α and β bands during reach&grasp, especially in the centro-parietal regions of the hemisphere contralateral to the movement. Regarding functional connectivity, we observed an α lagged linear coherence reduction among Brodmann areas contralateral to the arm involved in the reach&grasp movement. Interestingly, left arm movement determined widespread changes of α lagged linear coherence, specifically among right occipital regions, insular cortex and somatosensory cortex, while the right arm movement exerted a restricted contralateral sensory-motor cortex modulation. Finally, no change between rest and movement was found for clustering, path length and small-worldness. Through a synchronized acquisition, we explored the cortical correlates of the reach&grasp movement. Despite EEG perturbations, suggesting that the non-dominant reach&grasp network has a complex architecture probably linked to the necessity of a higher visual control, the pivotal topological measures of network local and global efficiency remained unaffected.
© 2021. The Author(s).
Conflict of interest statement
The authors declare no competing interests.
Figures


Similar articles
-
Intracerebral ERD/ERS in voluntary movement and in cognitive visuomotor task.Prog Brain Res. 2006;159:311-30. doi: 10.1016/S0079-6123(06)59021-1. Prog Brain Res. 2006. PMID: 17071240
-
Probing the reaching-grasping network in humans through multivoxel pattern decoding.Brain Behav. 2015 Oct 21;5(11):e00412. doi: 10.1002/brb3.412. eCollection 2015 Nov. Brain Behav. 2015. PMID: 26664793 Free PMC article.
-
Mapping the spatio-temporal structure of motor cortical LFP and spiking activities during reach-to-grasp movements.Front Neural Circuits. 2013 Mar 27;7:48. doi: 10.3389/fncir.2013.00048. eCollection 2013. Front Neural Circuits. 2013. PMID: 23543888 Free PMC article.
-
On the Neurocircuitry of Grasping: The influence of action intent on kinematic asymmetries in reach-to-grasp actions.Atten Percept Psychophys. 2019 Oct;81(7):2217-2236. doi: 10.3758/s13414-019-01805-5. Atten Percept Psychophys. 2019. PMID: 31290131 Review.
-
The contribution of the reach and the grasp to shaping brain and behaviour.Can J Exp Psychol. 2014 Dec;68(4):223-35. doi: 10.1037/cep0000042. Can J Exp Psychol. 2014. PMID: 25528562 Review.
Cited by
-
A study on the difference between functional connectivity in elbow flexion and extension according to object weight.Medicine (Baltimore). 2025 Mar 14;104(11):e41781. doi: 10.1097/MD.0000000000041781. Medicine (Baltimore). 2025. PMID: 40101030 Free PMC article.
-
Modulations of Cortical Power and Connectivity in Alpha and Beta Bands during the Preparation of Reaching Movements.Sensors (Basel). 2023 Mar 28;23(7):3530. doi: 10.3390/s23073530. Sensors (Basel). 2023. PMID: 37050590 Free PMC article.
-
iTBS over the left hV6A enhances PPC-PPC functional connectivity during reaching tasks: an EEG study.Front Neurosci. 2025 Mar 26;19:1536308. doi: 10.3389/fnins.2025.1536308. eCollection 2025. Front Neurosci. 2025. PMID: 40242457 Free PMC article.
-
Regular cannabis use alters the neural dynamics serving complex motor control.Hum Brain Mapp. 2023 Dec 15;44(18):6511-6522. doi: 10.1002/hbm.26527. Epub 2023 Nov 13. Hum Brain Mapp. 2023. PMID: 37955378 Free PMC article.
References
-
- Fattori P, Breveglieri R, Amoroso K, Galletti C. Evidence for both reaching and grasping activity in the medial parieto-occipital cortex of the macaque. Eur. J. Neurosci. 2004;20:2457–2466. - PubMed
-
- Caliandro P, et al. Small-world characteristics of cortical connectivity changes in acute stroke. Neurorehabil. Neural Repair. 2017;31:81–94. - PubMed
-
- Vecchio F, et al. Acute cerebellar stroke and middle cerebral artery stroke exert distinctive modifications on functional cortical connectivity: A comparative study via EEG graph theory. Clin. Neurophysiol. 2019;130:997–1007. - PubMed
MeSH terms
LinkOut - more resources
Full Text Sources
