. 2021 Dec;7(12):1571-1578.
doi: 10.1038/s41477-021-01031-8. Epub 2021 Nov 29.

Representation and participation across 20 years of plant genome sequencing

Affiliations

Representation and participation across 20 years of plant genome sequencing

Rose A Marks et al. Nat Plants. 2021 Dec.

Abstract

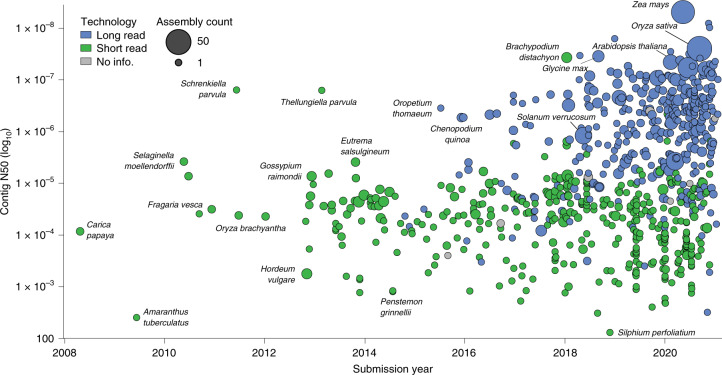
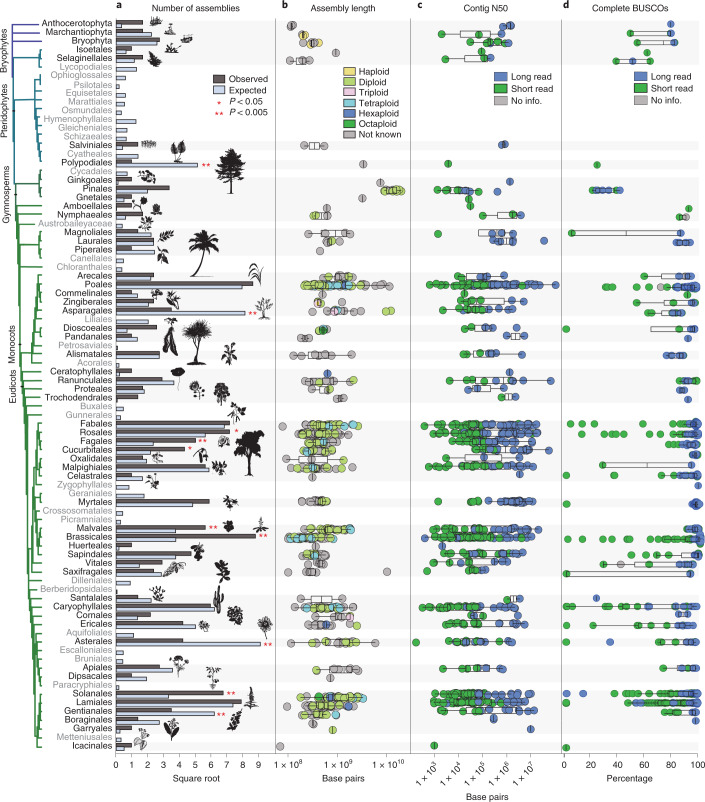
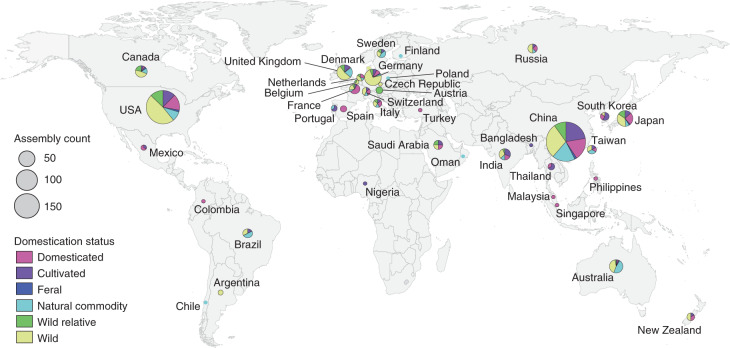
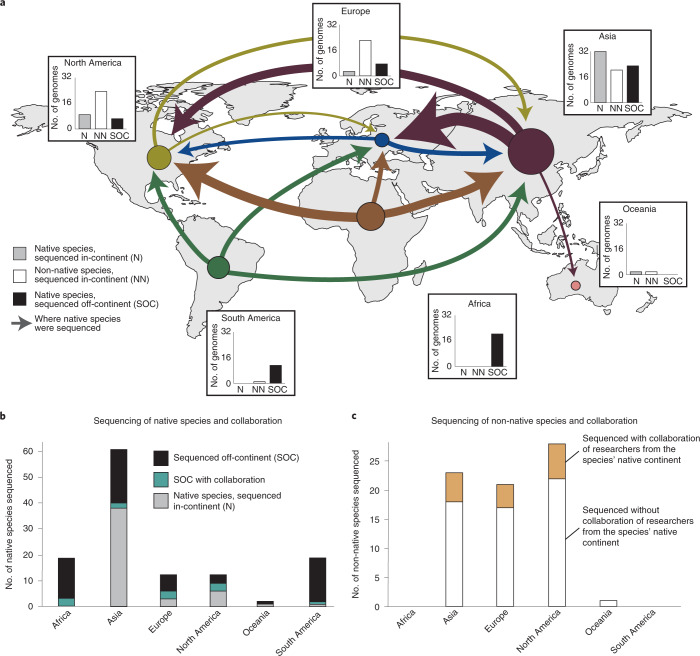
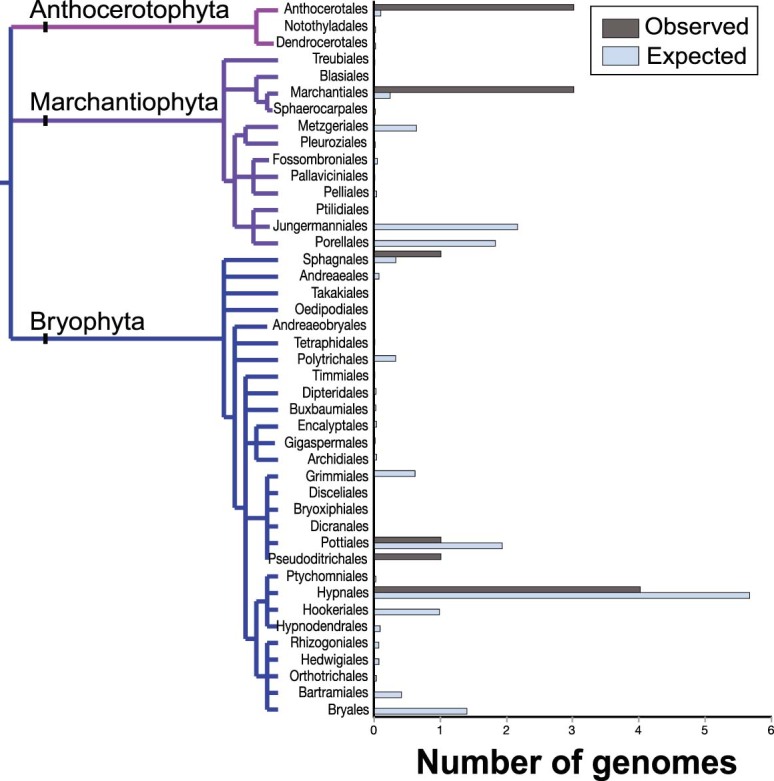
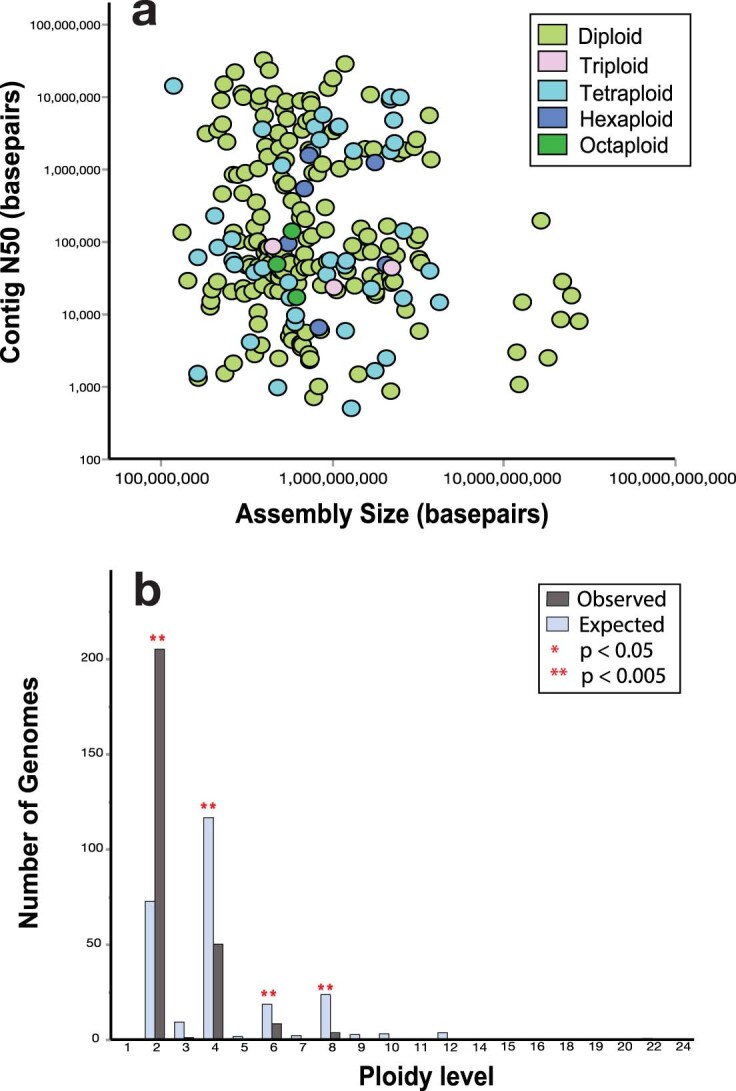
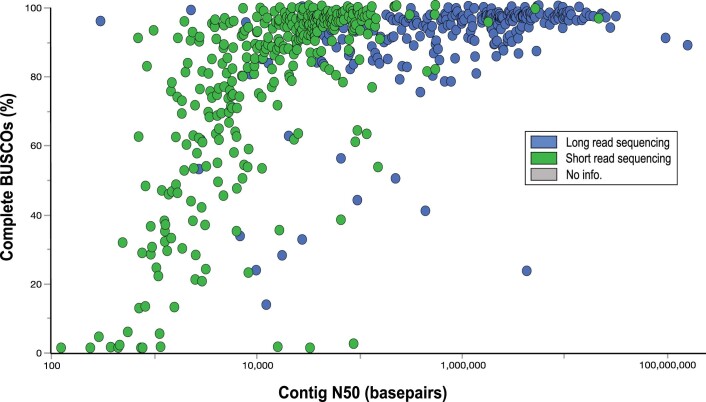
The field of plant genome sequencing has grown rapidly in the past 20 years, leading to increases in the quantity and quality of publicly available genomic resources. The growing wealth of genomic data from an increasingly diverse set of taxa provides unprecedented potential to better understand the genome biology and evolution of land plants. Here we provide a contemporary view of land plant genomics, including analyses on assembly quality, taxonomic distribution of sequenced species and national participation. We show that assembly quality has increased dramatically in recent years, that substantial taxonomic gaps exist and that the field has been dominated by affluent nations in the Global North and China, despite a wide geographic distribution of study species. We identify numerous disconnects between the native range of focal species and the national affiliation of the researchers studying them, which we argue are rooted in colonialism-both past and present. Luckily, falling sequencing costs, widening availability of analytical tools and an increasingly connected scientific community provide key opportunities to improve existing assemblies, fill sampling gaps and empower a more global plant genomics community.


Conflict of interest statement

The authors declare no competing interests.

Figures

Fig. 1
Fig. 1. Changes in land plant genome assembly quality and availability over time.
Assembly contiguity by submission date for 798 land plant species with publicly available genome assemblies. Points are coloured by the type of sequencing technology used and scaled by the number of assemblies available for that species. There is an improvement in contiguity associated with the advent of long-read sequencing technology, and a noticeable increase in the number of genome assemblies generated annually. All assemblies generated before 2008 have since been updated and are therefore not included.
Fig. 2
Fig. 2. Comparison of genome availability and quality metrics for each land plant order.
a, The number of species with publicly available genome assemblies as of January 2021 (n = 798) versus the number expected for each order. Significance values were calculated using Fisher’s exact test. Orders with no genome assemblies are shown in grey. Bryophytes are plotted at the phylum level, but Extended Data Fig. 2 shows bryophyte orders. Orders showing significant over- or under-representation are marked with asterisks. Over-represented orders include Brassicales (P = 3.03 × 10–13), Cucurbitales (P = 0.0038), Fagales (P = 0.0003), Malvales (P = 0.0084), Rosales (P = 0.0286) and Solanales (P = 1.27 × 10–6). Under-represented orders include Asparagales (P = 2.62 × 10–11), Asterales (P = 1.00 × 10–10), Gentianales (P = 0001) and Polypodiales (P = 8.93 × 10–8). b, Box plots showing the distribution of assembly length for each order of land plants. Points are coloured by ploidy. c, Box plots showing the distribution of contig N50 for each order of land plants. d, Box plots showing the distribution of complete BUSCO percentages for each order of land plants. c,d, Points are coloured by sequencing technology. For all box plots, the box defines the interquartile range (25th–75th percentile) and the centre line represents the median; whiskers extend to the maximum and minimum data values.
Fig. 3
Fig. 3. Geographic distribution of the submitting institutions for 798 plant genome assemblies.
Circles are scaled by the number of genome assemblies produced in each nation and coloured by the relative proportion of domesticated, cultivated, feral, natural commodity, wild and wild relative species sequenced.
Fig. 4
Fig. 4. Disparities between species origin and lead sequencing institutions.
a, Geographic perspective on where domesticated plants (n = 135) are native to versus where their genome assemblies were generated. Circle size and arrow weights are scaled by the number of genome assemblies represented. Circles represent the species native to that continent while arrows terminate in the continent where the species were sequenced. b, Number of domesticated species native to each continent and affiliations of the sequencing teams. c, Number of non-native species sequenced in each continent and the proportion of those efforts that included co-authors from the native range of the focal species.
Extended Data Fig. 1
Extended Data Fig. 1. Statistical representation of bryophyte genome assemblies.
The number of species in each bryophyte order with publicly available genome assemblies versus the number expected based on species richness. Significance values were calculated using Fishers Exact Tests. Orders without a genome assembly are shown in grey. Orders that showed a significant over- or under-representation are marked with ** (P  < 0.005) or * (P < 0.05).
Extended Data Fig. 2
Extended Data Fig. 2. Quality and representation of polyploid assemblies.
a, Genome assembly contiguity (N50) by assembly size for the 268 species with ploidy infromation. Contiguity is not associated with differences in genome size. The ploidy level of each genome is indicated by color. The mean N50s of polyploid and diploid genomes do not differ significantly. b, The observed vs. expected number of genome assemblies available for each ploidy level. Significance values were calculated using Fishers Exact Tests. Diploid genomes are statistically over-represented (P = 7.10e-11) and tetraploid (P = 3.13e-29), hexaploidy (P = 0.0465), and octoploid (P = 1.20e-04) genomes are statistically underrepresented. Ploidy levels that showed a significant over- or under-representation are marked with ** (P < 0.005) or * (P < 0.05).
Extended Data Fig. 3
Extended Data Fig. 3. Relationship between assembly contiguity and the percentage of complete BUSCOs.
Genome assembly contiguity is positively associated with the percent of complete BUSCOs identified (n = 627). Overall, assemblies generated with long-read sequencing capture a higher percentage of complete BUSCOs.

Comment in

References

    1. Initiative TAG. Analysis of the genome sequence of the flowering plant Arabidopsis thaliana. Nature. 2000;408:796–815. - PubMed
    1. Sayers EW, et al. GenBank. Nucleic Acids Res. 2020;48:D84–D86. - PMC - PubMed
    1. Li C, Lin F, An D, Wang W, Huang R. Genome sequencing and assembly by long reads in plants. Genes. 2017;9:6. - PMC - PubMed
    1. Michael TP, VanBuren R. Building near-complete plant genomes. Curr. Opin. Plant Biol. 2020;54:26–33. - PubMed
    1. Sharma, P. et al. Improvements in the sequencing and assembly of plant genomes. https://gigabytejournal.com/articles/24 (2021). - PMC - PubMed