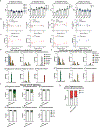
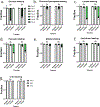
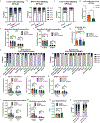
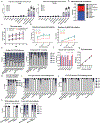
. 2021 Dec;3(12):1608-1620.
doi: 10.1038/s42255-021-00487-4. Epub 2021 Nov 29.

Serine catabolism generates liver NADPH and supports hepatic lipogenesis

Affiliations

Serine catabolism generates liver NADPH and supports hepatic lipogenesis

Zhaoyue Zhang et al. Nat Metab. 2021 Dec.

Abstract

Carbohydrate can be converted into fat by de novo lipogenesis, a process upregulated in fatty liver disease. Chemically, de novo lipogenesis involves polymerization and reduction of acetyl-CoA, using NADPH as the electron donor. The feedstocks used to generate acetyl-CoA and NADPH in lipogenic tissues remain, however, unclear. Here we show using stable isotope tracing in mice that de novo lipogenesis in adipose is supported by glucose and its catabolism via the pentose phosphate pathway to make NADPH. The liver, in contrast, derives acetyl-CoA for lipogenesis from acetate and lactate, and NADPH from folate-mediated serine catabolism. Such NADPH generation involves the cytosolic serine pathway in liver running in the opposite direction to that observed in most tissues and tumours, with NADPH made by the SHMT1-MTHFD1-ALDH1L1 reaction sequence. SHMT inhibition decreases hepatic lipogenesis. Thus, liver folate metabolism is distinctively wired to support cytosolic NADPH production and lipogenesis. More generally, while the same enzymes are involved in fat synthesis in liver and adipose, different substrates are used, opening the door to tissue-specific pharmacological interventions.


Conflict of interest statement

Competing Interests Statement

G.X., G.J.T. and M.F.C. are current employees of Pfizer and may be Pfizer shareholders. J.D.R. is a consultant and received research funding from Pfizer and is an advisor and stock owner in Colorado Research Partners, L.E.A.F. Pharmaceuticals, Rafael Pharmaceuticals, Barer Institute and its subsidiaries, Serien Therapeutics, Toran, Kadmon Pharmaceuticals, and Agios Pharmaceuticals. J.D.R. is co-inventor of SHIN2 and related SHMT inhibitors, which have been patented by Princeton University. The remaining authors declare no competing interests.

Figures
Extended Data Figure 1.
Extended Data Figure 1.. Fatty acid composition and D2O labeling across tissues and time
a. Fraction of tissue weight that is fat, and composition of those fatty acids in male and female mice. b. Fat is stored in white adipose tissue, and to a lesser extent in muscle. Muscle values are calculated assuming quadriceps is representative of whole-body muscle. c. Body weight of mice drinking 20% D2O for 4 weeks (control data are from Jackson lab website). d. Fatty acid labeling from D2O reaches steady-state more quickly in serum than in white adipose, while different fatty acid species reach steady-state at a similar rate. e. C18:0 and oleate (C18:1) labeling pattern across tissues after 4 weeks of D2O drinking. f. Serum D2O enrichment measured by LC-MS and GC-MS. g. Labeling of serum D2O increases linearly over time for the 12 h of infusion. h. Circadian pattern of liver fat synthesis based on 6 h D2O infusions. i. C16:0 labeling pattern across tissues after 12 h fed-state D2O infusion in male mice. j. As is (j), for female mice. k. C16:0 labeling in white adipose tissue, liver, and brown adipose tissue from 12 h refed D2O infusion after 24 h fast. Mean ± s.d., n=3 of both genders for fat composition analysis; n=4 male mice for steady-state analysis and body composition analysis; n=4 of both genders for bodyweight measurement; n=2 male mice for 6 h D2O infusions; n=5 of both genders for 12 h D2O infusion; n=5 males in each group for the fasted-refed experiments.
Extended Data Figure 2.
Extended Data Figure 2.. Circulating metabolite levels and labeling and tissue saponified fat labeling from carbon tracers and [1-2H]glucose
a. Circulating concentrations of unlabeled and labeled forms during the indicated tracer infusions. b. Corresponding total concentrations. c. Corresponding average carbon atom labeling (for the 13C tracers) or labeled fraction (for the [1-2H]glucose tracer). d. Tail vein serum circulating metabolite average carbon atom labeling from different infused 13C tracers (each sampled at end of 12 h infusion). e. As in (d), from portal vein. f. Corresponding C16:0 labeling in liver and brown adipose. g. Glucose-6-phosphate labeling from 12 h [1-2H]glucose infusion in liver and brown adipose tissue. All data are mean ± s.d. For time-point samples, [U-13C]glucose (n=3), lactate (n=3), acetate (n=3), [1-2H]glucose (n=4), saline (n=2); for other samples [U-13C]glucose (n=4), lactate (n=4), glutamine (n=2), acetate (n=4), alanine (n=2) citrate (n=2) and [1-2H]glucose (n=4). All mice are males. For female data, see Sup. 6.
Extended Data Figure 3.
Extended Data Figure 3.. Carbon tracing in liver slices
a-g. Labeling of the indicated metabolites in liver slices after 2 h or 6 h incubation in Krebs-Ringer buffer containing glucose, lactate, and acetate, with the indicated metabolite provided in [U13C]-labeled form. Data are mean ± s.d.; n=2 mice for 2 h experiments; n=3 mice for 6 h experiments, 2 technical replicates (independent tissue slices) from each mouse liver. All mice are males.
Extended Data Figure 4.
Extended Data Figure 4.. Hepatocytes are deficient in the oxPPP, and [2,3,3,4,4-2H]glutamine tracer works to probe malic enzyme and IDH flux in cultured hepatocytes but not in vivo
a. C16:0 labeling over 6 h from different tracers in primary hepatocytes. b. NADPH active-H labeling over 2.5 h from different tracers in primary hepatocytes. c. NADPH active-H measurement over 2.5 h from [3-2H]glucose in HepG2 cells. d. Enzymatic activity of G6PD, 6PGD, IDH1 and ME1 in lysates from HepG2 cells and primary murine hepatocytes. e. Hydride sources supporting de novo lipogenesis in HepG2 cells and primary hepatocytes, correcting for substrate labeling and H-D exchange between NADPH and water. f. NADHP active hydrogen labeling from 12 h D2O infusion in liver and brown adipose g. The fraction of active hydrogen on NADPH that undergoes solvent exchange with water calculated from 12 h D2O infusion in liver and brown adipose. h. Glutamine is the dominant TCA substrate in cultured primary hepatocytes. i. Serum tracer labeling at the end of 12 h [2,3,3,4,4-2H]glutamine infusion. j. Minimal malate and (iso)citrate labeling from [2,3,3,4,4-2H]glutamine infusion across tissues in vivo. k. C16:0 labeling from [2,3,3,4,4-2H]glutamine infusion across tissues. l. Minimal malate and (iso)citrate labeling from [4-2H]glucose and [U-2H]succinate in cultured primary hepatocytes. All data are mean ± s.d., n=4 for solvent exchange measurement, n=2 for [2,3,3,4,4-2H]glutamine infusion, all mice are males, n=3 biological replicates for all cell culture experiments.
Extended Data Figure 5.
Extended Data Figure 5.. Serine’s hydride contribution to liver fat across 8-fold range of [2,3,3-2H]serine infusion rates
a. Circulating serine labeling during [2,3,3-2H]serine infusion at different rates, ranging from minimally to highly perturbative. b. Lack of labeling in liver acetyl-CoA and related metabolites from 12 h [2,3,3-2H]serine infusion (20 nmol/min/gram body weight). c. Circulating serine concentrations during [2,3,3-2H]serine infusion at different rates, ranging from minimally to highly perturbative (sum of unlabeled and labeled). d. Corresponding serine labeling (average atom labeling of serine side chain hydrogens). e. Liver serine labeling after 12 h [2,3,3-2H]serine infusion. f. Corresponding liver and brown adipose tissue NADP(H) labeling. All data are mean ± s.d., For time point experiments n=3 for each tracer and n=2 for saline. For C16:0, NADPH, acetyl-CoA, and related metabolite labeling, n=4 for 5 nmol/min/gram bodyweight and n=6 for 10, 20 and 40 nmol/min/gram bodyweight of [2,3,3-2H]serine infusion. All mice are males.
Extended Data Figure 6.
Extended Data Figure 6.. Carbon and hydrogen inputs to lipogenesis are consistent across female and male mice
a. Tail vein serum circulating metabolite average carbon atom labeling from different infused 13C tracers (each after 12 h infusion) in female mice. b. Corresponding portal vein serum circulating metabolite labeling in female mice. c. Corresponding C16:0 labeling in liver and brown adipose in female mice. d. Fractional enrichment of liver and brown adipose tissue C16:0 in female mice following 12 h infusion of [U-13C]-labeled glucose (n=3), lactate (n=3), acetate (n=3). Male data are the same as Fig. 2b. Labeling is normalized to circulating tracer enrichment. Brown adipose is fueled by systemic blood (approximated by tail vein sampling) and liver is fueled by 78% portal vein blood and 22% systemic blood. e. As is (d), for brown adipose C16:0. f. Carbon sources supporting de novo lipogenesis in liver and brown adipose in female and male mice, based on direct contributions to C16:0, calculated based on data in (d) and (e). Male data are the same as Fig.2d. g. C16:0 labeling in liver, brown adipose and serum following 12 h [1-2H]glucose infusion (125 nmol/min/gram body weight) in female mice (n=3). h. NADPH active-H measurement in liver and brown adipose from 12 h [1-2H]glucose infusion (125 nmol/min/gram bw)in female mice (n=4). i. As is (g), for 12 h [2,3,3-2H]serine infusion (20 nmol/min/gram bw). j. As is (h), for 12 h [2,3,3-2H]serine infusion (20 nmol/min/gram bw). k. Hydride sources supporting de novo lipogenesis in liver and brown adipose in female and male mice, correcting for substrate labeling and H-D exchange between NADPH and water. Calculated based on tracer data in (b) and (d) and D2O exchange data in Sup.4i. Male data are the same in Fig. 3g. Data in f are mean ± s.e.m.; other data are mean ± s.d.
Extended Data Figure 7.
Extended Data Figure 7.. Cytosolic serine catabolism in the liver is blunted by SHMT knockout or inhibition.
a. 5-methyl-THF labeling from 12 h [2,3,3-2H]serine (20 nmol/min/gram body weight). M+2 labeling reflects cytosolic serine catabolism. M+1 labeling reflects the combination of mitochondrial serine catabolism and reversible flux through MTHFD1. b. Glucose levels after insulin tolerance test in control and whole-body ΔSHMT1 mice. c. Serine labeling in liver from 12 h [2,3,3-2H]serine infusion (20 nmol/min/gram bw) in control, whole-body ΔSHMT1 mice, and mice treated with the dual SHMT1/2 inhibitor SHIN2 (3.33 mg/kg/h i.v. infusion). d. C16:0 labeling in liver from 12 h [2,3,3-2H]serine infusion (20 nmol/min/gram bw). e. As is (c), for [2H]formate infusion. (control vs. ΔSHMT1, p=0.0010; control vs. SHIN2 treatment, p=0.0091). f. As is (d), for [2H]formate infusion. g. C16:0 labeling across tissues following 12 h [2,3,3–2H]serine infusion (20 nmol/min/gram body weight) in control and ΔSHMT1 mice. Mean ± s.d. For insulin tolerance tests, n=12 for SHMT1 knock out mice, n=4 for littermate wild type controls. For serine and formate infusions, n=6 for control, n=4 for ∆SHMT1, n=4 for SHIN2 treatment. For [2,3,3-2H]serine infusion in ∆SHMT1 mice, n=4 for liver, bat, brain bone marrow, serum, and skin; n=3 for other tissues; control mice data are the same as Fig.3e. For D2O tracing experiments, n=10 in each group. *p<0.05; **p<0.01; ***p<0.005 by unpaired Mann-Whitney test. All mice are males.
Extended Data Figure 8.
Extended Data Figure 8.. Concentrations and labeling of saponified fatty acids and soluble metabolites in wild type, ΔSHMT1, and SHMT inhibitor-treated mice (3.33 mg/kg/h i.v. infusion of SHIN2 for 12 h)
a. Saponified C16:0 labeling pattern in liver following 12 h D2O infusion to control, ΔSHMT1, and SHIN2-treated mice (SHIN2 infused simultaneous with the D2O infusion). b. As is (a), for brown adipose. c. Saponified C16:0 labeling pattern in liver following 12 h IP D2O to control and SHIN2-treated mice (SHIN2 infused simultaneous). d. C16:0 lipogenesis flux in liver overnight, as measured by IP D2O injection. (control vs. SHIN2 treatment, p=0.0047) e. C16:0 and C18:0 concentration in liver of control, ΔSHMT1, and SHIN2-treated mice (control vs. ΔSHMT1, p=0.48 for C16:0, p= 0.88 for C18:0; control vs. inhibitor, p=0.48 for C16:0, p= 0.34 for C18:0). f. As is (a), for brown adipose tissue (control vs. ΔSHMT1, p=0.68 for C16:0, p=0.99 for C18:0; control vs. SHIN2 treatment, p=0.99 for C16:0, p=0.11 for C18:1). g. C16:0 lipogenesis flux in brown adipose tissue overnight, as measured by 12 h D2O infusion (control vs. ΔSHMT1, p=0.32; control vs. SHIN2 treatment, p=0.28). h. C16:0 labeling across tissues following 12 h D2O infusion in control and ΔSHMT1 mice. i. Serine concentration in liver and brown adipose tissue of control, ΔSHMT1, and SHIN2-treated mice (control vs. ΔSHMT1, p=0.99 for liver, p=0.99 for BAT; control vs. SHIN2 treatment, p=0.34 for liver, p=0.34 for BAT). j. As is (c), for NADPH (control vs. ΔSHMT1, p=0.99 for liver, p=0.88 for BAT; control vs. SHIN2 treatment, p=0.11 for liver, p=0.20 for BAT). k. As is (c), for NADP+ (control vs. ΔSHMT1, p=0.34 for liver, p=0.34 for BAT; control vs. SHIN2 treatment, p=0.68 for liver, p=0.48 for BAT). l. As is (c), for glutathione (control vs. ΔSHMT1, p=0.34 for liver, p=0.68 for BAT; control vs. SHIN2 treatment, p=0.48 for liver, p=0.99 for BAT). m. As is (c), for glutathione disulfide (control vs. ΔSHMT1, p=0.34 for liver, p=0.88 for BAT; control vs. SHIN2 treatment, p=0.88 for liver, p=0.14 for BAT). n. Liver glutathione disulfide vs. reduced glutathione ratio in control, ΔSHMT1, and SHIN2-treated mice (control vs. ΔSHMT1, p=0.99; control vs. SHIN2 treatment, p=0.029). o. Liver C16:0 labeling pattern after 12 h D2O infusion during ad lib feeding and in mice subjected to 24 h fasting followed by refeeding (control data is the same as Sup.1l; ΔSHMT1 ad lib fed data are the same as Sup.7f). Mean± s.d, n=4 for control, ∆SHMT1, and SHIN2-treated mice. For refeeding experiment, n=3 for ΔSHMT1 refed. For D2O infusion in ∆SHMT1 mice, n=2 for liver, bat, white adipose, lung, brain, bone marrow, serum, and skin; n=1 for other tissues; control mice data are the same as Sup.1i. *p<0.05 by unpaired Mann-Whitney test. All mice are males.
Extended Data Figure 9.
Extended Data Figure 9.. Knockout of SHMT1 does not induce alternative NADPH producing enzymes.
a. C16:0 labeling from [1-2H]glucose in liver, brown adipose tissue, and serum in control and ΔSHMT1 mice. b. Relative mRNA expression level of Malic Enzyme 1 (ME1) and Isocitrate dehydrogenase 1 (IDH1) in liver of control, ΔSHMT1, and 12 h SHIN2 treated mice (3.33 mg/kg/h i.v. infusion) (control vs. ΔSHMT1, p=0.48 for ME1, p=0.88 for IDH1; control vs. inhibitor, p=0.73 for ME1, p=0.56 for IDH1.) c. Relative mRNA expression level of fatty acid synthase (FASN) in liver of control, ΔSHMT1, and 12 h SHIN2 treated mice (3.33 mg/kg/h i.v. infusion) (control vs. ΔSHMT1, p=0.48 for control vs. inhibitor, p=0.26.) Mean± s.d. N=2 mice in each group for [1-2H]glucose infusion. For qPCR, n=4 for control, n=4 for ΔSHMT1, n=5 for SHIN2 treatment, p-values from unpaired Mann-Whitney test. All mice are males.
Extended Data Figure 10.
Extended Data Figure 10.. SHMT inhibition reduced sucrose-water induced hepatic lipogenesis increase
a. Saponified C16:0 and C18:1 concentration of serum, liver, and BAT in control and 4 weeks 20% sucrose water drinking mice (control vs. sucrose water drinking, serum p=0.024 for C16:0, p= 0.024 for C18:1; liver p=0.024 for C16:0, p= 0.024 for C18:1; BAT p=0.90 for C16:0, p= 0.99 for C18:1.). b. C16:0 and C18:1 labeling fraction in liver, brown adipose tissue, and serum from fed state 12 h D2O infusion of control and 4 weeks 20% sucrose water drinking mice. c. Saponified C16:0 and C18:1 labeling in liver, brown adipose tissue, and serum with or without SHIN2 treatment. d. Overall serum levels of fatty aicds instead of labeling with or without SHIN2 treatment (control vs. SHIN2 treatment, p=0.0022 for C16:0; p= 0.0043 for C18:1). e. As is (g), for liver (control vs. SHIN2 treatment, p=0.23 for C16:0, p= 0.44 for C18:1). Mean± s.d. For experiments comparing control to sucrose water drinking, n=6 for control, n=3 for 4-week sucrose water drinking. For experiments comparing vehicle to SHIN2 treatment, n=6 for control and n=7 for SHIN2. *p<0.05; **p<0.01; ***p<0.005 by unpaired Mann-Whitney test. All mice are males.
Figure 1.
Figure 1.. De novo lipogenesis in liver and brown adipose produces much of whole-body saturated fat
a. Liver palmitate (C16:0) labeling pattern after 4 weeks of D2O drinking. Left bars (blue) reflect the experimentally observed labeling; right bars (green) reflect the calculated labeling based on fraction of newly synthesized fat and observed D2O and NADPH labeling. Fraction dietary versus synthesized fat is based on fitting the labeling pattern. Throughout the manuscript, all data are for saponified fatty acids. b. Palmitate (C16:0) and linoleate (C18:2) labeling pattern across tissues after 4 weeks D2O drinking. C18:2 is an essential fatty acid and accordingly shows no labeling. c. Composition of whole-body fat (left) and fraction that is endogenously synthesized based on the 4-week D2O drinking data (right). d. C16:0 labeling pattern across tissues after 12 h fed-state D2O infusion. Mean ± s.d., n=6 mice for composition analysis (3 males and 3 females); n=3 males for D2O drinking experiment and n=10 (5 males and 5 females) for 12 h D2O infusion. Images in a and d were created with BioRender.com.
Figure 2.
Figure 2.. Liver and brown adipose use different carbon sources to support lipogenesis
a. Average atom labeling of liver C16:0 following 12 h infusion of [U-13C]-labeled glucose (n=4), lactate (n=4), glutamine (n=2), acetate (n=4), alanine (n=2) and citrate (n=2). Labeling is normalized to circulating tracer labeling. Brown adipose is perfused by systemic blood (approximated by tail vein sampling) and liver by 78% portal vein blood and 22% systemic blood. b. As is (a), for brown adipose C16:0. c. Isotope tracing into fat is complicated by interconversion of the tracer with other circulating metabolites. By conducting tracer experiments with all key circulating substrates, the direct contribution of each can be determined by linear algebra. d. Carbon sources supporting de novo lipogenesis in liver and brown adipose, based on direct contributions to C16:0, calculated based on data in (a) and (b) and Sup. 2. e. Schematic of differential lipogenic substrate use by liver versus brown adipose. Data in a, b are mean ± s.d.; data in d is mean ± s.e.m. All mice are males. Results in females are similar (Sup. 6). Images in c and e were created with BioRender.com
Figure 3.
Figure 3.. Brown adipose generates lipogenic NADPH via the oxPPP but not liver
a. Scheme for 14C experiment to examine absolute oxPPP flux. b. 14CO2 release flux from [1-14C]glucose and [6-14C]glucose in HepG2 and primary hepatocytes. c. Absolute oxPPP flux in HepG2 and primary hepatocytes. d. Schematic of pathway by which [1-2H]glucose labels NADPH via the oxPPP. e. C16:0 labeling across tissues following 12 h [1-2H]glucose infusion (125 nmol/min/gram body weight). f. NADPH active-H measurement in liver and brown adipose from 12 h [1-2H]glucose infusion (125 nmol/min/gram bw). Mean ± s.d., n=6 replicates for cultured cell experiments; n=4 mice for [1-2H]glucose infusion. All mice are males. Results in females are similar (Sup. 6).
Figure 4.
Figure 4.. Serine’s hydride contribution to liver fat across 8-fold range of [2,3,3-2H]serine infusion rates
a. Schematic of pathway by which [2,3,3-2H]serine labels NADPH via cytosolic folate metabolism. b. C16:0 labeling across tissues following 12 h [2,3,3-2H]serine infusion (20 nmol/min/gram bw) c. NADPH active-H measurement in liver and brown adipose from 12 h [2,3,3-2H]serine infusion (20 nmol/min/gram bw) d. Liver and brown adipose tissue C16:0 labeling following 12h [2,3,3-2H]serine infusion at different rates, ranging from minimally to highly perturbative. e. Corresponding normalized contribution of serine to liver C16:0 hydrogen (average number of labeled hydrogens in C16:0 relative to fraction serine M+2 or M+3). f. NADPH active-H labeling following 12h [2,3,3-2H]serine infusion at 40nmol/min/gram bodyweight measured either directly (from Sup.5f) or calculated from palmitate (from Fig.4d left). g. Hydride sources supporting de novo lipogenesis in liver and brown adipose, correcting for substrate labeling and H-D exchange between NADPH and water. Calculated based on tracer data in (c) and (f) and D2O exchange data in Sup. 4f. h. Schematic of differential lipogenic substrate use by liver versus brown adipose. All data are mean ± s.d., n=4 for 5 nmol/min/gram bodyweight and n=6 for 10, 20 and 40 nmol/min/gram bodyweight of [2,3,3-2H]serine infusion. All mice are males. Panel h was created with BioRender.com.
Figure 5.
Figure 5.. Liver serine catabolism generates NADPH via SHMT1-MTHFD1-ALDH1L1 and thereby supports hepatic lipogenesis
a. Schematic of the cytosolic and mitochondrial serine catabolic pathways. Metabolite labeling from [2,3,3-2H]serine generated by the cytosolic pathway is shown in red and mitochondrial pathway in blue. b. 5-methyl-THF labeling for 12 h [2,3,3-2H]serine infusion (20 nmol/min/gram body weight). Ratio of M+2 to M+1 labeling reflects relative contribution of cytosolic versus mitochondrial serine catabolism to 1C units in 5-methyl-THF. c. 5-methyl-THF labeling in liver for 12 h [2,3,3-2H]serine infusion (20 nmol/min/gram bw) in control, whole-body ΔSHMT1 mice, and mice treated with the dual SHMT1/2 inhibitor SHIN2 (3.33 mg/kg/h i.v. infusion). d. NADPH active-H measurement in liver for 12 h [2,3,3-2H]serine infusion (20 nmol/min/gram bw) (control vs. ΔSHMT1, p=0.0048; control vs. SHIN2 treatment, p=0.0043). e. C16:0 labeling in liver for 12 h [2,3,3-2H]serine infusion (20 nmol/min/gram bw). Labeling is normalized to liver serine enrichment and reported as the average number of labeled hydrogens in C16:0. (control vs. ΔSHMT1, p=0.0043; control vs. SHIN2 treatment, p=0.0095). f. C16:0 lipogenesis flux in liver overnight, as measured by 12 h D2O infusion (control vs. ΔSHMT1, p=0.043; control vs. SHIN2 treatment, p=0.0002). Mean ± s.d. For serine tracing, n=6 for control, n=5 for ∆SHMT1, n=4 for inhibitor treatment. For D2O infusion in (f) and (g), n=10 for all 3 conditions, in (h) n=6 for vehicle control, n=7 for SHIN2 treatment. All mice are males. *p<0.05, **p<0.01; ***p<0.005 by unpaired Mann-Whitney test, all p-values are two-sided.
Figure 6.
Figure 6.. Sucrose-induced lipogenesis consumes hydride from serine and depends on SHMT activity
a. C16:0 and C18:1 lipogenesis flux in liver of control and 4 weeks 20% sucrose water drinking mice (control vs. sucrose water drinking, p=0.024 for liver C16:0, p=0.024 for liver C18:1). b. C16:0 and C18:1 labeling from 12 h [2,3,3-2H]serine infusion (10 nmol/min/gram body weight) in control and 4 weeks 20% sucrose water drinking mice. c. Impact of pharmacological SHMT1/2 inhibition on sucrose-induced lipogenesis. Mice were given 20% sucrose in the drinking water for 4 weeks. Then, 36 h prior to sacrifice and tissue collection, they were given vehicle or SHIN2 (3.33 mg/kg/h i.v. infusion). The SHIN2 or vehicle infusion was then augmented by D2O infusion for the final 12 h, which corresponded to the fed state (nighttime). Lipogenesis with or without SHIN2 treatment is shown. (Control vs. SHIN2 treatment, p=0.0047 for C16:0; p=0.0023 for C18:1). d. Serum and hepatic TG levels with or without SHIN2 treatment, in heatmap format. (Control vs. SHIN2 treatment, for serum, TG(48:0) p=0.23, TG(50:0) p=0.0012, TG(52:0) p=0.0047, TG(54:0) p=0.0221, TG(48:1) p=0.0023, TG(50:1) p=0.014, TG(52:1) p=0.0047, TG(54:1) p=0.0082, TG(48:2) p=0.0012, TG(50:2) p=0.0023, TG(52:2) p=0.29, TG(54:2) p=0.0082, TG(50:3) p=0.0082, TG(52:3) p=0.035, TG(54:3) p=0.014. For liver, TG(48:0) p=0.0012, TG(50:0) p=0.0082, TG(52:0) p=0.051, TG(54:0) p=0.051, TG(48:1) p=0.0012, TG(50:1) p=0.94, TG(52:1) p=0.14, TG(54:1) p=0.0012, TG(48:2) p=0.014, TG(50:2) p=0.53, TG(52:2) p=0.073, TG(54:2) p=0.23, TG(50:3) p=0.14, TG(52:3) p=0.63, TG(54:3) p=0.051). Mean± s.d. For experiments comparing control to sucrose water drinking, n=6 for control, n=3 for 4-week sucrose water drinking. For experiments comparing vehicle to SHIN2 treatment, n=6 for control and n=7 for SHIN2. *p<0.05; **p<0.01; ***p<0.005 by unpaired Mann-Whitney test, all statistic-values are two-sided. All mice are males. Panel a was created with BioRender.com.

Comment in

References

    1. Lehninger AL, Nelson DL, Cox MM. Lehninger principles of biochemistry 6th ed. W.H. Freeman; 2013.
    1. Yu Y, Clippinger AJ, Alwine JC. Viral effects on metabolism: changes in glucose and glutamine utilization during human cytomegalovirus infection. Trends Microbiol July 2011;19(7):360–7. doi:10.1016/j.tim.2011.04.002 - DOI - PMC - PubMed
    1. Heaton NS, Perera R, Berger KL, et al. Dengue virus nonstructural protein 3 redistributes fatty acid synthase to sites of viral replication and increases cellular fatty acid synthesis. Proc Natl Acad Sci U S A October 2010;107(40):17345–50. doi:10.1073/pnas.1010811107 - DOI - PMC - PubMed
    1. Singh A, Ruiz C, Bhalla K, et al. De novo lipogenesis represents a therapeutic target in mutant Kras non-small cell lung cancer. FASEB J June 2018:fj201800204. doi:10.1096/fj.201800204 - DOI - PMC - PubMed
    1. Stoiber K, Nagło O, Pernpeintner C, et al. Targeting de novo lipogenesis as a novel approach in anti-cancer therapy. Br J Cancer January 2018;118(1):43–51. doi:10.1038/bjc.2017.374 - DOI - PMC - PubMed

Publication types

MeSH terms