. 2021 Dec;12(12):947-964.
doi: 10.1007/s13238-021-00865-4. Epub 2021 Nov 30.

Generation of developmentally competent oocytes and fertile mice from parthenogenetic embryonic stem cells

Affiliations

Generation of developmentally competent oocytes and fertile mice from parthenogenetic embryonic stem cells

Chenglei Tian et al. Protein Cell. 2021 Dec.

Abstract

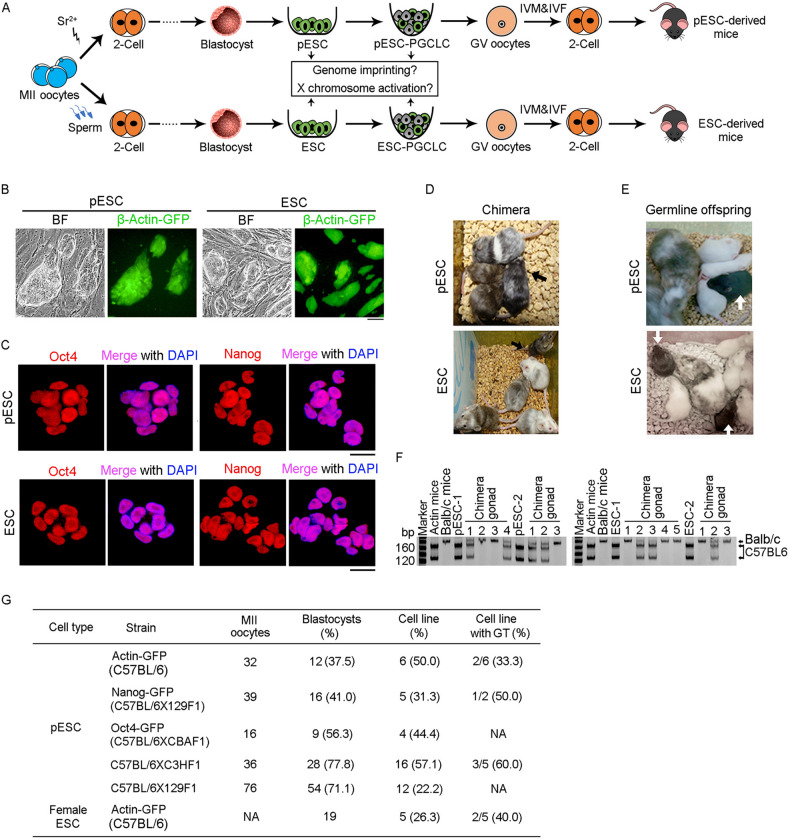
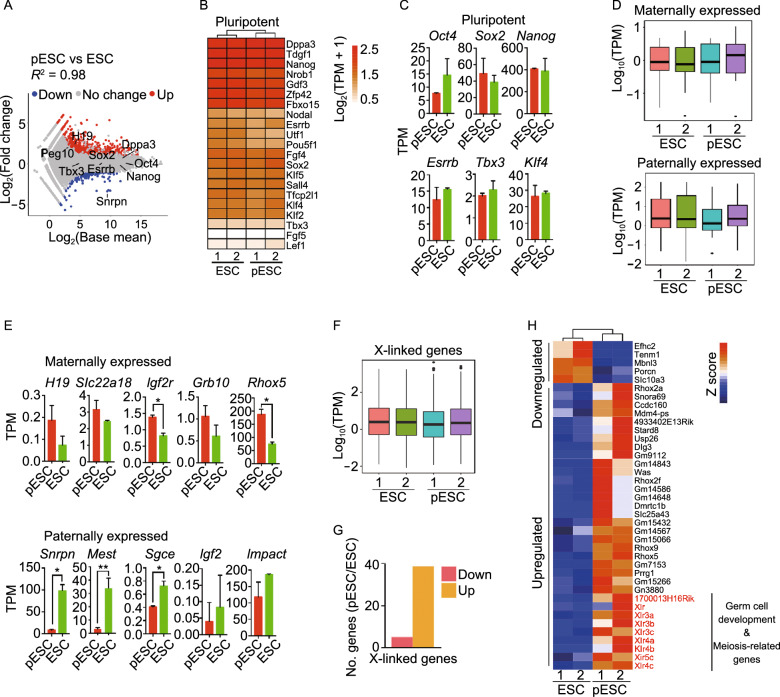
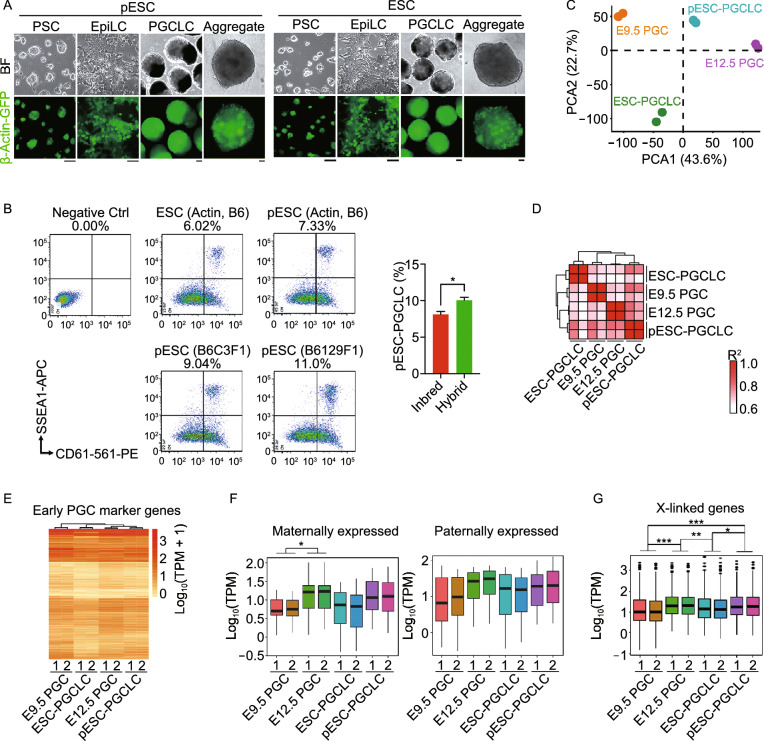
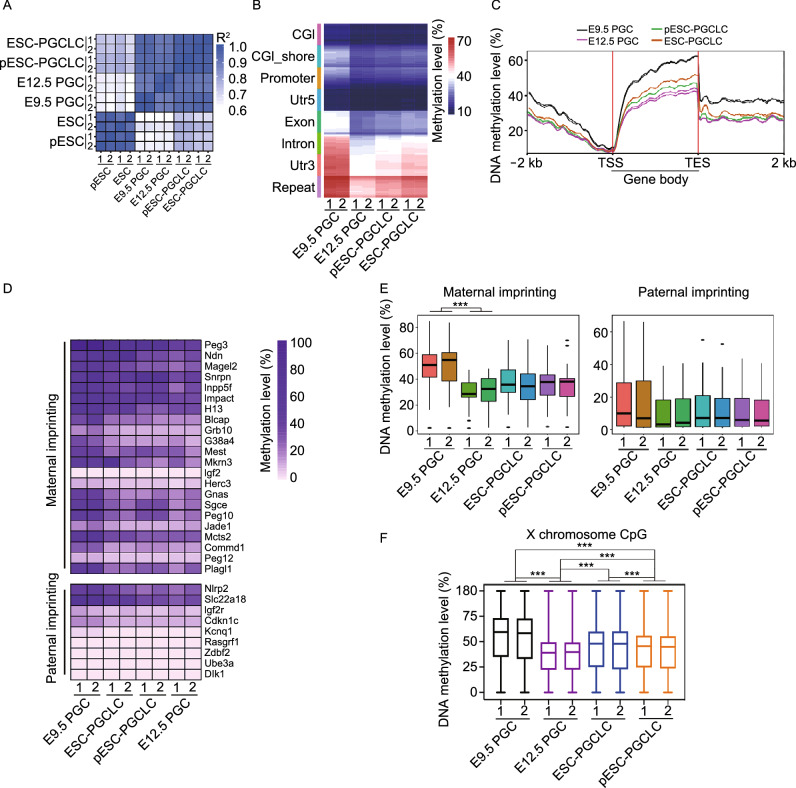
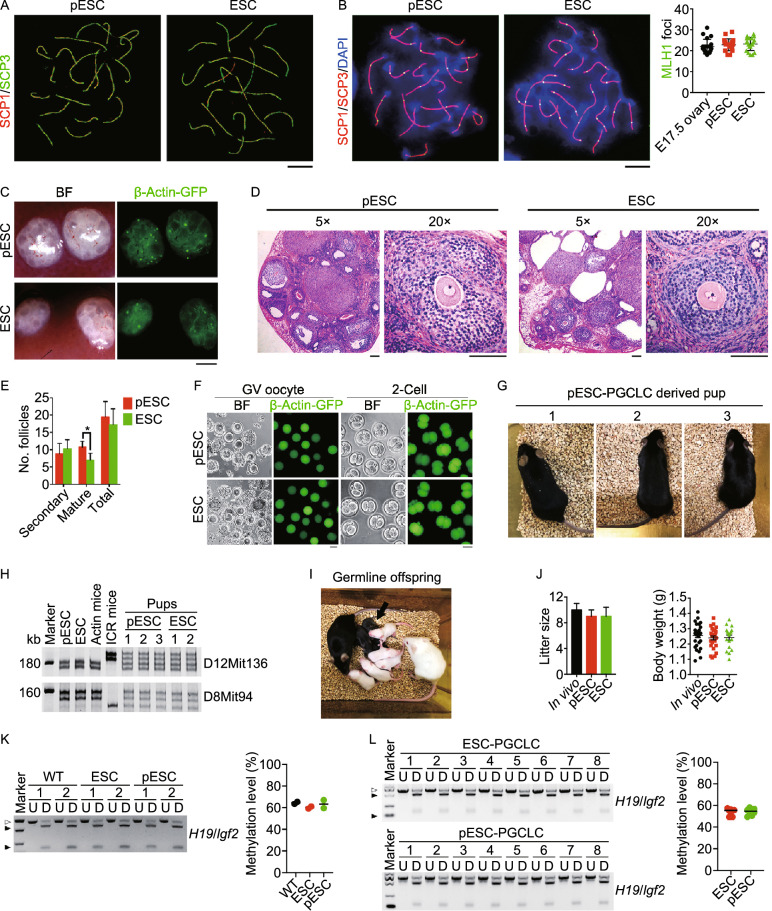
Parthenogenetic embryos, created by activation and diploidization of oocytes, arrest at mid-gestation for defective paternal imprints, which impair placental development. Also, viable offspring has not been obtained without genetic manipulation from parthenogenetic embryonic stem cells (pESCs) derived from parthenogenetic embryos, presumably attributable to their aberrant imprinting. We show that an unlimited number of oocytes can be derived from pESCs and produce healthy offspring. Moreover, normal expression of imprinted genes is found in the germ cells and the mice. pESCs exhibited imprinting consistent with exclusively maternal lineage, and higher X-chromosome activation compared to female ESCs derived from the same mouse genetic background. pESCs differentiated into primordial germ cell-like cells (PGCLCs) and formed oocytes following in vivo transplantation into kidney capsule that produced fertile pups and reconstituted ovarian endocrine function. The transcriptome and methylation of imprinted and X-linked genes in pESC-PGCLCs closely resembled those of in vivo produced PGCs, consistent with efficient reprogramming of methylation and genomic imprinting. These results demonstrate that amplification of germ cells through parthenogenesis faithfully maintains maternal imprinting, offering a promising route for deriving functional oocytes and having potential in rebuilding ovarian endocrine function.

Keywords: imprinting; meiosis; oocytes; parthenogenetic embryonic stem cells; primordial germ cell-like cells.


Conflict of interest statement

The authors declare that they have no competing interests.

Figures

Figure 1
Figure 1
Parthenogenetic ESCs (pESCs) acquire germline competence. (A) Schematic summary illustrating the strategy of augmenting oocytes by derivation of pESCs from parthenogenetically activated oocytes or ESCs from fertilized embryos that are directed to differentiate into germ cells and functional oocytes. IVM, in vitro maturation; IVF, in vitro fertilization. (B) Morphology and β-Actin-GFP expression of pESCs and ESCs. Scale bar = 100 μm. (C) Expression of pluripotency markers (Oct4 and Nanog) of pESCs and ESCs. Scale bar = 20 μm. (D and E) Chimera (D) and germline competency (E) of pESCs and ESCs by 4–8-cell embryo injection. Germline offspring was produced by mating of chimeras with albino ICR mice. Albino Balb/c mice served as embryo donors, and pseudo-pregnant albino Kunming mice as surrogate mother. (F) Genotyping analysis of gonad in pESC (left) and ESC (right) derived chimeras generated from pESCs or ESCs by microsatellite primers D12Mit136. (G) Summary of derivation of pESCs and female ESCs from various mouse strains. Actin-GFP and Oct4-GFP pESCs were from in vivo (IVO) MII oocytes; Nanog-GFP pESCs from in vitro maturation (IVM) MII oocytes; C57BL/6XC3HF1 and C57BL/6X129F1 pESCs from IVO and IVM oocytes. NA, not available; GT, germline transmission competence; the efficiency (%) of GT cell lines is shown as the number of cell lines with germline transmission competence/number of cell lines tested
Figure 2
Figure 2
Parthenogenetic ESCs (pESCs) maintain expression of maternal genes. (A) Scatter-plots showing the differential gene expression profile between pESCs and ESCs. Two-fold changes (P < 0.05) are set as threshold. (B) Heatmap displaying similar expression profile of pluripotency genes between pESCs and ESCs. (C) Comparison of expression of representative pluripotency genes in pESCs and ESCs by RNA-seq. Data shown as mean ± SEM. (D) Box plot showing higher levels of maternally expressed genes but lower levels of paternally expressed genes in pESCs than in ESCs. (E) Expression of representative maternally and paternally expressed genes in pESCs and ESCs by RNA-seq. Data shown as mean ± SEM. (F) Box plot displaying expression profile of all X-linked genes in pESCs compared with that of ESCs. (G) More upregulated than downregulated X-linked genes in pESCs compared with ESCs. The threshold of differentially expressed genes (DEGs) is ≥ 2-fold (P < 0.05). (H) Typical upregulated and downregulated X-linked genes of pESCs compared with ESCs (≥ 2 fold change, P < 0.05). Genes in red, germ cell development or meiosis. All RNA-seq analysis represents two biological replicates
Figure 3
Figure 3
Comparison of pESC-PGCLCs and PGCs in vivo at global transcription levels and in imprinting. (A) Epiblast-like cells (EpiLCs) and PGCLCs induced from pESCs or ESCs bearing Actin-GFP, and aggregates of PGCLCs with E12.5 gonad somatic cells sorted from albino ICR mice for one day. Scale bar = 50 μm. (B) Representative PGCLCs induction (left) from pESCs or ESCs from Actin-GFP C57BL/6 mice, or pESCs from hybrid mice (C57BL/6XC3HF1 or C57BL/6X129F1) by FACS, and statistics (right) of PGCLCs induction efficiency from inbred (Actin, B6) and hybrid pESCs. Three replicates for inbred ESCs and pESCs and two replicates for hybrid pESCs. SSEA1 and CD61 double-positive cells represent PGCLCs. Absence of the antibody served as negative control. (C) PCA analysis by RNA-seq of E9.5 PGCs, E12.5 PGCs and pESC- or ESC-PGCLCs. (D) Pearson’s correlation coefficient (R2) graph of E9.5 PGCs, E12.5 PGCs, pESC-PGCLCs and ESC-PGCLCs. The value of 1.0 represents perfect positive correlation and 0 represents no correlation between the two samples. (E) Heatmap showing the expression profile of early PGC marker genes in E9.5 PGCs, E12.5 PGCs, ESC-PGCLCs and pESC-PGCLCs. Gene expression level is shown as log10(TPM + 1). (F) Box plot displaying expression profile of maternal and paternal genes in E9.5 PGCs, E12.5 PGCs, and pESC- or ESC-PGCLCs. (G) Box plot displaying expression profile of X chromosome-linked genes in E9.5 PGCs, E12.5 PGCs, and pESC- or ESC-PGCLCs. Data shown as Mean ± SEM. *P < 0.05, **P < 0.01, ***P < 0.001. All RNA-seq analysis represents two biological replicates
Figure 4
Figure 4
Comparison of pESC-PGCLCs and PGCs at DNA methylation levels. (A) Correlation factors of genome-wide DNA methylation levels in E9.5 PGCs, E12.5 PGCs, ESC-PGCLCs and pESC-PGCLCs as well as ESCs and pESCs. (B) Heatmap showing genome-wide DNA methylation levels at different gene regions of E9.5 PGCs, E12.5 PGCs, ESC-PGCLCs and pESC-PGCLCs. (C) Genome-wide DNA methylation level in gene body regions including up- and down-stream 2 kb of gene body. (D) Methylation level of maternal and paternal imprinting genes in pESC-PGCLCs, ESC-PGCLCs, E9.5 PGCs and E12.5 PGCs. Methylation counts are provided in Table S1. (E) Box plot showing DNA methylation levels of maternal and paternal imprinting in pESC-PGCLCs, ESC-PGCLCs, E9.5 PGCs and E12.5 PGCs. (F) Box plot showing global DNA methylation levels of X chromosomes in pESC-PGCLCs, ESC-PGCLCs, E9.5 PGCs and E12.5 PGCs. Data shown as mean ± SEM. *P < 0.05, **P < 0.01; ***P < 0.001. RRBS analysis represents two biological replicates
Figure 5
Figure 5
Fertile mice produced from oocytes of pESCs. (A) Normal synaptonemal complex in pESC-and ESC-derived meiocytes 5 days following transplantation of the PGCLCs aggregates based on pachytene spread by super high-resolution microscopy (SIM). Scale bar = 5 μm. (B) Statistics of MLH1 foci per cell at pachytene stage in meiocytes derived from pESC- or ESC-PGCLCs. Scale bar = 5 μm. (C) Morphology and Actin-GFP expression of reconstituted ovaries. Scale bar = 1 mm. (D) Folliculogenesis of pESC- and ESC-derived reconstituted ovaries by H&E staining. Scale bar = 100 μm. (E) Follicle count of pESC- and ESC-reconstituted ovaries 28 days following transplantation of the aggregates into kidney capsule. Data shown as Mean ± SEM (n = 4). *P < 0.05. (F) GV oocytes isolated from pESC- and ESC-reconstituted ovaries, and 2-cell embryos after IVM and IVF. Scale bar = 50 μm. (G) Healthy adult mouse produced from pESC-PGCLCs derived oocytes following IVM and IVF. (H) Genotyping analysis of the pups by microsatellite primers D8mit94 and D12Mit136. DNA was isolated from tail tip tissues. (I) Offspring of pESC-PGCLCs derived mice by mating with albino ICR mice. (J) Similar litter size and body weight of pups produced from oocytes of pESCs and ESCs in comparison with those of wild-type (/in vivo) mice served as a control. (K) Combined bisulfite restriction analysis (COBRA) of typical imprints H19/Igf2 of tail tissue from ESC- and pESC-PGCLC derived mice (n = 2). Wild-type (WT) mice from normal breeding at the same background served as control. PCR products were either digested (D) or undigested (U) with the respective enzyme. The digested and undigested fragments are indicated by black and white triangles, respectively. Right panel, Methylation level analysis of COBRA by Image J. (L) COBRA of typical imprints H19/Igf2 of the tail tissue from the offspring derived from ESC- and pESC-PGCLC derived mice (n = 8). Right panel, Methylation level analysis of COBRA by Image J (n = 8)

References

    1. Baker SM, Plug AW, Prolla TA, Bronner CE, Harris AC, Yao X, Christie DM, Monell C, Arnheim N, Bradley A, Ashley T, Liskay RM. Involvement of mouse Mlh1 in DNA mismatch repair and meiotic crossing over. Nat Genet. 1996;13:336–342. - PubMed
    1. Barlow DP, Bartolomei MS. Genomic imprinting in mammals. Cold Spring Harb Perspect Biol. 2014 doi: 10.1101/cshperspect.a018382. - DOI - PMC - PubMed
    1. Barton SC, Surani MA, Norris ML. Role of paternal and maternal genomes in mouse development. Nature. 1984;311:374–376. - PubMed
    1. Blasco MA, Serrano M, Fernandez-Capetillo O. Genomic instability in iPS: time for a break. EMBO J. 2011;30:991–993. - PMC - PubMed
    1. Buccione R, Schroeder AC, Eppig JJ. Interactions between somatic cells and germ cells throughout mammalian oogenesis. Biol Reprod. 1990;43:543–547. - PubMed

Publication types