. 2021 Nov 30:10:e68605.
doi: 10.7554/eLife.68605.

TCR meta-clonotypes for biomarker discovery with tcrdist3 enabled identification of public, HLA-restricted clusters of SARS-CoV-2 TCRs

Affiliations

TCR meta-clonotypes for biomarker discovery with tcrdist3 enabled identification of public, HLA-restricted clusters of SARS-CoV-2 TCRs

Koshlan Mayer-Blackwell et al. Elife. .

Abstract

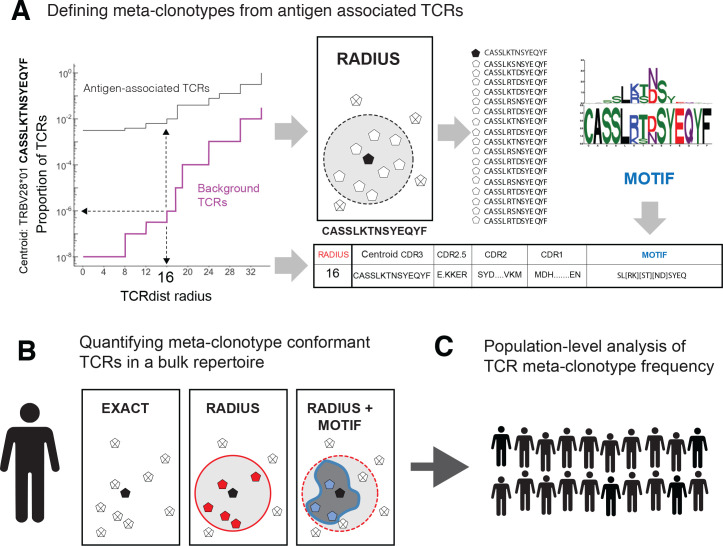
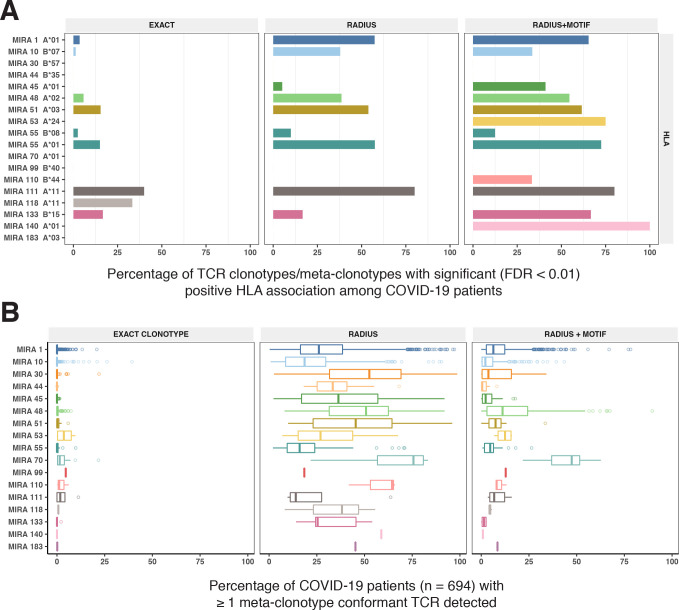
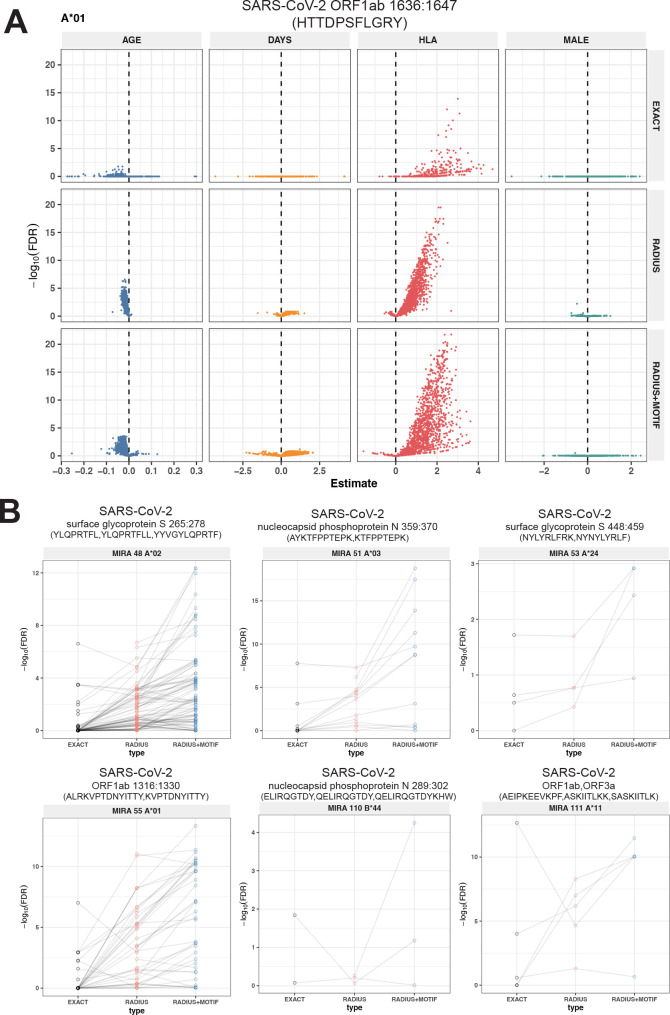
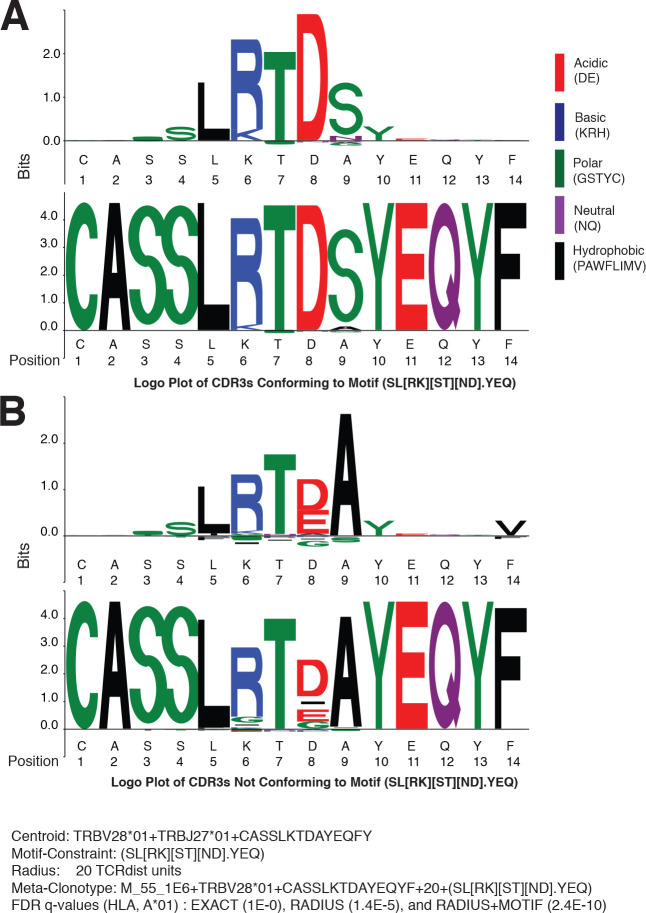
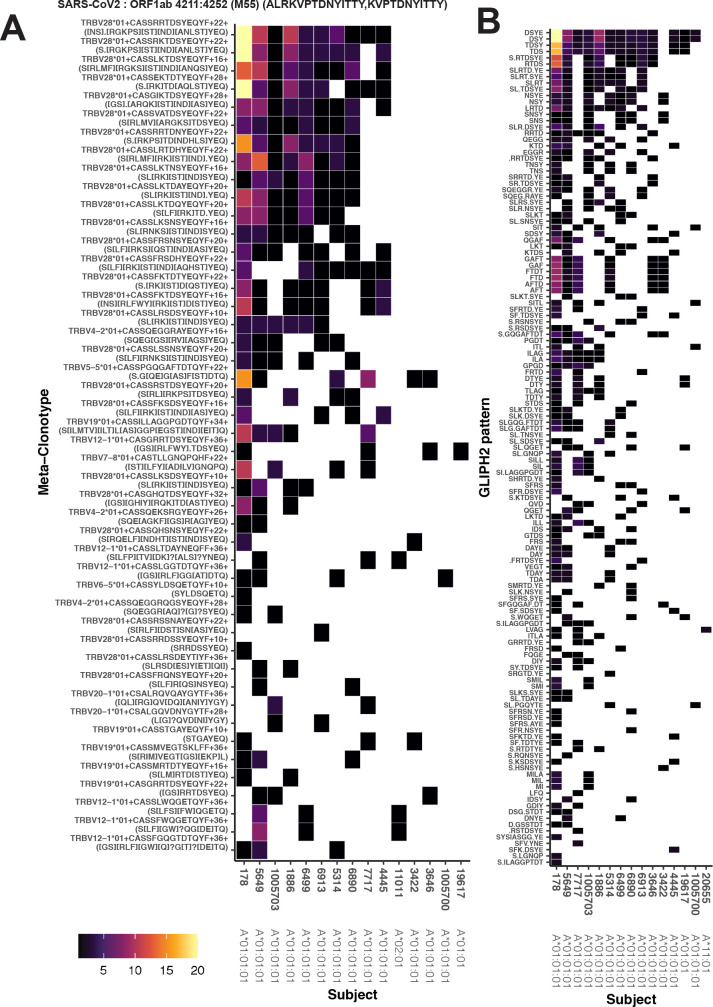
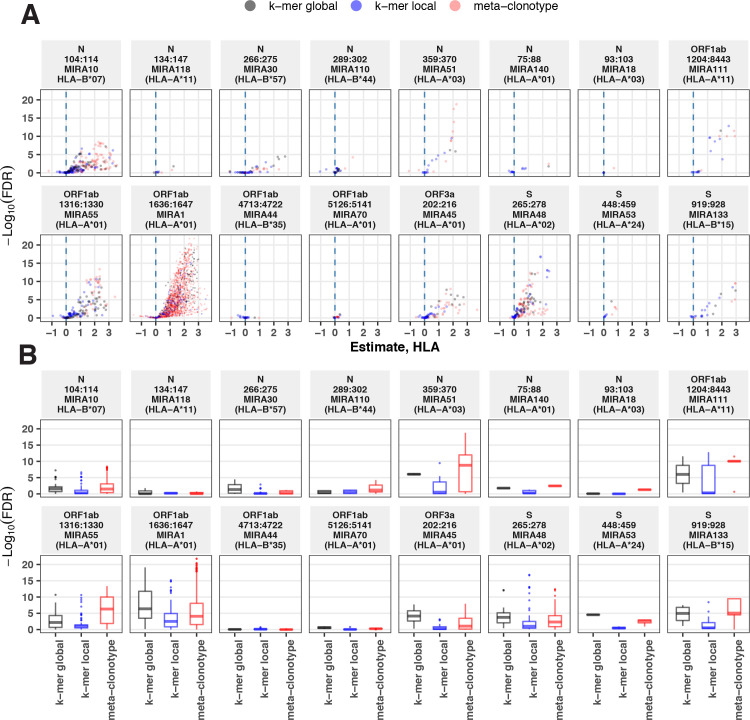
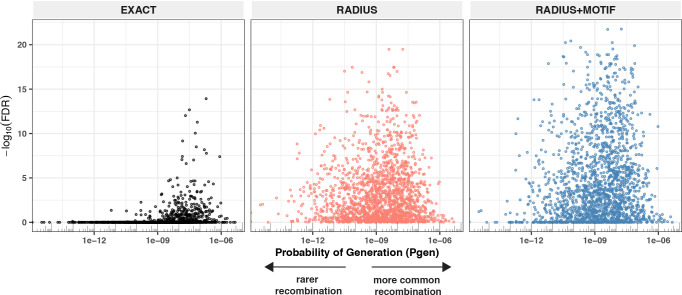
T-cell receptors (TCRs) encode clinically valuable information that reflects prior antigen exposure and potential future response. However, despite advances in deep repertoire sequencing, enormous TCR diversity complicates the use of TCR clonotypes as clinical biomarkers. We propose a new framework that leverages experimentally inferred antigen-associated TCRs to form meta-clonotypes - groups of biochemically similar TCRs - that can be used to robustly quantify functionally similar TCRs in bulk repertoires across individuals. We apply the framework to TCR data from COVID-19 patients, generating 1831 public TCR meta-clonotypes from the SARS-CoV-2 antigen-associated TCRs that have strong evidence of restriction to patients with a specific human leukocyte antigen (HLA) genotype. Applied to independent cohorts, meta-clonotypes targeting these specific epitopes were more frequently detected in bulk repertoires compared to exact amino acid matches, and 59.7% (1093/1831) were more abundant among COVID-19 patients that expressed the putative restricting HLA allele (false discovery rate [FDR]<0.01), demonstrating the potential utility of meta-clonotypes as antigen-specific features for biomarker development. To enable further applications, we developed an open-source software package, tcrdist3, that implements this framework and facilitates flexible workflows for distance-based TCR repertoire analysis.

Keywords: SARS-CoV-2; T cell receptor; biomarkers; computational biology; human; immune repertoire; immunology; inflammation; software; systems biology.


Conflict of interest statement

KM, SS, LC, AS, JG, AF No competing interests declared, JC JCC served as unpaid consultant for 10X Genomics on the initial analysis of the 10x_200k dataset. TH TH has equity in Poold Diagnostics. PT is on the Scientific Advisory Boards of Immunoscape and Cytoagents, consulted for Elevate Bio and PACT Pharma, and has received travel costs and speaking fees from 10X Genomics and Illumina. PT served as unpaid consultant for 10X Genomics on the initial analysis of the 10x_200k dataset. PT also has filed patents on methods for sequencing and cloning TCRs (International PCT applications published December 24, 2020 as WO 2020/257575 and January 7, 2021 as WO 2021/003114). These applications are pending and have not yet been granted. PB served as unpaid consultant for 10X Genomics on the initial analysis of the 10x_200k dataset.

Figures

Figure 1.
Figure 1.. T-cell receptor (TCR) meta-clonotypes.
(A) Defining meta-clonotypes from antigen-associated TCRs. Sets of antigen-associated TCRs were used together with synthetic background repertoires to engineer TCR meta-clonotypes that define biochemically similar TCRs based on a centroid TCR and a TCRdist radius. For each antigen-specific clonotype, we used tcrdist3 to evaluate the proportion of TCRs spanned at different TCRdist radii within (i) its antigen-associated TCR set (black) and (ii) a synthetic control V- and J-gene-matched background set (purple). A synthetic background was generated using 100,000 Optimized Likelihood estimate of Immunoglobulin Amino acid sequences (OLGA)-generated TCRs and 100,000 TCRs subsampled from umbilical cord blood; OLGA-generated TCRs were sampled to match the V–J gene frequency in each MIRA receptor set, with weighting to account for the sampling bias (see Methods for details). The objective was to select the largest radius that includes no more than an estimated proportion of 1E−6 TCRs in the background. The subset of antigen-associated TCRs spanned by the selected radius were then used to develop an additional meta-clonotype motif constraint based on conserved residues in the complementarity determining region (CDR)3 (see Methods for details). An example logo plot shows the CDR3 β-chain motif formed from TCRs – activated by a SARS-CoV-2 peptide (MIRA55 ORF1ab amino acids 1316:1330, ALRKVPTDNYITTY) – within a TCRdist radius 16 of this meta-clonotype’s centroid TCR. (B) Quantifying meta-clonotype conformant TCRs in bulk repertoires. The definition of each TCR meta-clonotype can be used to quantify the frequency of similar TCRs in bulk repertoires. EXACT sequences match the meta-clonotype centroid at the amino acid level, RADIUS-conformant sequences diverge from the centroid by no more than the radius distance, and RADIUS + MOTIF conformant sequences is the subset of radius-conformant TCRs with a CDR3 sequences matching the meta-clonotype’s CDR3 motif. (C) Population-level analysis of TCR meta-clonotype frequency. The frequency of meta-clonotype conformant sequences in multiple bulk repertoires allows comparison across a population. In this study, to test whether meta-clonotypes carry important antigen-specific signals above and beyond individual clonotypes, we searched for meta-clonotype conformant TCRs in COVID-19 patients with repertoires collected 0–30 days after diagnosis. We found stronger associations with predicted HLA restrictions based on counts of meta-clonotype conforming TCRs compared to associations using counts of exact clonotypes.
Figure 2.
Figure 2.. TCRdist compared to edit distance.
(A) Correspondence between edit distance (x-axis) and TCRdist (y-axis) for MIRA55 T-cell receptors (TCRs) with matching TRBV genes. The grayscale colormap shows the percentage of TCRs with a given TCRdist score within each edit distance category. (B) Examples of complementarity determining region (CDR)3s with TCRdist varying between 6 and 24 units among sequences with edit distance 2 (2 substitutions) from a centroid with matching TRBV genes. TCR distances range based on differential penalties assigned to specific residue substitutions.
Figure 3.
Figure 3.. Experimental enrichment of antigen-associated T-cell receptors (TCRs) increases neighbor density.
(A) TCR repertoire subsets obtained by single-cell sorting with peptide–major histocompatibility complex (MHC) tetramers (green), MIRA peptide stimulation enrichment (MIRA55, MIRA48; purple), or random subsampling of umbilical cord blood (1000 or 10,000 TCRs; blue). Biochemical distances were computed among all pairs of TCRs in each subset using the TCRdist metric. Neighborhoods were formed around each TCR using a variable radius (x-axis) and the percent of TCRs in the set with at least one other TCR within its neighborhood was computed; notably the line represents a summary of TCRs in each set and is therefore more precise for larger TCR sets. A radius of zero indicates the proportion of TCRs that have at least one TCR with an identical amino acid sequence (solid square). Dash BMLF (Epstein–Barr Virus), M1 (Influenza), and pp65 (Cytomegalovirus) refer to epitopes from Dash et al., 2017. ELAGIGILTV (Human Mart-1 antigen) and LLLGIFILV (HM1.24 antigen in multiple myeloma) downloaded from VDJdb (Shugay et al., 2018), which were submitted by Andrew Sewell et al. (B) Analysis of MIRA sets for which the participants contributing the TCRs were significantly enriched with a specific class I HLA allele Supplementary file 1c. Colors are assigned based on the vertical ranking of the lines along the right y-axis and match the order in the color legend.
Figure 4.
Figure 4.. T-cell receptor (TCR) neighborhoods have higher density among TCRs that have been experimentally enriched for antigen-specific T cells compare to unenriched repertoires.
TCR β-chains from (A) a peptide–major histocompatibility complex (MHC) tetramer-enriched subrepertoire (n = 247), (B) a MIRA peptide stimulation-enriched subrepertoire (n = 497), or (C) an umbilical cord blood unenriched repertoire (n = 9966), and (D) synthetically generated sequences using Optimized Likelihood estimate of Immunoglobulin Amino acid sequences (OLGA; n = 10,000; Sethna et al., 2019). Within each subrepertoire, an empirical cumulative distribution function (ECDF) was estimated for each TCR (one line) acting as the centroid of a neighborhood over a range of distance radii (x-axis). Each ECDF shows the proportion of TCRs within the set with a distance to the centroid less than the indicated radius. ECDF color corresponds to the length of the complementarity determining region (CDR)3-β loop. ECDF curves were randomly shifted by <1 unit along the x-axis to reduce overplotting. Vertical ECDF lines starting at 10−4 indicate no similar TCRs at or below that radius. Percentage of TCRs with an ECDF proportion <10−3 (bottom panels), indicates the percentage of TCRs without, or with very few biochemically similar neighbors at the given radius.
Figure 5.
Figure 5.. Radius-defined neighborhood densities within an antigen-associated and a synthetic background repertoire.
(A) Each T-cell receptor (TCR) (one line, n = 497) in the MIRA55 antigen-associated set acts as the centroid of a neighborhood and an empirical cumulative distribution function (ECDF) is estimated over a range of distance radii (x-axis). Each ECDF shows the proportion of TCRs within the MIRA set having a distance to the centroid less than the indicated radius. The ECDF line color corresponds to the TCR probability of generation (pgen) estimated using Optimized Likelihood estimate of Immunoglobulin Amino acid sequences (OLGA; Sethna et al., 2019). The ECDF curves are randomly shifted by <1 unit along the x-axis to reduce overplotting. The bottom panel shows the percentage of TCRs with an ECDF proportion <10−3. (B) Estimated ECDF for each MIRA55 TCR based on the proportion of TCRs in a synthetic background repertoire that are within the indicated radius (x-axis). A synthetic background was generated using 100,000 OLGA-generated TCRs and 100,000 TCRs subsampled from umbilical cord blood; OLGA-generated TCRs were sampled to match the V–J gene frequency in the MIRA 55 receptor set, with weighting to account for the sampling bias (see Methods for details). (C) Antigen-associated ECDF (y-axis) of one example TCR’s neighborhood (red line) plotted against ECDF within the synthetic background (x-axis). Example TCR neighborhood is the same indicated by the red line in (A) and (B). The dashed gray line indicates neighborhoods that are equally dense with TCRs from the antigen-associated and background subrepertoires. Annotations indicate the meta-clonotype radius for each data point in TCRdist units.
Figure 6.
Figure 6.. Publicity analysis in MIRA participants of CD8+ T-cell receptor (TCR) β-chain features activated by SARS-CoV-2 peptide ORF1ab (MIRA55) predicted to bind HLA-A*01.
The grid shows all features that were present in two or more MIRA participants. TCR feature publicity across individuals was assessed using two methods: (1) tcrdist3 meta-clonotypes (rectangles) – inclusion criteria defined by a centroid TCR and all TCRs within an optimized TCRdist radius selected to span <10−6 TCRs in a bulk-sequenced background repertoire, and (2) exact public clonotypes (circles) are defined by matching TRBV gene usage and identical complementarity determining region (CDR)3 amino acid sequence. Per subject, the color-scale shows the meta-clonotype conformant clone with the highest probability of generation (pgen). All TCRs captured by a ‘redundant’ meta-clonotypes were completely captured by a higher-ranked meta-clonotype. Redundant meta-clonotypes were not subsequently evaluated.
Figure 7.
Figure 7.. Sensitivity of optimized meta-clonotype radius to background size and specification.
(A) Radius estimates for MIRA55 T-cell receptors (TCRs) using different synthetic backgrounds: (i) randomly generated TCRs from Optimized Likelihood estimate of Immunoglobulin Amino acid sequences (OLGA; Sethna et al., 2019), (ii) V–J gene-matched sequences generated with OLGA, and (iii) an equal mixture of V–J gene-matched sequences with randomly sampled cord blood TCRs. We compare the estimates generated with the three synthetic backgrounds (of total size 50 , 100 , 200 , and 500 K) to the radii estimates derived using 1 million cord blood TCRs uniformly sampled from eight donors. Weights were applied to correct for biased sampling as described in the paper. (B) Evaluation of bias in radius estimates based on background size. Here, we compared bias in subsampled estimate to the estimate derived from a synthetic background of 2 million TCRs (50 % [1 million] cord blood and 50 % [1 million] V–J gene-matched sequences synthesized with OLGA). For each background size, we drew 10 subsamples from the 2 million TCR set.
Figure 8.
Figure 8.. HLA restriction of T-cell receptor (TCR) clonotypes and meta-clonotypes in bulk-sequenced TCRβ repertoires of COVID-19 patients.
(A) Percentage of TCR features with a statistically significant (false discovery rate [FDR] <0.01) association with a restricting HLA allele. We tested for associations between patients’ inferred genotype and TCR feature abundance using beta-binomial regression controlling for age, sex, and days since COVID-19 diagnosis. (B) For each clonotype/meta-clonotype, the percent of bulk repertoires from COVID-19 patients (n = 694) containing TCRs meeting the criteria defined by (1) EXACT (TCRs matching the centroid TRBV gene and amino acid sequence of the complementarity determining region [CDR]3), (2) RADIUS (TCR centroid with inclusion criteria defined by an optimized TCRdist radius), or (3) RADIUS + MOTIF (inclusion criteria defined by TCR centroid, optimized radius, and the CDR3 motif constraint). See Figure 1 and Methods for details. Meta-clonotype radii were engineered using synthesized backgrounds developed for each MIRA set. Each background contained 100,000 Optimized Likelihood estimate of Immunoglobulin Amino acid sequences (OLGA)-generated TCRs and 100,000 TCRs subsampled from umbilical cord blood; OLGA-generated TCRs were sampled to match to the V–J gene frequency in each MIRA receptor set (i.e., MIRA1, 10, 30, 44, 45, 48, 51, 53, 55, 70, 99, 110, 111,118, 133, 140, or 183) with weighting to account for the sampling bias (see Methods for details).
Figure 9.
Figure 9.. Associations of T-cell receptor (TCR) features with participant age, days postdiagnosis, HLA genotype, and sex in TCR β-chain repertoires of COVID-19 patients (n = 694).
(A) Beta-binomial regression coefficient estimates (x-axis) and negative log10 false discovery rates (y-axis) for features developed from CD8+ TCRs activated by SARS-CoV-2 MIRA55 ORF1ab amino acids 1636:1647, HTTDPSFLGRY. The abundances of meta-clonotype conformant TCRs are more robustly associated with predicted HLA type than for exact clonotypes. (B) Signal strength indicating a positive association between the HLA genotype (two-digit) with TCR β-chain clonotypes (EXACT) and meta-clonotype conformant TCRs (RADIUS or RADIUS + MOTIF), where the restricting HLA genotype was inferred from independent data: (i) MIRA48, (ii) MIRA51, (iii) MIRA53, (iv) MIRA55, (v) MIRA110, and (vi) MIRA111 (Supplementary file 1f). Each set of three symbols connected by a line represents an evaluation TCRs conformant to an individual clonotype or a meta-clonotype. Models were estimated with counts of productive TCRs matching a clonotype (EXACT) or conforming to a meta-clonotype (RADIUS or RADIUS + MOTIF) with the following definitions: (1) EXACT (inclusion of TCRs matching the centroid TRBV gene and amino acid sequence of the complementarity determining region [CDR]3), (2) RADIUS (inclusion criteria defined by a TCR centroid and optimized TCRdist radius), and (3) RADIUS + MOTIF (inclusion criteria defined by TCR centroid, optimized radius, and CDR3 motif constraint). See Methods for details. Meta-clonotype radii were engineered using synthesized backgrounds developed for each MIRA set. Each background contained 100,000 Optimized Likelihood estimate of Immunoglobulin Amino acid sequences (OLGA)-generated TCRs and 100,000 TCRs subsampled from umbilical cord blood; OLGA-generated TCRs were sampled to match to the V–J gene frequency in each MIRA receptor set (i.e., MIRA1, 48, 51, 53, 55, 110, or 111) with weighting to account for the sampling bias (see Methods for details).
Figure 10.
Figure 10.. Meta-clonotypes provide opportunities to investigate basis of antigen specificity.
Logo plots of T-cell receptors (TCRs) from bulk repertoires of acute and convalescent COVID-19 patients (n = 694) within 20 TCRdist units of MIRA-identified TCR β-chain meta-clonotype M_55_1E6+ TRBV28*01+ CASSLKTDAYEQYF + 20+(SL[RK][ST][ND].YEQ) centroid. (A) Logo plot of TCRs with complementarity determining region (CDR)3 conforming to motif-constraint (SL[RK][ST][ND].YEQ), and (B) logo plot of TCRs with CDR3 that do not conform to the motif constraint. The MIRA55 antigen-associated TCR set used to learn the motif included 21 antigen-associated TCRs from 10 subjects. In both panels (A) and (B), the upper logo motif depicts a ‘background-adjusted’ logo plot showing the position-specific Kullback–Leibler divergence from an alignment of background CDR3s that were sampled from cord blood TCRs using the same TRBV and TRBJ genes. Lower logo motifs show position-specific amino acid usage. To accommodate CDR3s of different length in the logo plot we aligned each CDR3 to the centroid. The background-adjusted logos are constructed by randomly sampling TCR beta receptors from cord blood with the same TRBV- and TRBJ-gene usage, with 100 V–J-matched TCRs sampled for every receptor in the foreground set.
Figure 11.
Figure 11.. Publicity and breadth analysis of CD8+ T-cell receptor (TCR) β-chain features activated by SARS-CoV-2 peptide ORF1ab (MIRA55) using tcrdist3 and GLIPH2.
TCR feature publicity was determined using two methods for clustering similar TCR sequences: (A) tcrdist3-identified meta-clonotypes and (B) GLIPH2 specificity groups, sets of TCRs with a shared complementarity determining region (CDR)3 k-mer pattern uncommon in the program’s default background CD8+ receptor data. Grid fill color shows the breadth – or number of conformant clones – within the MIRA-identified clones from each patient.
Figure 12.
Figure 12.. Associations between HLA genotypes in COVID-19 patients and abundance of epitope-specific complementarity determining region (CDR)3 k-mers or meta-clonotypes.
(A) Beta-binomial regression coefficient estimates (x-axis) for participant genotype matching a hypothesized restricting HLA allele and negative log10 false discovery rates (FDRs; y-axis) for features developed from CD8+ T-cell receptors (TCRs) activated by one of 17 HLA-restricted SARS-CoV-2 epitopes found in ORF1ab, ORF3a, nucleocapsid (N), and surface glycoprotein (S). MIRA183 yielded no significant meta-clonotypes (results not shown). Regression models included age, sex, and days postdiagnosis as covariates (not shown). Positive HLA coefficient estimates correspond with greater abundance of the TCR feature in those patients expressing the restricting allele. (B) Distribution of FDRs by feature identification method (k-mer local, k-mer global, or meta-clonotype [RADIUS + MOTIF]). Larger negative log10-tranformed FDR values (y-axis) indicate more statistically significant associations. Local k-mer (e.g., FRTD) and global k-mer (e.g., SFRTD.YE) were identified using GLIPH2 (Huang et al., 2020) and were used to quantify counts of conforming TCRs in each bulk-sequenced COVID-19 repertoire (see Method for details).
Figure 13.
Figure 13.. Detectable HLA association and complementarity determining region (CDR)3 probability of generation.
We evaluated 1831 meta-clonotypes from 17 MIRA sets in a cohort of 694 COVID-19 patients for their association with predicted HLA-restricting alleles. Statistical evidence of the HLA association for each meta-clonotype (RADIUS or RADIUS + MOTIF) and the centroid alone (EXACT) is indicated by the associated false discovery rate (FDR; y-axis) in beta-binomial regressions (see Methods for model details). The probability of generation (pgen) of each centroid’s CDR3-β was estimated using the software OLGA (x-axis). Using exact matching, only associations with high probability of generation (pgen) antigen-specific T-cell receptors (TCRs) are likely to be detected reliably. However, using meta-clonotypes, tcrdist3 revealed strong evidence of HLA-restriction for TCRs with both high and low probability of generation. Meta-clonotype radii were engineered using synthesized backgrounds developed for each MIRA set. Each background contained 100,000 Optimized Likelihood estimate of Immunoglobulin Amino acid sequences (OLGA)-generated TCRs and 100,000 TCRs subsampled from umbilical cord blood; OLGA-generated TCRs were sampled to match to the V–J gene frequency in each MIRA receptor set with weighting to account for the sampling bias (see Methods for details).

Update of

Similar articles

Cited by

References

    1. Ahmadzadeh M, Pasetto A, Jia L, Deniger DC, Stevanović S, Robbins PF, Rosenberg SA. Tumor-infiltrating human CD4+ regulatory T cells display a distinct TCR repertoire and exhibit tumor and neoantigen reactivity. Science Immunology. 2019;4:eaao4310. doi: 10.1126/sciimmunol.aao4310. - DOI - PMC - PubMed
    1. Britanova OV, Shugay M, Merzlyak EM, Staroverov DB, Putintseva EV, Turchaninova MA, Mamedov IZ, Pogorelyy MV, Bolotin DA, Izraelson M, Davydov AN, Egorov ES, Kasatskaya SA, Rebrikov DV, Lukyanov S, Chudakov DM. Dynamics of Individual T Cell Repertoires: From Cord Blood to Centenarians. Journal of Immunology. 2016;196:5005–5013. doi: 10.4049/jimmunol.1600005. - DOI - PubMed
    1. Cao K, Wu J, Li X, Xie H, Tang C, Zhao X, Wang S, Chen L, Zhang W, An Y, Li X, Lin L, Chai R, Fang M, Yue Y, Wang X, Ding Y, Zhou L, Zhao Q, Yang H, Wang J, He S, Liu X. T-cell receptor repertoire data provides new evidence for hygiene hypothesis of allergic diseases. Allergy. 2020;75:681–683. doi: 10.1111/all.14014. - DOI - PubMed
    1. Chiou S-H, Tseng D, Reuben A, Mallajosyula V, Molina IS, Conley S, Wilhelmy J, McSween AM, Yang X, Nishimiya D, Sinha R, Nabet BY, Wang C, Shrager JB, Berry MF, Backhus L, Lui NS, Wakelee HA, Neal JW, Padda SK, Berry GJ, Delaidelli A, Sorensen PH, Sotillo E, Tran P, Benson JA, Richards R, Labanieh L, Klysz DD, Louis DM, Feldman SA, Diehn M, Weissman IL, Zhang J, Wistuba II, Futreal PA, Heymach JV, Garcia KC, Mackall CL, Davis MM. Global analysis of shared T cell specificities in human non-small cell lung cancer enables HLA inference and antigen discovery. Immunity. 2021;54:586–602. doi: 10.1016/j.immuni.2021.02.014. - DOI - PMC - PubMed
    1. Coles CH, Mulvaney RM, Malla S, Walker A, Smith KJ, Lloyd A, Lowe KL, McCully ML, Martinez Hague R, Aleksic M, Harper J, Paston SJ, Donnellan Z, Chester F, Wiederhold K, Robinson RA, Knox A, Stacey AR, Dukes J, Baston E, Griffin S, Jakobsen BK, Vuidepot A, Harper S. TCRs with Distinct Specificity Profiles Use Different Binding Modes to Engage an Identical Peptide-HLA Complex. Journal of Immunology. 2020;204:1943–1953. doi: 10.4049/jimmunol.1900915. - DOI - PMC - PubMed

Publication types