. 2021 Dec 14;93(49):16456-16465.
doi: 10.1021/acs.analchem.1c03442. Epub 2021 Nov 30.

Cisplatin Uptake in Macrophage Subtypes at the Single-Cell Level by LA-ICP-TOFMS Imaging

Affiliations

Cisplatin Uptake in Macrophage Subtypes at the Single-Cell Level by LA-ICP-TOFMS Imaging

Anna Schoeberl et al. Anal Chem. .

Abstract

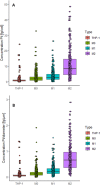
A high-throughput laser ablation-inductively coupled plasma-time-of-flight mass spectrometry (LA-ICP-TOFMS) workflow was implemented for quantitative single-cell analysis following cytospin preparation of cells. For the first time, in vitro studies on cisplatin exposure addressed human monocytes and monocyte-derived macrophages (undifferentiated THP-1 monocytic cells, differentiated M0 macrophages, as well as further polarized M1 and M2 phenotypes) at the single-cell level. The models are of particular interest as macrophages comprise the biggest part of immune cells present in the tumor microenvironment and play an important role in modulating tumor growth and progression. The introduced bioimaging workflow proved to be universally applicable to adherent and suspension cell cultures and fit-for-purpose for the quantitative analysis of several hundreds of cells within minutes. Both, cross-validation of the method with single-cell analysis in suspension for THP-1 cells and with LA-ICP-TOFMS analysis of adherent M0 cells grown on chambered glass coverslips, revealed agreeing platinum concentrations at the single-cell level. A high incorporation of cisplatin was observed in M2 macrophages compared to the M0 and M1 macrophage subtypes and the monocyte model, THP-1. The combination with bright-field images and monitoring of highly abundant endogenous elements such as phosphorus and sodium at a high spatial resolution allowed assessing cell size and important morphological cell parameters and thus straightforward control over several cell conditions. This way, apoptotic cells and cell debris as well as doublets or cell clusters could be easily excluded prior to data evaluation without additional staining.


Conflict of interest statement

The authors declare no competing financial interest.

Figures

Figure 1
Figure 1
(A) Bright-field image of THP-1 cells prepared by cytospin prior to ablation. Signal intensity maps of (B) 23Na+ and (C) 31P+, obtained by LA-ICP-TOFMS imaging. (D) Map of the total amount of Pt (fg) in THP-1 cells after treatment with 10 μM cisplatin for 6 h. The following laser ablation parameters were used: square laser spot size of 5 μm, fixed dosage mode of 2, repetition rate of 200 Hz, and the parallel lines overlapped one another by 2.5 μm. (E) Box plot depicting the concentration of Pt in THP-1 cells treated with 10 μM cisplatin for 6 h obtained by LA-ICP-TOFMS (orange) or SC-ICP-TOFMS analysis (blue). The validation is based on ∼1000 cells for LA-ICP-TOFMS and ∼20 000 cells for solution-based analysis.
Figure 2
Figure 2
Bright-field images (left) and maps of the total amount of Pt (fg) obtained by LA-ICP-TOFMS imaging (right) of M0 macrophages, based on (A) chambered glass coverslips and (B) cytospins. The following laser ablation parameters were used: square laser spot size of 5 μm, fixed dosage mode of 2, repetition rate of 200 Hz, and the parallel lines overlapped one another by 2.5 μm. (C) Box plot showing the concentration of Pt in M0 macrophages treated with 10 μM cisplatin for 6 h obtained by LA-ICP-TOFMS analysis of chambered glass coverslips (left) and cytospins (right). The validation is based on ∼200 cells for chambered glass coverslips and ∼600 cells for cytospins.
Figure 3
Figure 3
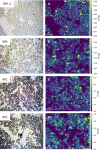
Bright-field images of THP-1, M0, M1, and M2 cells prepared by cytospins prior to ablation (left row). Maps of the total amount of Pt (fg) in (A) THP-1, (B) M0, (C) M1, and (D) M2 cells after treatment with 10 μM cisplatin for 6 h obtained by LA-ICP-TOFMS imaging (right row). The following laser ablation parameters were used: square laser spot size of 5 μm, fixed dosage mode of 2, repetition rate of 200 Hz, and the parallel lines overlapped one another by 2.5 μm. The images were scaled for the best contrast and not for a uniform scale of the Pt concentration.
Figure 4
Figure 4
Box plots showing (A) the concentration of Pt cell–1 and (B) the concentration of Pt normalized by the cell size of single THP-1, M0, M1, and M2 cells treated with 10 μM cisplatin for 6 h and measured by LA-ICP-TOFMS. The following laser ablation parameters were used: square laser spot size of 5 μm, fixed dosage mode of 2, repetition rate of 200 Hz, and the parallel lines overlapped one another by 2.5 μm. The results are based on ∼900 cells for THP-1 monocytes, ∼600 cells for M0 and M1, and ∼400 cells for M2 macrophages.

References

    1. Mueller L.; Traub H.; Jakubowski N.; Drescher D.; Baranov V. I.; Kneipp J. Trends in Single-Cell Analysis by Use of ICP-MS. Anal. Bioanal. Chem. 2014, 406, 6963–6977. 10.1007/s00216-014-8143-7. - DOI - PubMed
    1. Theiner S.; Loehr K.; Koellensperger G.; Mueller L.; Jakubowski N. Single-Cell Analysis by Use of ICP-MS. J. Anal. At. Spectrom. 2020, 35, 1784–1813. 10.1039/D0JA00194E. - DOI
    1. Corte Rodríguez M.; Álvarez-Fernández García R.; Blanco E.; Bettmer J.; Montes-Bayón M. Quantitative Evaluation of Cisplatin Uptake in Sensitive and Resistant Individual Cells by Single-Cell ICP-MS (SC-ICP-MS). Anal. Chem. 2017, 89, 11491–11497. 10.1021/acs.analchem.7b02746. - DOI - PubMed
    1. Zheng L.-N.; Wang M.; Zhao L.-C.; Sun B.-Y.; Wang B.; Chen H.-Q.; Zhao Y.-L.; Chai Z.-F.; Feng W.-Y. Quantitative Analysis of Gd@C82(OH)22 and Cisplatin Uptake in Single Cells by Inductively Coupled Plasma Mass Spectrometry. Anal. Bioanal. Chem. 2015, 407, 2383–2391. 10.1007/s00216-014-8422-3. - DOI - PubMed
    1. López-Serrano Oliver A.; Baumgart S.; Bremser W.; Flemig S.; Wittke D.; Grützkau A.; Luch A.; Haase A.; Jakubowski N. Quantification of Silver Nanoparticles Taken up by Single Cells Using Inductively Coupled Plasma Mass Spectrometry in the Single Cell Measurement Mode. J. Anal. At. Spectrom. 2018, 33, 1256–1263. 10.1039/C7JA00395A. - DOI

Publication types