

Measuring Temporal and Spatial Variability of Red Blood Cell Velocity in Human Retinal Vessels
- PMID: 34846516
- PMCID: PMC8648047
- DOI: 10.1167/iovs.62.14.29
Measuring Temporal and Spatial Variability of Red Blood Cell Velocity in Human Retinal Vessels
Abstract
Purpose: The retinal circulation regulates blood flow through various internal and external factors; however, it is unclear how locally these factors act within the retinal microcirculation. We measured the temporal and spatial variability of blood velocity in small retinal vessels using a dual-beam adaptive optics scanning laser ophthalmoscope.
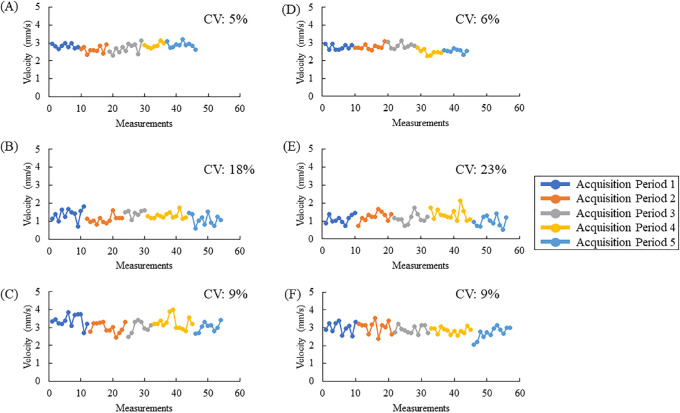
Methods: In young healthy subjects (n = 3), temporal blood velocity variability was measured in a local vascular region consisting of an arteriole, capillary, and venule repeatedly over 2 days. Data consisted of 10 imaging periods separated into two sessions: (1) five 6-minute image acquisition periods with 30-minute breaks, and (2) five 6-minute image acquisition periods with 10-minute breaks. In another group of young healthy subjects (n = 5), spatial distribution of velocity variability was measured by imaging three capillary segments during three 2-minute conditions: (1) baseline imaging condition (no flicker), (2) full-field flicker, and (3) no flicker condition again.
Results: Blood velocities were measurable in all subjects with a reliability of about 2%. The coefficient of variation (CV) was used as an estimate of the physiological variability of each vessel. Over 2 days, the average CV in arterioles was 7% (±2%); in capillaries, it was 19% (±6%); and, in venules, it was 8% (±2%). During flicker stimulation, the average capillary CV was 16% during baseline, 15% during flicker stimulation, and 18% after flicker stimulation.
Conclusions: Capillaries in the human retina exhibit spatial and temporal variations in blood velocity. This inherent variation in blood velocity places limits on studying the vascular regulation of individual capillaries, and the study presented here serves as a foundation for future endeavors.
Conflict of interest statement
Disclosure:
Figures


Similar articles
-
Full-field flicker evoked changes in parafoveal retinal blood flow.Sci Rep. 2020 Sep 29;10(1):16051. doi: 10.1038/s41598-020-73032-0. Sci Rep. 2020. PMID: 32994535 Free PMC article.
-
A High-Fidelity Computational Model for Predicting Blood Cell Trafficking and 3D Capillary Hemodynamics in Retinal Microvascular Networks.Invest Ophthalmol Vis Sci. 2024 Nov 4;65(13):37. doi: 10.1167/iovs.65.13.37. Invest Ophthalmol Vis Sci. 2024. PMID: 39546289 Free PMC article.
-
Effect of Diffuse Luminance Flicker Light Stimulation on Total Retinal Blood Flow Assessed With Dual-Beam Bidirectional Doppler OCT.Invest Ophthalmol Vis Sci. 2017 Feb 1;58(2):1167-1178. doi: 10.1167/iovs.16-20598. Invest Ophthalmol Vis Sci. 2017. PMID: 28245297
-
Retinal capillary perfusion: Spatial and temporal heterogeneity.Prog Retin Eye Res. 2019 May;70:23-54. doi: 10.1016/j.preteyeres.2019.01.001. Epub 2019 Feb 13. Prog Retin Eye Res. 2019. PMID: 30769149 Review.
-
Retinal blood flow evaluation.Ophthalmologica. 2013;229(2):61-74. doi: 10.1159/000338186. Epub 2012 Dec 18. Ophthalmologica. 2013. PMID: 23257770 Review.
Cited by
-
Plexus-Specific Retinal Capillary Blood Flow Analysis Using Erythrocyte Mediated Angiography and Optical Coherence Tomography Angiography.Invest Ophthalmol Vis Sci. 2024 Sep 3;65(11):33. doi: 10.1167/iovs.65.11.33. Invest Ophthalmol Vis Sci. 2024. PMID: 39302644 Free PMC article.
-
Foveal avascular zone vessel density is associated with visual field progression in early-stage glaucoma eyes with central visual field damage.Sci Rep. 2023 Oct 25;13(1):18285. doi: 10.1038/s41598-023-45541-1. Sci Rep. 2023. PMID: 37880406 Free PMC article.
-
Evolution of adaptive optics retinal imaging [Invited].Biomed Opt Express. 2023 Feb 28;14(3):1307-1338. doi: 10.1364/BOE.485371. eCollection 2023 Mar 1. Biomed Opt Express. 2023. PMID: 36950228 Free PMC article. Review.
-
Retinal blood flow speed quantification at the capillary level using temporal autocorrelation fitting OCTA [Invited].Biomed Opt Express. 2023 May 16;14(6):2658-2677. doi: 10.1364/BOE.488103. eCollection 2023 Jun 1. Biomed Opt Express. 2023. PMID: 37342704 Free PMC article.
-
Variability in Capillary Perfusion Is Increased in Regions of Retinal Ischemia Due to Branch Retinal Vein Occlusion.Invest Ophthalmol Vis Sci. 2023 Oct 3;64(13):30. doi: 10.1167/iovs.64.13.30. Invest Ophthalmol Vis Sci. 2023. PMID: 37856113 Free PMC article.
References
-
- Riva CE, Sinclair SH, Grunwald JE.. Autoregulation of retinal circulation in response to decrease of perfusion pressure. Invest Ophthalmol Vis Sci. 1981; 21: 34–38. - PubMed
Publication types
MeSH terms
Grants and funding
LinkOut - more resources
Full Text Sources
