. 2022 Mar;65(3):528-540.
doi: 10.1007/s00125-021-05621-1. Epub 2021 Nov 30.

Wt1 haploinsufficiency induces browning of epididymal fat and alleviates metabolic dysfunction in mice on high-fat diet

Affiliations

Wt1 haploinsufficiency induces browning of epididymal fat and alleviates metabolic dysfunction in mice on high-fat diet

Karin M Kirschner et al. Diabetologia. 2022 Mar.

Abstract

Aims/hypothesis: Despite a similar fat storing function, visceral (intra-abdominal) white adipose tissue (WAT) is detrimental, whereas subcutaneous WAT is considered to protect against metabolic disease. Recent findings indicate that thermogenic genes, expressed in brown adipose tissue (BAT), can be induced primarily in subcutaneous WAT. Here, we investigate the hypothesis that the Wilms tumour gene product (WT1), which is expressed in intra-abdominal WAT but not in subcutaneous WAT and BAT, suppresses a thermogenic program in white fat cells.

Methods: Heterozygous Wt1 knockout mice and their wild-type littermates were examined in terms of thermogenic and adipocyte-selective gene expression. Glucose tolerance and hepatic lipid accumulation in these mice were assessed under normal chow and high-fat diet conditions. Pre-adipocytes isolated from the stromal vascular fraction of BAT were transduced with Wt1-expressing retrovirus, induced to differentiate and analysed for the expression of thermogenic and adipocyte-selective genes.

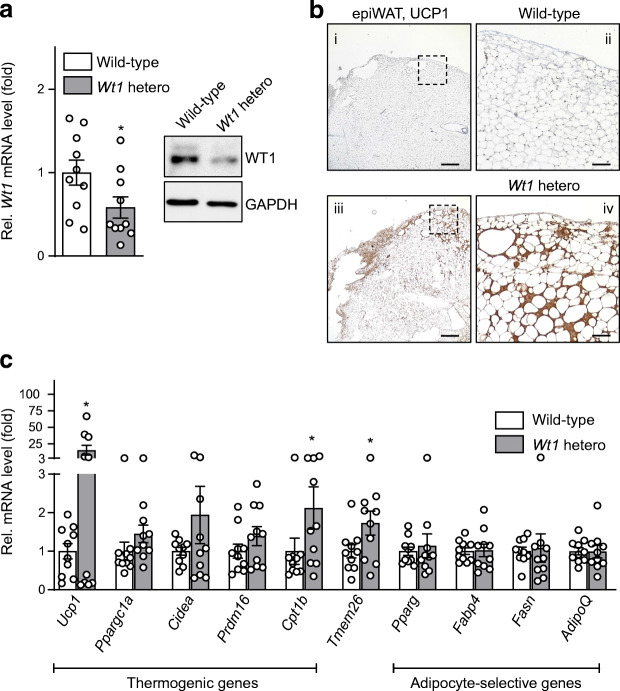
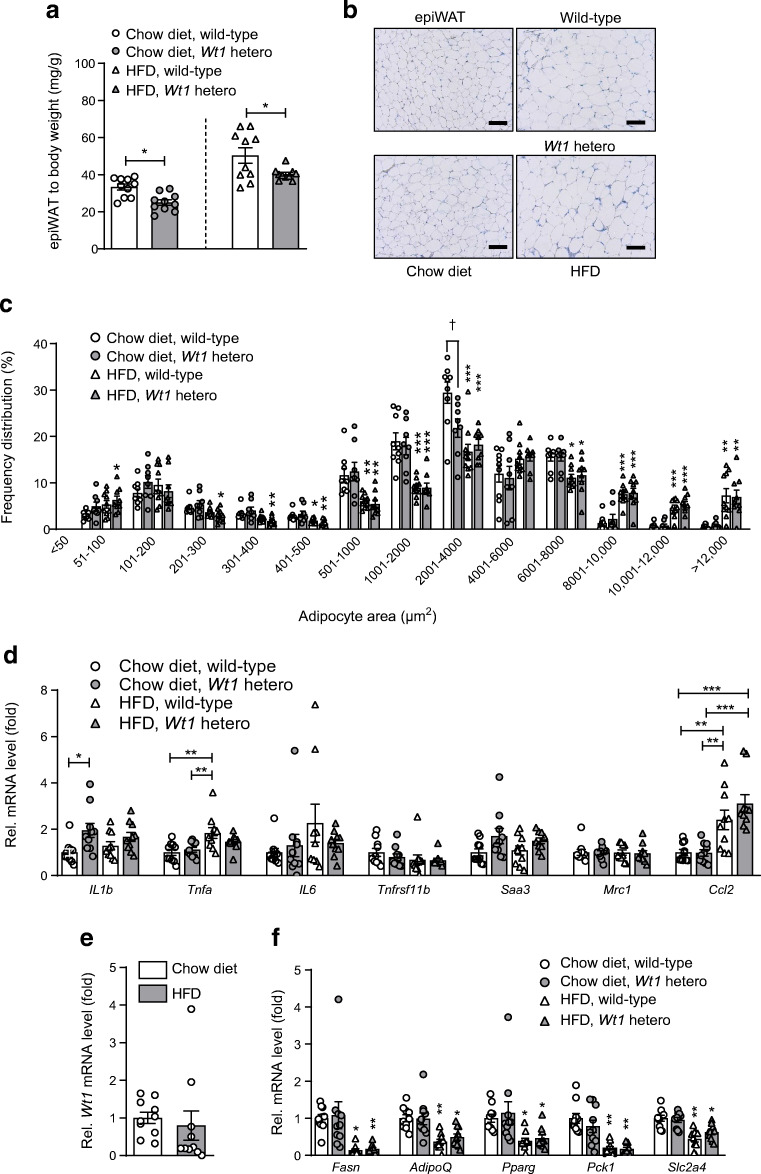
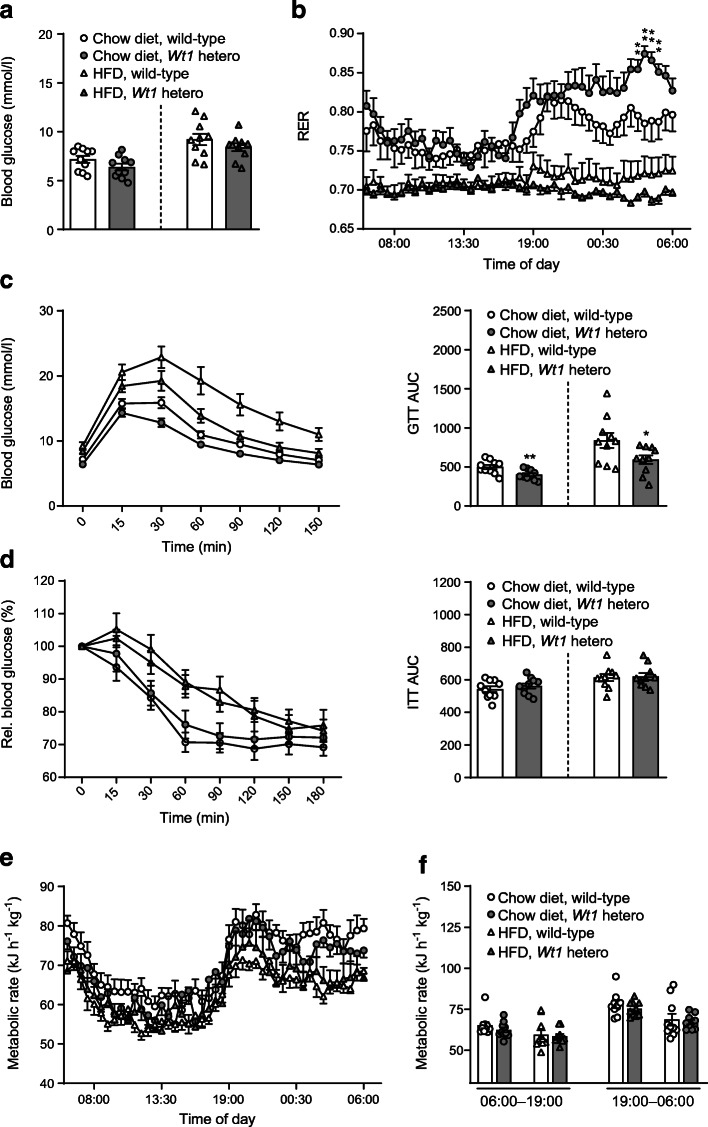
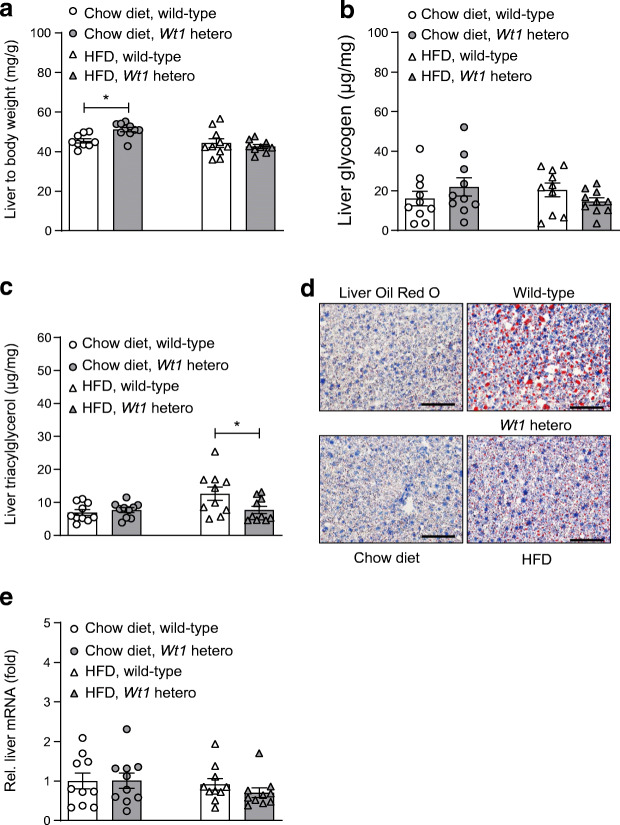
Results: Expression of the thermogenic genes Cpt1b and Tmem26 was enhanced and transcript levels of Ucp1 were on average more than tenfold higher in epididymal WAT of heterozygous Wt1 knockout mice compared with wild-type mice. Wt1 heterozygosity reduced epididymal WAT mass, improved whole-body glucose tolerance and alleviated severe hepatic steatosis upon diet-induced obesity in mice. Retroviral expression of WT1 in brown pre-adipocytes, which lack endogenous WT1, reduced mRNA levels of Ucp1, Ppargc1a, Cidea, Prdm16 and Cpt1b upon in vitro differentiation by 60-90%. WT1 knockdown in epididymal pre-adipocytes significantly lowered Aldh1a1 and Zfp423 transcripts, two key suppressors of the thermogenic program. Conversely, Aldh1a1 and Zfp423 mRNA levels were increased approximately five- and threefold, respectively, by retroviral expression of WT1 in brown pre-adipocytes.

Conclusion/interpretation: WT1 functions as a white adipocyte determination factor in epididymal WAT by suppressing thermogenic genes. Reducing Wt1 expression in this and other intra-abdominal fat depots may represent a novel treatment strategy in metabolic disease.

Keywords: Adipocyte; Browning; Glucose tolerance; Hepatic steatosis; High-fat diet; Obesity; Thermogenesis; Transcription factor; UCP1; WT1.


Figures

Fig. 1
Fig. 1
WT1 suppresses thermogenic genes in differentiating brown precursor cells. (a) Representative immunoblot of different fat depots from adult male C57BL/6 J mice: epididymal WAT (epiWAT), inguinal WAT (iWAT), interscapular BAT. (b, c) Relative (Rel.) leptin (Lep) (b) and Wt1 (c) mRNA levels measured by RT-qPCR in the isolated SVF and the adipocyte (adipo.) fraction of epiWAT and iWAT of adult mice. Leptin mRNA in adipocytes is presented as fold difference vs transcript levels in SVF cells of epiWAT (b); Wt1 transcripts in SVF cells of epiWAT are shown as fold increase vs mRNA levels in adipocytes (c). Bars represent means ± SEM, n = 4. *p < 0.05 vs SVF, Student’s t test; n.d., not detectable. (d) Wt1 mRNA in stromal vascular cells (arrowheads) in murine epiWAT detected by RNAscope. Scale bar, 50 μm. (e) Representative immunoblot of immortalised brown pre-adipocytes (iBPC) with (retro WT1) and without (retro control) retroviral expression of WT1. (f) Relative mRNA levels in differentiated immortalised brown pre-adipocytes with (black bars) and without (white bars) retroviral overexpression of Wt1. Bars represent means ± SEM, n = 3. *p < 0.05, **p < 0.01 vs retro control, Student’s t test. (g) Phase contrast (Ph. c.) microscopy and Oil Red O lipid staining of immortalised brown pre-adipocytes. After transduction with either Wt1-expressing retrovirus or empty vector retrovirus, the cells were induced to differentiate for 5 days. Scale bars, 20 μm. (h) Relative mRNA levels in primary brown adipocytes. Precursor cells were isolated by FACS from the SVF of interscapular BAT of adult mice. Sca1+:CD45:CD31 cells were transduced with Wt1 or empty vector retrovirus, respectively, and grown to confluence for 3 days. Thereafter, the cells were induced to differentiate for 5 days. Transcript levels were measured in differentiated cells by RT-qPCR and normalised to Actb mRNA. Bars represent means ± SEM, n = 4. *p < 0.05 vs retro control, Student’s t test
Fig. 2
Fig. 2
Heterozygous Wt1 knockout mice display molecular and morphological signs of browning in their epididymal fat. (a) Relative (Rel.) Wt1 mRNA levels (left) and WT1 protein (right) in epididymal WAT (epiWAT) of wild-type and heterozygous Wt1 knockout mice. Transcript levels were measured by RT-qPCR. Bars indicate means ± SEM, n = 10. *p < 0.05 vs wild-type, Student’s t test. (b) Representative UCP1 immunostaining in epiWAT of a wild-type and a heterozygous Wt1 knockout mouse (Wt1 hetero). Scale bars, 400 μm (i, iii) and 100 μm (ii, iv). Panels ii and iv are high power magnifications of the boxed areas in panels i and iii, respectively. (c) Relative transcript levels of thermogenic genes, the beige adipocyte gene Tmem26 and adipocyte-selective genes in epiWAT of wild-type and heterozygous Wt1 knockout mice. Transcripts were measured by RT-qPCR and normalised to Actb mRNA. Data are shown as fold difference between mRNA levels in wild-type and heterozygous Wt1 knockout mice. Bars indicate means ± SEM, n = 10. *p < 0.05 vs wild-type, Student’s t test
Fig. 3
Fig. 3
Heterozygous Wt1 knockout mice fed with HFD have lower epididymal WAT to body weight ratios. Wild-type and heterozygous Wt1 knockout mice (n = 40 total) were kept on either chow diet (10% of kJ from fat) or HFD (60% of kJ from fat) for 11 weeks. (a) Epididymal WAT (epiWAT) weight to body weight ratios. Bars indicate means ± SEM, n = 10, each. *p < 0.05 between wild-type and Wt1 mutant animals (Student’s t test). Note that, for better data visualisation, statistical significance between mice receiving chow diet and HFD is not indicated. (b) Representative H&E staining of epiWAT of a wild-type and heterozygous Wt1 knockout mouse fed with either chow or HFD. Scale bars, 100 μm. (c) Frequency distribution of adipocyte areas in epididymal WAT of wild-type and heterozygous Wt1 knockout mice receiving either chow diet or HFD. Measurements were performed with tissue sections from n = 40 animals analysing more than 2500 cells per group. Statistical differences between mice of identical genotype receiving HFD vs chow diet are indicated by asterisks (*p < 0.05, **p < 0.01, ***p < 0.001, ANOVA with Tukey post hoc test). p < 0.05, statistical differences between wild-type and heterozygous Wt1 knockout mice (ANOVA with Tukey post hoc test). Note that the adipocyte areas were not significantly different between wild-type and heterozygous Wt1 knockout mice except for the size range 2001–4000 μm2. In this particular range, Wt1 knockout mice fed with chow diet had significantly smaller adipocytes in their epididymal WAT than wild-type mice. (d) Relative mRNA levels of inflammation-related genes in epididymal WAT of normal and Wt1 mutant mice. Bars represent means ± SEM, n = 10 in each group. *p < 0.05, **p < 0.01 and ***p < 0.001 as shown, ANOVA with Tukey post hoc test. (e) Relative Wt1 mRNA levels in epididymal WAT of wild-type mice receiving either chow diet or HFD. Transcripts were measured by RT-qPCR and normalised to Actb mRNA. Bars indicate means ± SEM, n = 10. (f) Relative transcript levels of genes involved in fatty acid and glucose homeostasis in epididymal WAT of wild-type and heterozygous Wt1 knockout mice receiving either normal diet or HFD. Bars show means ± SEM, n = 10 in each group. *p < 0.05 and **p < 0.01 between mice of the same genotype receiving HFD vs chow diet, ANOVA with Tukey post hoc test
Fig. 4
Fig. 4
Heterozygous Wt1 knockout mice show improved whole-body glucose tolerance. Fasting blood glucose levels (a) and RER (b) in wild-type and Wt1 mutant mice kept on either chow diet or HFD for 11 weeks. Asterisks indicate statistical differences between wild-type and heterozygous Wt1 knockout mice fed with chow diet. **p < 0.01, ANOVA with Tukey post hoc test, n = 10. Glucose (c) and insulin (d) tolerance test. Values are means ± SEM, *p < 0.05, **p < 0.01 vs wild-type, Student’s t test, n = 10 in each group. Diurnal (e) and phasic (f) metabolic rates of wild-type and Wt1 mutant mice on HFD and chow diet
Fig. 5
Fig. 5
Heterozygous Wt1 knockout mice on HFD show reduced hepatic steatosis. Liver to body weight ratio (a), hepatic glycogen (b) and triacylglycerol content per milligram liver tissue (c) of wild-type and heterozygous Wt1 knockout mice fed with either chow diet or HFD. *p < 0.05, ANOVA with Tukey post hoc test. Note that for better data visualisation, statistical significance between mice receiving chow diet and HFD is not indicated. (d) Representative Oil Red O lipid staining of liver sections from wild-type and heterozygous Wt1 knockout mice receiving either chow diet or HFD. Scale bars, 100 μm. (e) Wt1 transcript levels measured by RT-qPCR and normalised to Actb mRNA in the livers of wild-type mice receiving either chow diet or HFD. Bars represent means ± SEM, n = 10. p > 0.05, ANOVA with Tukey post hoc test
Fig. 6
Fig. 6
Wt1 increases Aldh1a1 and Zfp423 expression in adipogenic precursor cells. (a) Relative mRNA levels of genes involved in adipose cell fate determination in SVF cells isolated from interscapular BAT of adult mice. Cells were transduced with either Wt1-expressing retrovirus (retro WT1) or empty vector control (retro control). (b) Transcript levels in immortalised brown pre-adipocytes with and without retroviral expression of WT1. (c) Relative mRNA levels in Wt1-expressing and non-expressing SVF cells isolated from inguinal WAT of adult mice. WT1 immunoblot (d) and relative transcript levels (e) of undifferentiated SVF cells prepared from epididymal WAT of adult mice. Primary cells at approximately 50% confluence were incubated with either non-targeting control siRNA or Wt1 siRNA for 48 h. Transcript levels were measured by RT-qPCR and normalised to Actb. In each figure part, mRNA levels are shown as fold difference between cells transfected with Wt1 siRNA (siWt1) and non-targeting siRNA (siControl). Bars represent means ± SEM, n = 4 (a), n = 5 (b), n = 6 (c) and n = 8 (e). *p < 0.05, **p < 0.01, Student’s paired t test. Note that all data shown were obtained with undifferentiated cells

Similar articles

Cited by

References

    1. Bray GA, Bellanger T. Epidemiology, trends, and morbidities of obesity and the metabolic syndrome. Endocrine. 2006;29(1):109–117. doi: 10.1385/ENDO:29:1:109. - DOI - PubMed
    1. Mensah GA, Mokdad AH, Ford E, et al. Obesity, metabolic syndrome, and type 2 diabetes: emerging epidemics and their cardiovascular implications. Cardiol Clin. 2004;22(4):485–504. doi: 10.1016/j.ccl.2004.06.005. - DOI - PubMed
    1. Pischon T, Boeing H, Hoffmann K, et al. General and abdominal adiposity and risk of death in Europe. N Engl J Med. 2008;359(20):2105–2120. doi: 10.1056/NEJMoa0801891. - DOI - PubMed
    1. Manolopoulos KN, Karpe F, Frayn KN. Gluteofemoral body fat as a determinant of metabolic health. Int J Obes. 2010;34(6):949–959. doi: 10.1038/ijo.2009.286. - DOI - PubMed
    1. Cypess AM, Kahn CR. The role and importance of brown adipose tissue in energy homeostasis. Curr Opin Pediatr. 2010;22(4):478–484. doi: 10.1097/MOP.0b013e32833a8d6e. - DOI - PMC - PubMed

Publication types

LinkOut - more resources