. 2022 Jun;69(6):1943-1953.
doi: 10.1109/TBME.2021.3131353. Epub 2022 May 19.

Diffuse Correlation Spectroscopy Beyond the Water Peak Enabled by Cross-Correlation of the Signals From InGaAs/InP Single Photon Detectors

Diffuse Correlation Spectroscopy Beyond the Water Peak Enabled by Cross-Correlation of the Signals From InGaAs/InP Single Photon Detectors

Mitchell B Robinson et al. IEEE Trans Biomed Eng. 2022 Jun.

Abstract

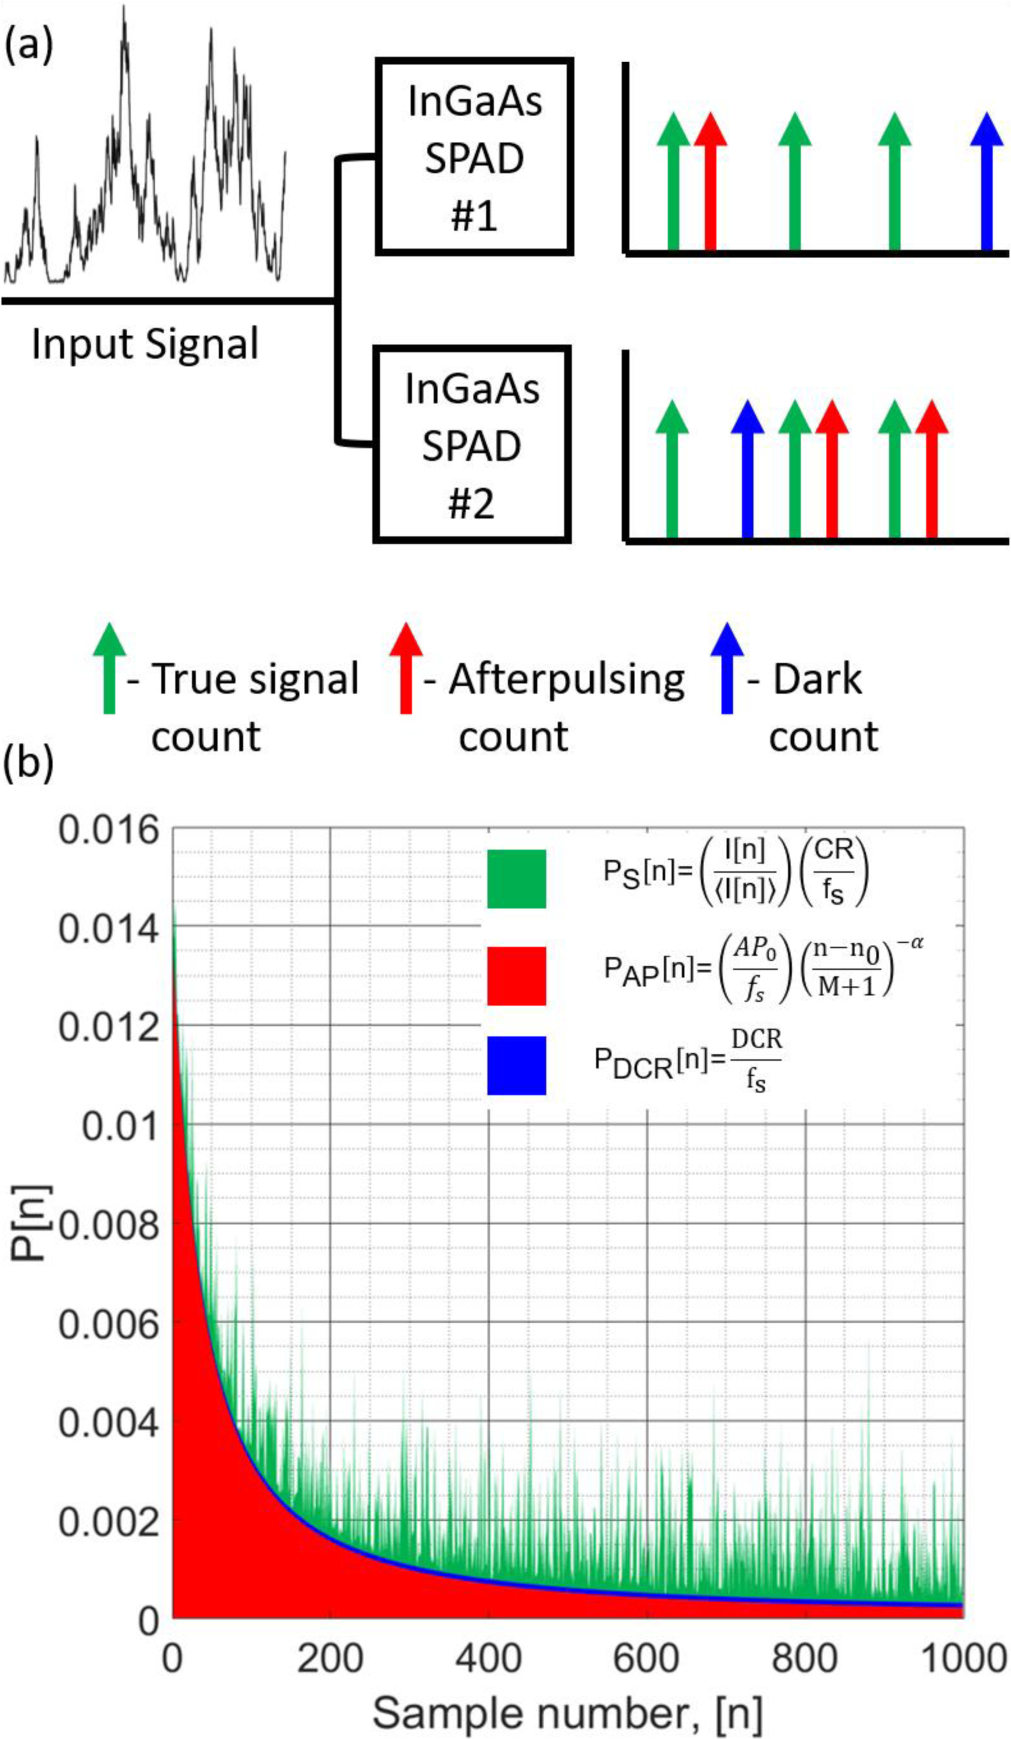
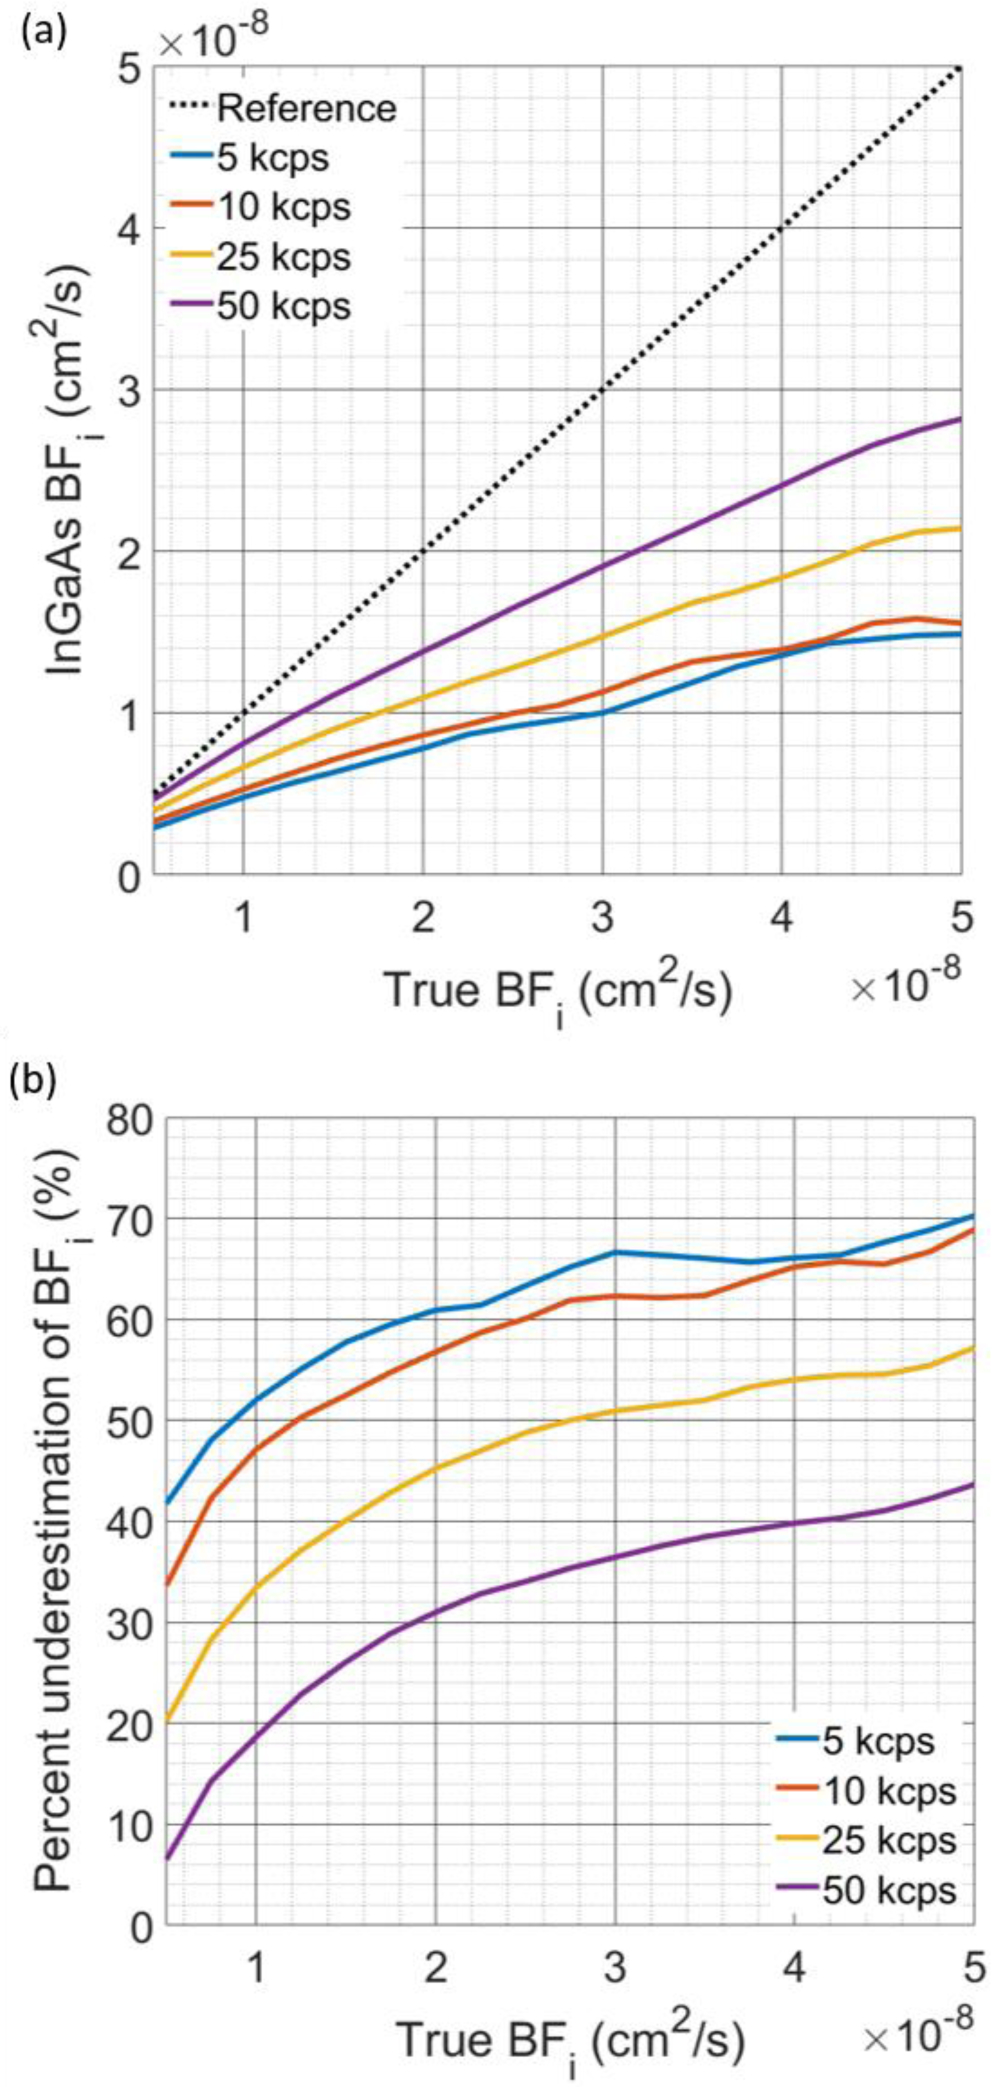
Objective: Diffuse correlation spectroscopy (DCS) is an optical technique that allows for the non-invasive measurement of blood flow. Recent work has shown that utilizing longer wavelengths beyond the traditional NIR range provides a significant improvement to signal-to-noise ratio (SNR). However, current detectors both sensitive to longer wavelengths and suitable for clinical applications (InGaAs/InP SPADs) suffer from suboptimal afterpulsing and dark noise characteristics. To overcome these barriers, we introduce a cross correlation method to more accurately recover blood flow information using InGaAs/InP SPADs.

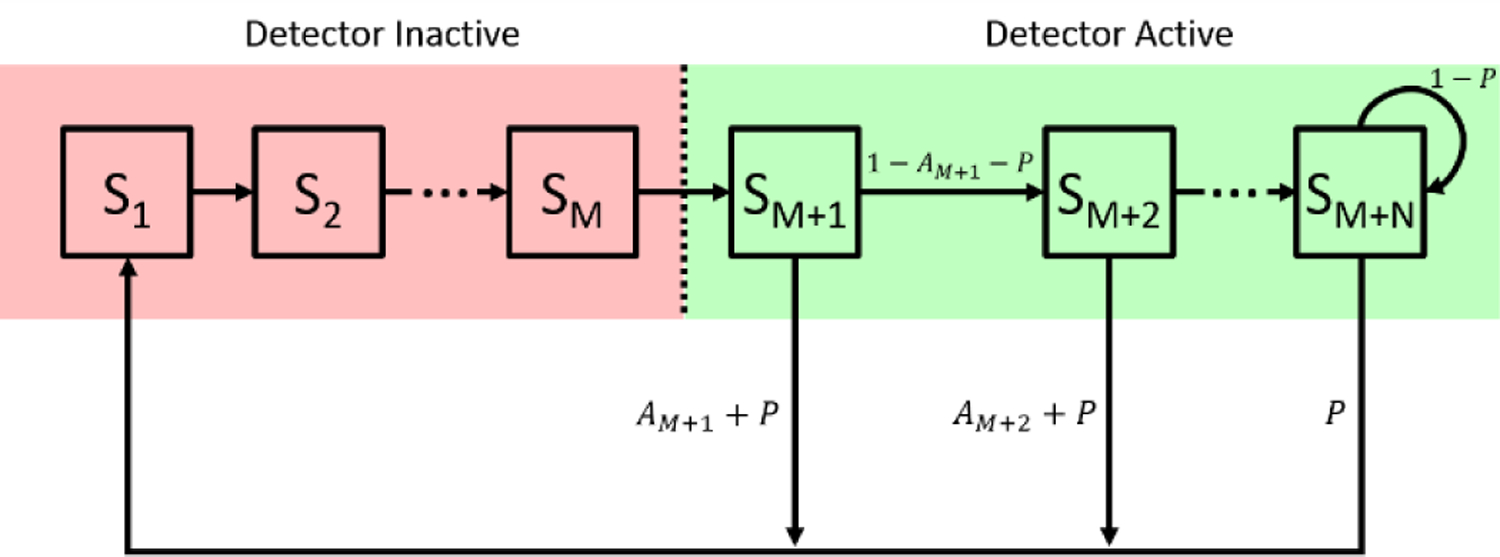
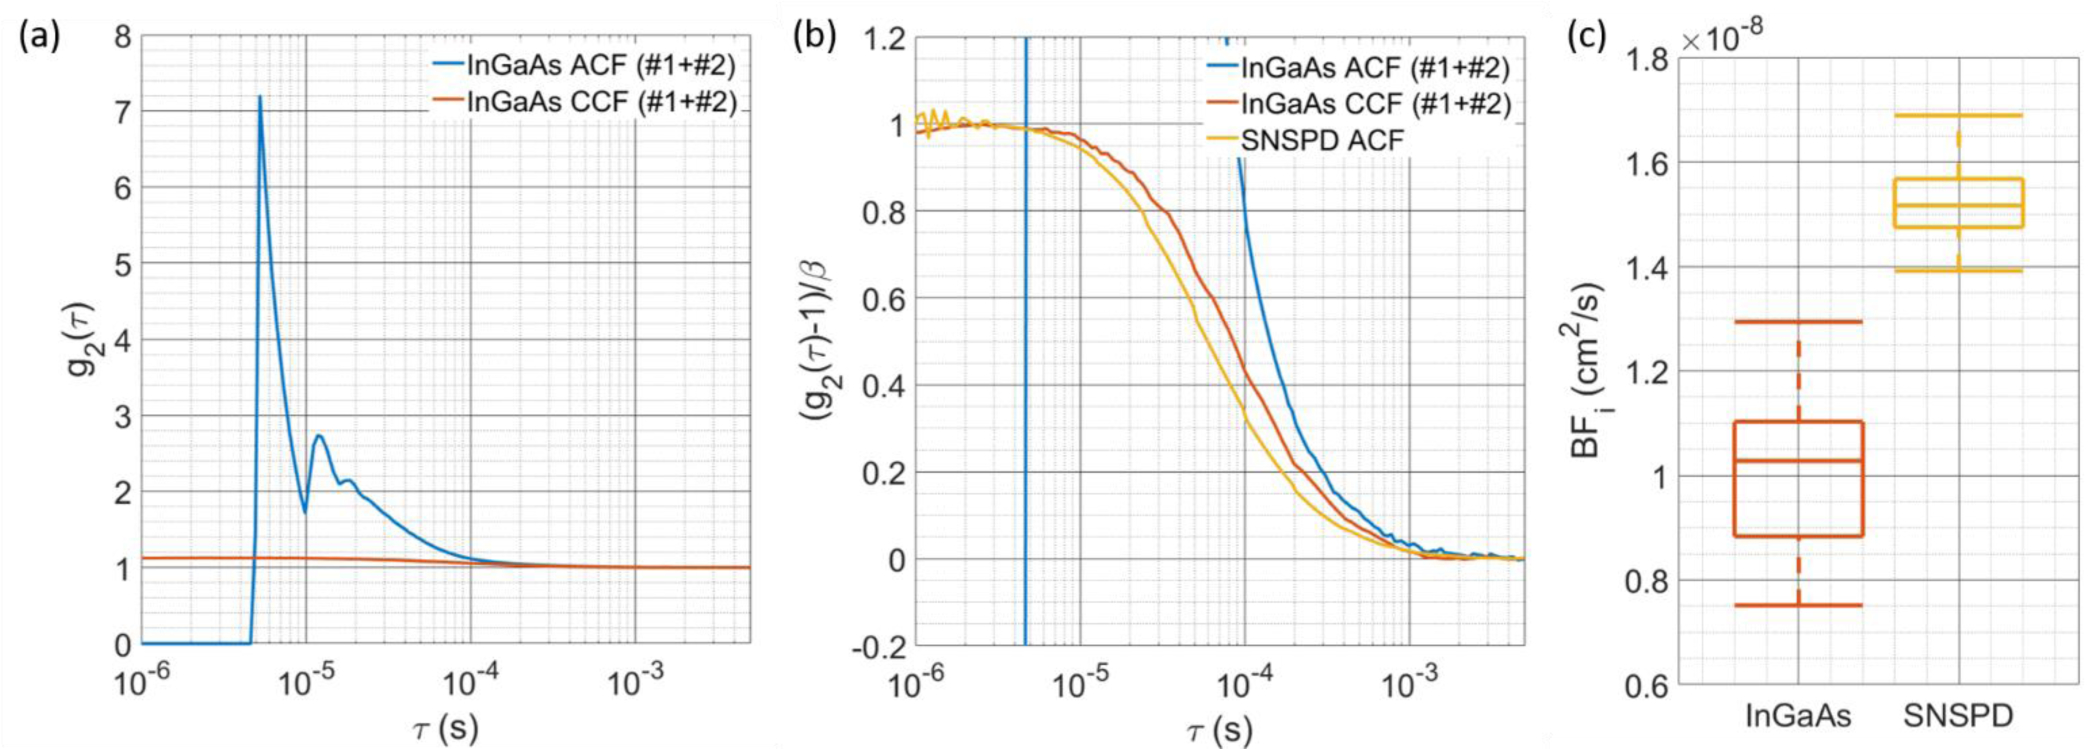
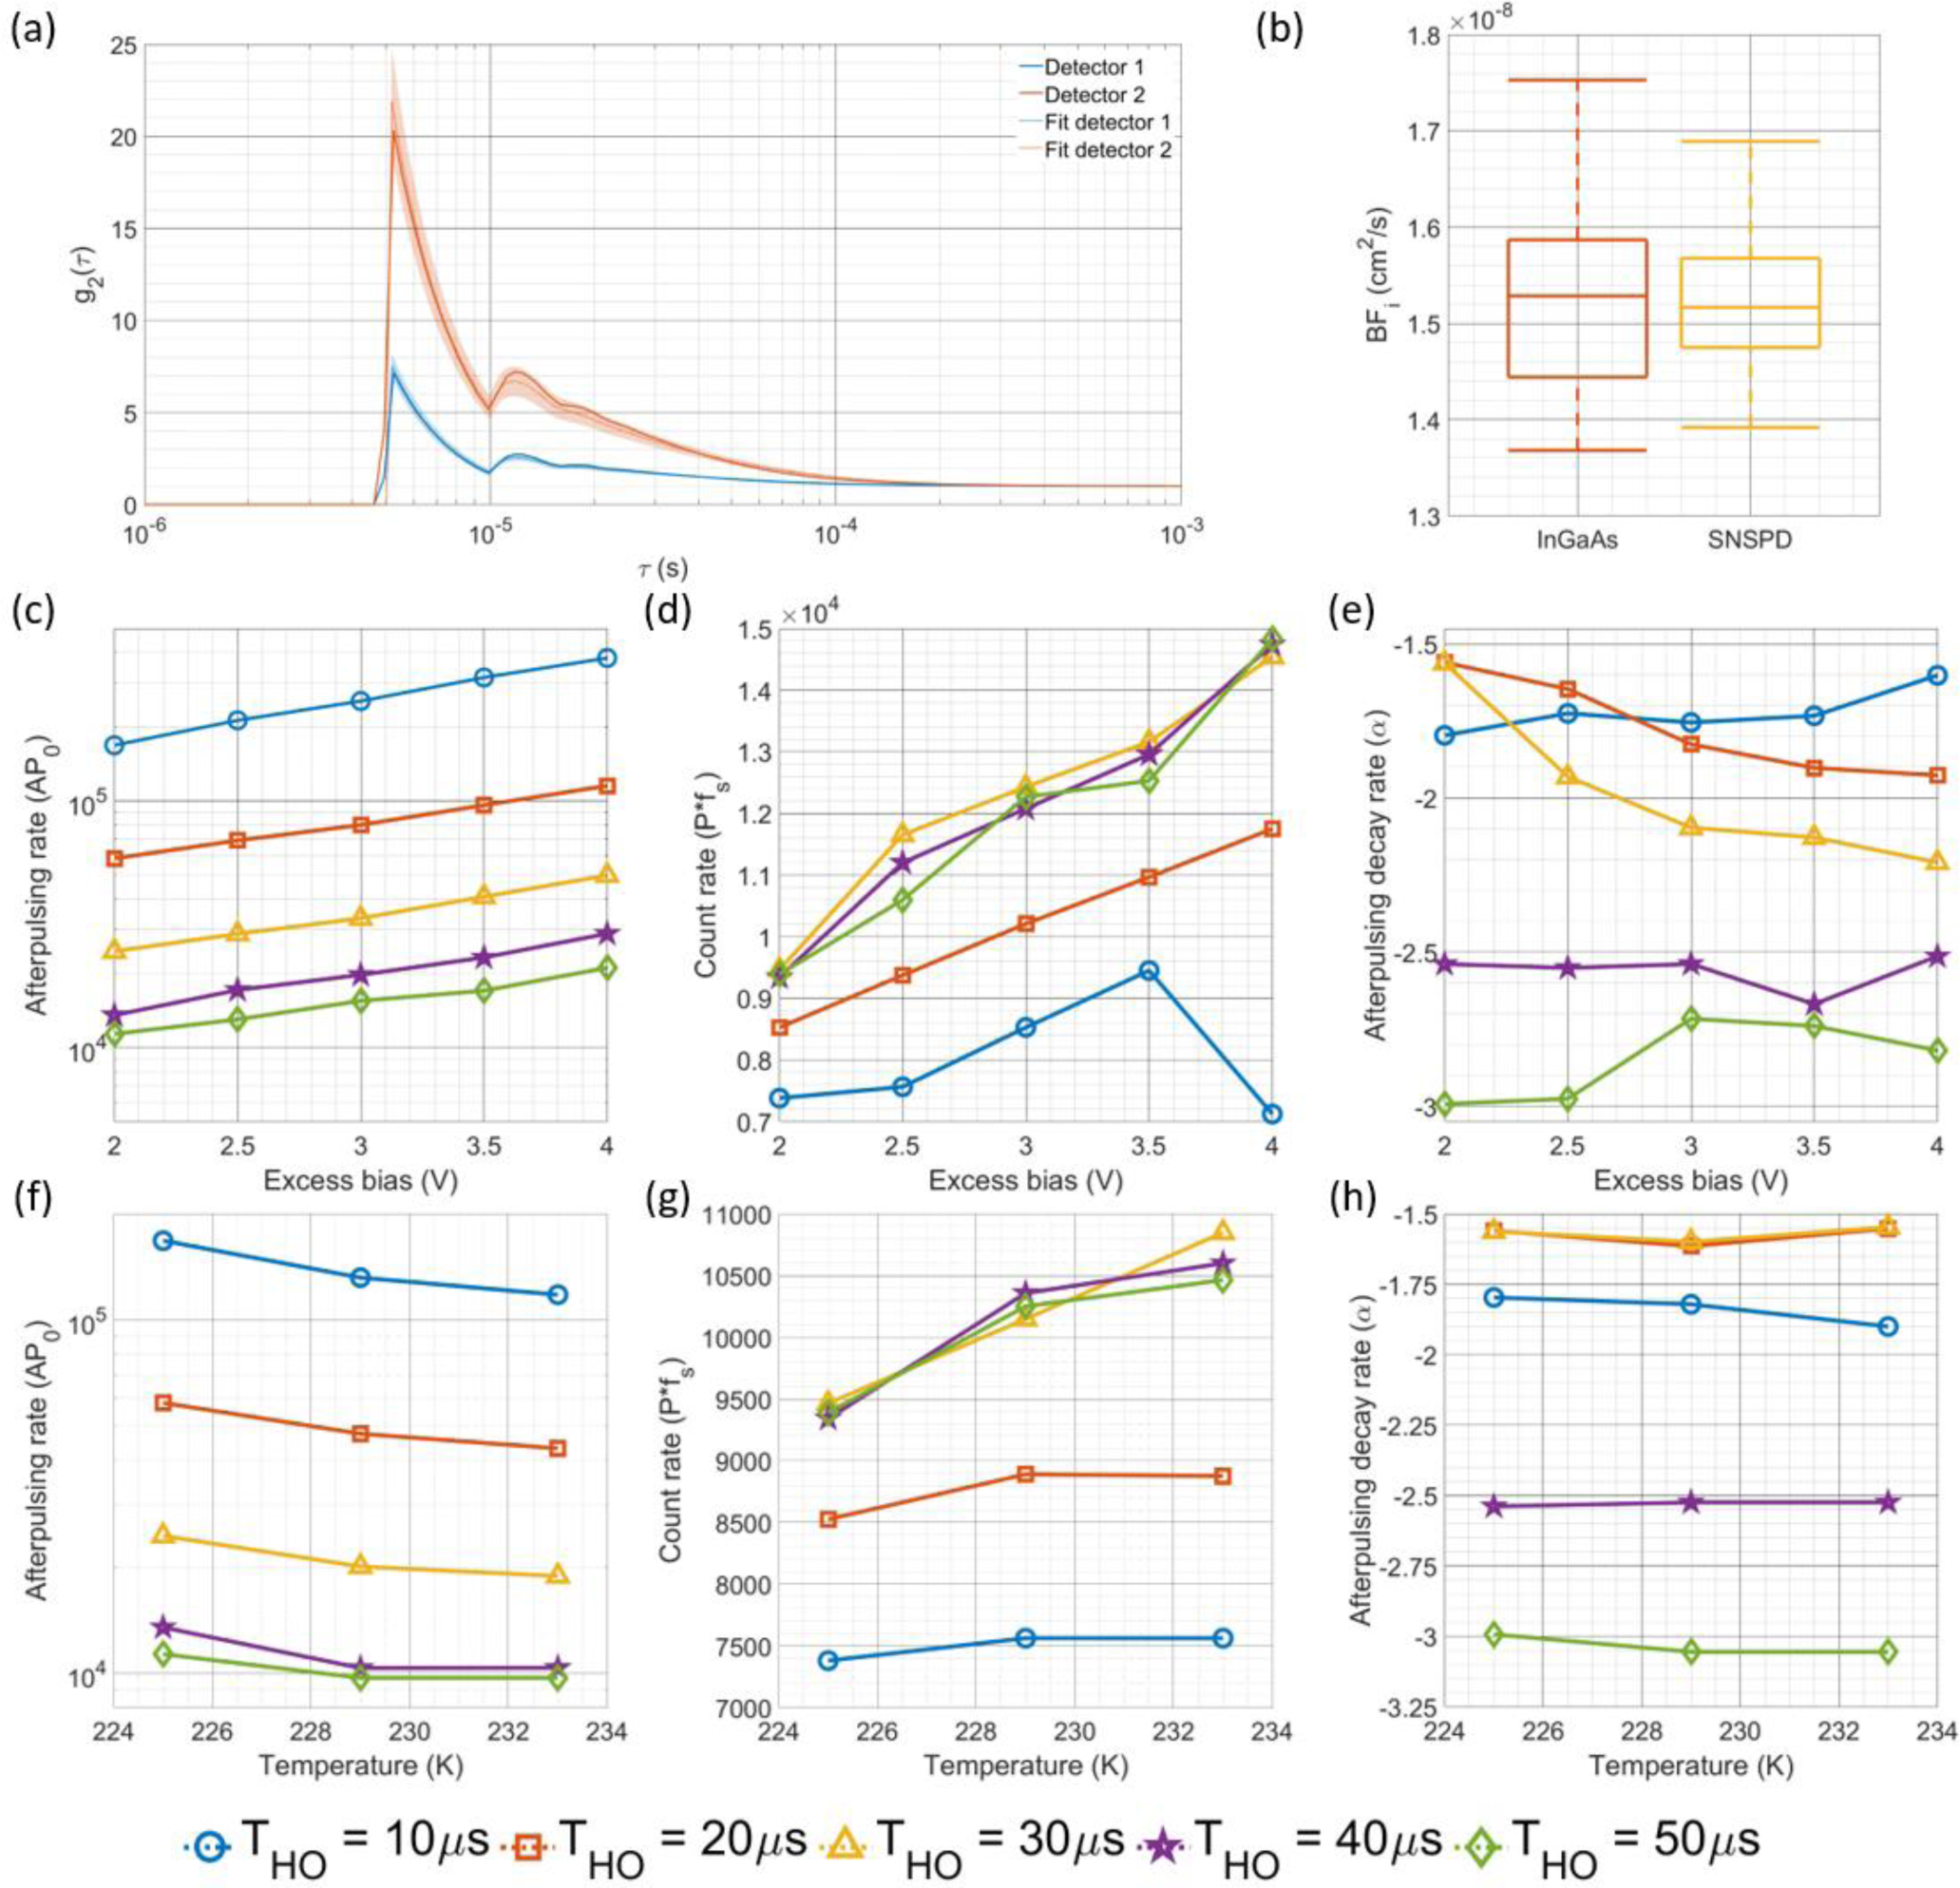
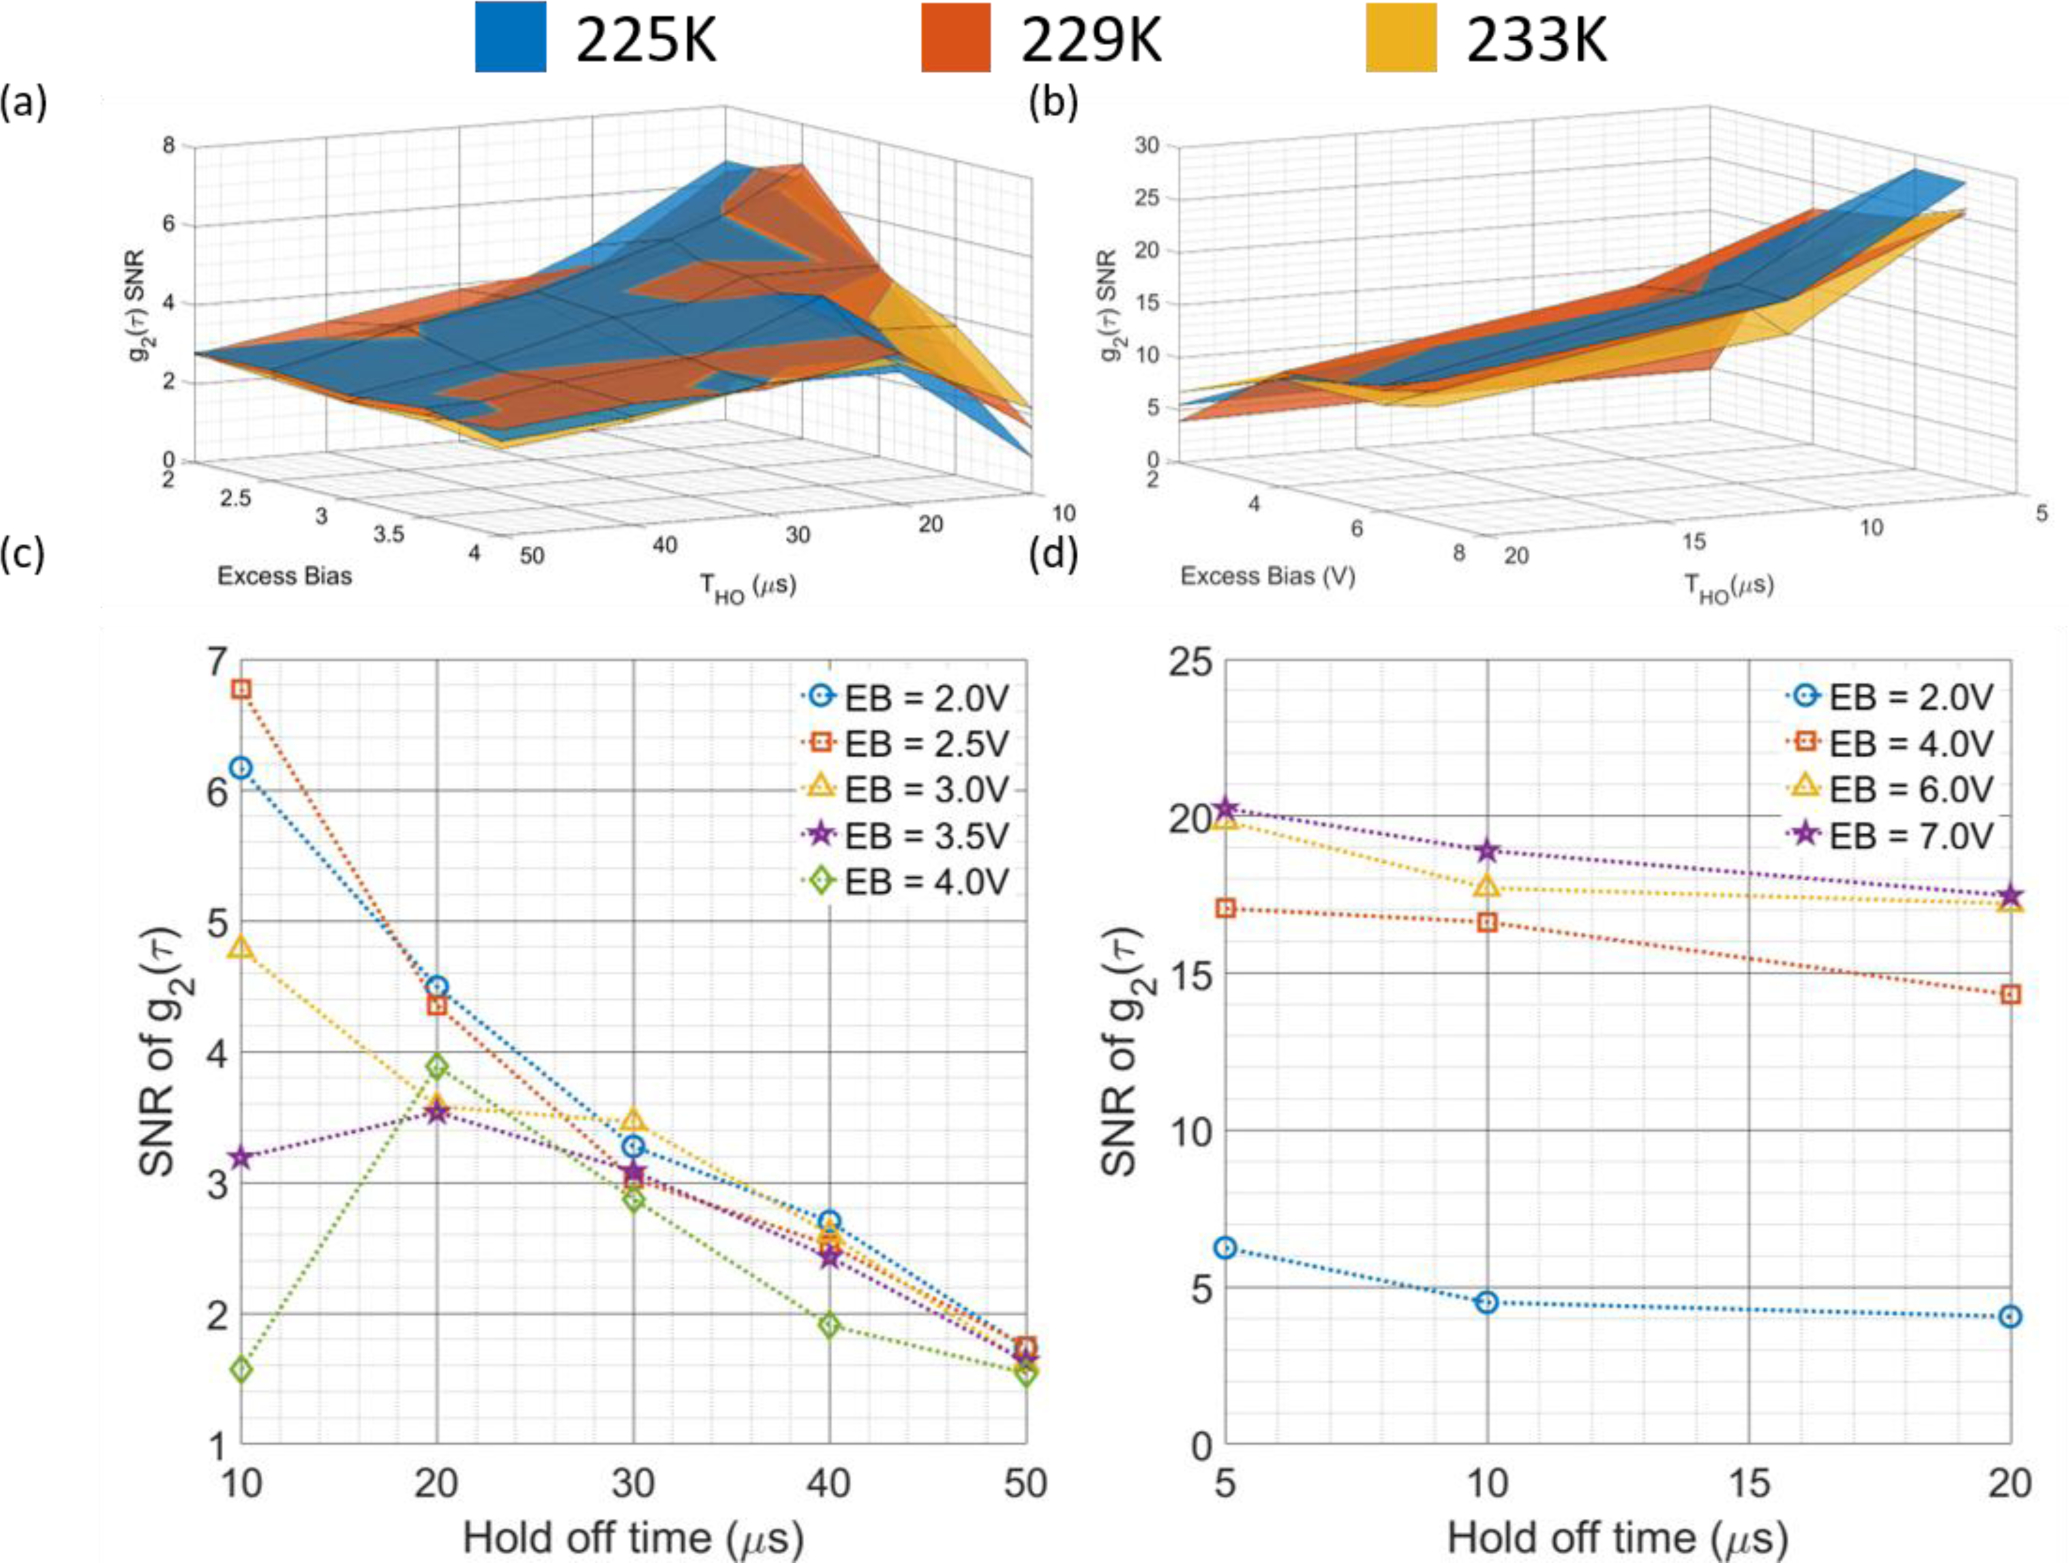
Methods: Two InGaAs/InP SPAD detectors were used for during in vitro and in vivo DCS measurements. Cross correlation of the photon streams from each detector was performed to calculate the correlation function. Detector operating parameters were varied to determine parameters which maximized measurement SNR.State-space modeling was performed to determine the detector characteristics at each operating point.

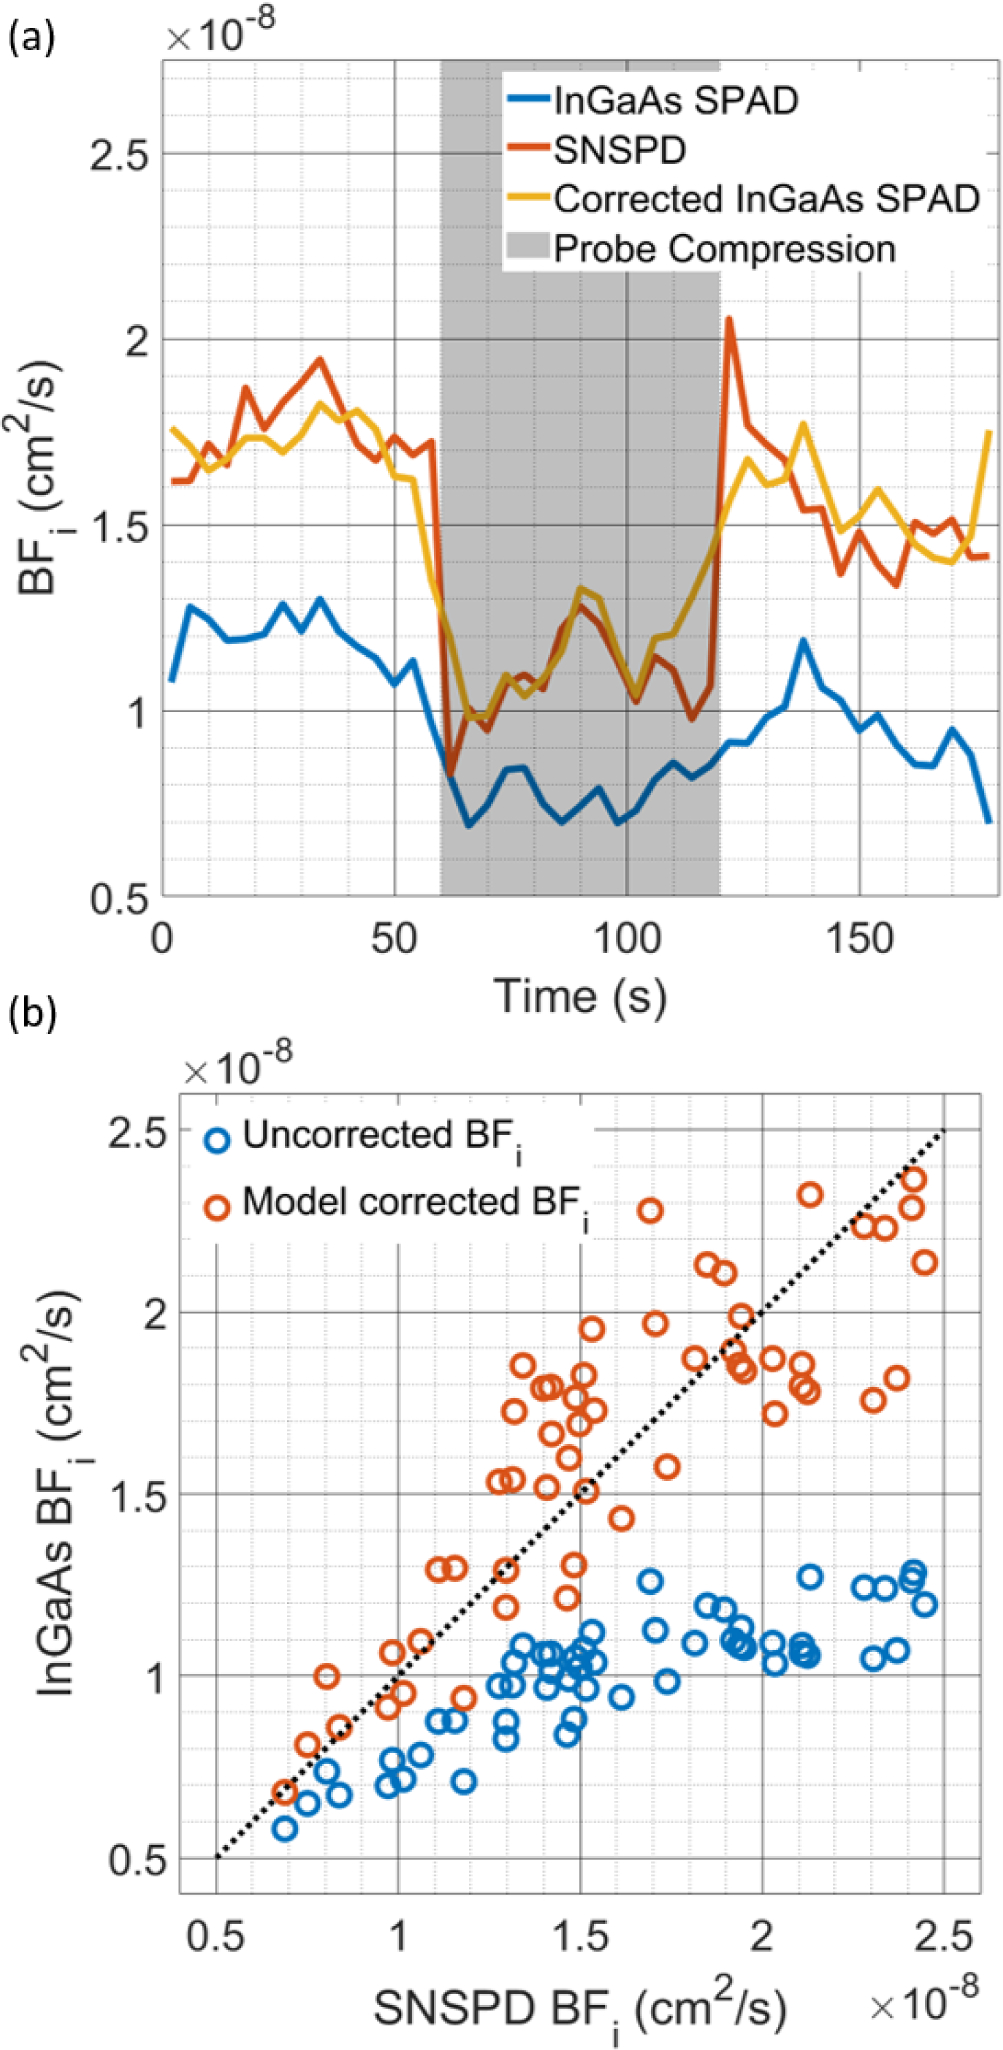
Results: Evaluation of detector characteristics was performed across the range of operating conditions. Modeling the effects of the detector noise on the correlation function provided a method to correct the distortion of the correlation curve, yielding accurate recovery of flow information as confirmed by a reference detector.

Conclusion: Through a combination of cross-correlation of the signals from two detectors, model-based characterization of detector response, and optimization of detector operating parameters, the method allows for the accurate estimation of the true blood flow index.

Significance: This work presents a method by which DCS can be performed at longer NIR wavelengths with existing detector technology, taking advantage of the increased SNR.


Figures

Fig. 1.
Fig. 1.
State space model used to represent a detector module. Detector states are labeled with respect to their position relative to the detection state S1, with the same numbering given for their state transition probabilities, which are labeled near the arrow indicating the state transition.
Fig. 2.
Fig. 2.
(a) Pictorial model description for the synthetic data model. The photon counts collected by the simulated detectors are shown with different types of counts color coded to their descriptions. (b) An example of the probabilities for the detection of each type of count is shown color coded in the same way as in (a). Inputs to the model, including the count rate of the back scattered light, DCR of the detector, and afterpulsing probabilities (P=10 kcps, AP0=140 kcps, and α=1.37), are used to determine the probabilities.
Fig. 3.
Fig. 3.
(a) Comparison of the g2(τ) calculated with autocorrelation of the combined counts of both detectors and the cross-correlation between the counts of each detector. The large artifacts due to afterpulsing are present in the autocorrelation calculation, though cross-correlation can be seen to remove the artifacts and extend the g2 to times below the hold-off time. (b) The comparison between the SNSPD autocorrelation, InGaAs/InP autocorrelation, and InGaAs/InP cross correlation shows that the cross-correlation is not completely without distortion, showing a slower decay. Quantification of this decay is shown in (c), where BFi is fit from g2(τ)’s calculated from measurements at different operating conditions. The consistently lower BFi is likely due to the “extension” of correlation by afterpulsing counts.
Fig. 4.
Fig. 4.
(a) Comparison of the autocorrelation calculated from the individual detector counts and their respective estimated autocorrelations fit using the detector model for a single set of detector operating parameters (Excess bias = 2.5 V, Hold off time = 10 μs, Temperature = 229 K). (b) Using the fitted properties, the BFi derived from the cross-correlation is corrected to account for the slowing of the correlation decay caused by the afterpulsing, and can be seen to match the BFi derived from the reference measurement. Fitting the correlation curves with the state space model allows for estimation of the afterpulsing probability at hold off time, shown in (c) and (f), measured count rate, shown in (d) and (g), and afterpulsing decay rate, shown in (e) and (h). The plots in (c), (d), and (e) are shown for a fixed temperature of 225K, and for the plots in (f), (g), and (h), the excess bias voltage is fixed at 2.0 V. The fit values for these parameters generally follow the intuition surrounding how altering the operating parameters (excess bias voltage, hold off time, and temperature) should affect the detector characteristics (P, AP0, and α). Based on the count rate estimation shown in (d), at extremely high afterpulsing rates/detector non-linearity conditions like those for the shorter hold off time condition, the estimation of count rate might be inaccurate, as shown in the difference between the 10 and 20 μs hold off time vs. the rest of the measurements.
Fig. 5.
Fig. 5.
The comparisons of the SNR of the g2(τ) curves as a function of the three operating parameters (excess bias voltage, hold off time, and temperature) are shown in (a) for the CW operation and (b) for the gated operation. To increase readability, the results present in (a) and (b) are averaged by the temperature, and presented in (c) and (d), respectively. It can be seen that for CW operation, a high bias voltage does not improve SNR, indicating that the noise counts grow faster than the increase in signal counts mediated by an increase in detection efficiency. For gated operation, the lower duty cycle allows for a reduction in dark counts, and the increase in detection efficiency is better realized, as indicated by the increased SNR at higher bias voltage. In general, across these measurements, increases in the hold off time are detrimental to SNR as they reduce the duty cycle of the detector and limit the number of back scattered photons that can be detected.
Fig. 6.
Fig. 6.
(a) Comparison of the time course of fitted BFi during the probe compression protocol. The effect of the afterpulsing on the BFi is seen in the lower BFi fitted for the uncorrected data, but following correction, the InGaAs/InP detector cross-correlation gives very similar results to that of the SNSPD. (b) Comparison of the BFi fitted from the SNSPD and InGaAs/InP measurements with and without the correction by the model. Large systematic errors can be seen in the estimate of BFi without correction, but the model allows the extraction of accurate BFi values. Due to the compression of the dynamic range of the autocorrelation decay at higher BFi values, the variability of the BFi estimates after correction can be seen to increase with the degree of the discrepancy between the true BFi and the naively fit BFi.
Fig. 7:
Fig. 7:
(a) Comparison of the recovered BFi from g2(τ) curves generated by the synthetic data model. The detector characteristics for each detector used for these simulations were AP0 = [180, 140] kcps, DCR = [0.25, 0.25] kcps, and α = [1.37, 1.54], as fit from the measurements made at the operating conditions used for the in vivo experiments. At low count rates, the BFi recovered from the curves shows more severe underestimation, seen in both (a) and (b), though with a higher photon count rate, the degree of underestimation is improved. The relationship shown provides a rationale for the relative BFi matching well between the InGaAs/InP measurement and the reference measurement, as these measurements were made over a relatively small range of BFi values. With an increase in the range of BFi made during a particular measurement, this accuracy would likely be degraded, as the relationship between InGaAs/InP derived BFi and true BFi is nonlinear.

References

    1. Boas DA and Yodh AG, “Spatially varying dynamical properties of turbid media probed with diffusing temporal light correlation,” J. Opt. Soc. Am. A, vol. 14, no. 1, p. 192, Jan. 1997, doi: 10.1364/JOSAA.14.000192. - DOI
    1. Shang Y, Li T, and Yu G, “Clinical applications of near-infrared diffuse correlation spectroscopy and tomography for tissue blood flow monitoring and imaging,” Physiological Measurement, vol. 38, no. 4. NIH Public Access, pp. R1–R26, 2017. doi: 10.1088/1361-6579/aa60b7. - DOI - PMC - PubMed
    1. Parthasarathy AB et al., “Dynamic autoregulation of cerebral blood flow measured non-invasively with fast diffuse correlation spectroscopy.,” J. Cereb. Blood Flow Metab, vol. 38, no. 2, pp. 230–240, Feb. 2018, doi: 10.1177/0271678X17747833. - DOI - PMC - PubMed
    1. Busch DR et al., “Detection of Brain Hypoxia Based on Noninvasive Optical Monitoring of Cerebral Blood Flow with Diffuse Correlation Spectroscopy,” Neurocrit. Care, vol. 30, no. 1, pp. 72–80, Feb. 2019, doi: 10.1007/s12028-018-0573-1. - DOI - PMC - PubMed
    1. Yazdi HS et al., “Mapping breast cancer blood flow index, composition, and metabolism in a human subject using combined diffuse optical spectroscopic imaging and diffuse correlation spectroscopy,” J. Biomed. Opt, vol. 22, no. 4, p. 045003, Apr. 2017, doi: 10.1117/1.jbo.22.4.045003. - DOI - PMC - PubMed

Publication types