. 2021 Nov 30;16(11):e0255860.
doi: 10.1371/journal.pone.0255860. eCollection 2021.

Molecular studies into cell biological role of Copine-4 in Retinal Ganglion Cells

Affiliations

Molecular studies into cell biological role of Copine-4 in Retinal Ganglion Cells

Manvi Goel et al. PLoS One. .

Abstract

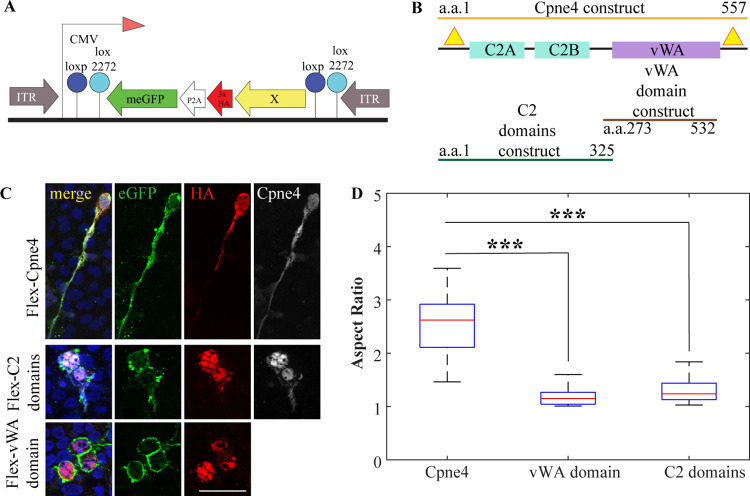
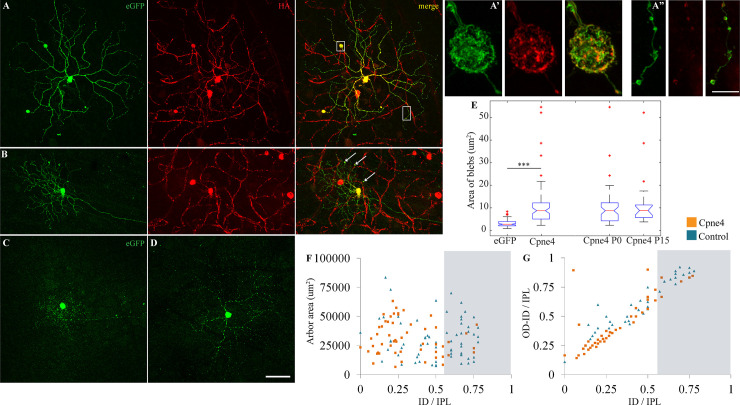
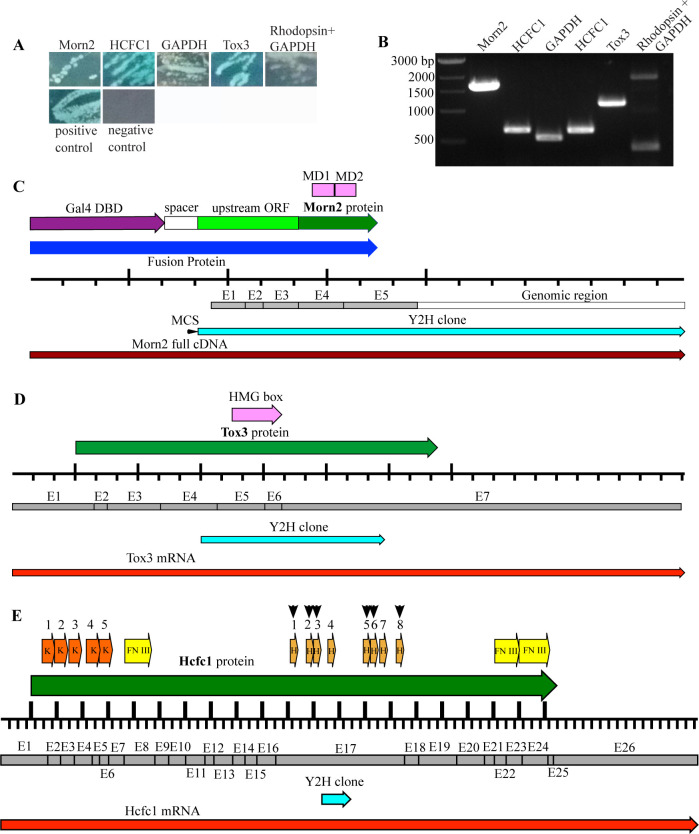
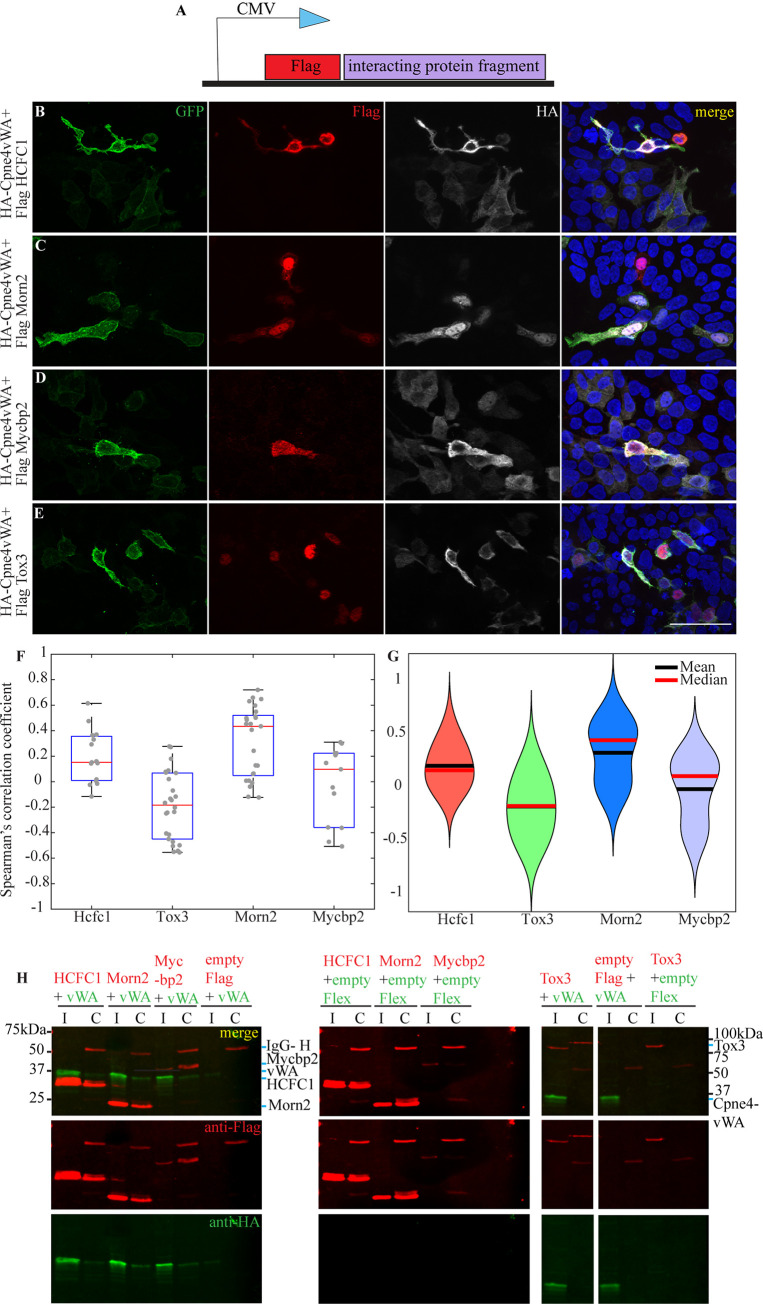
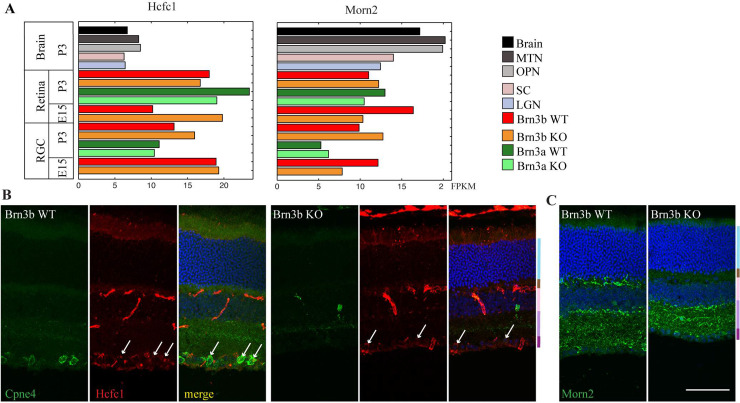
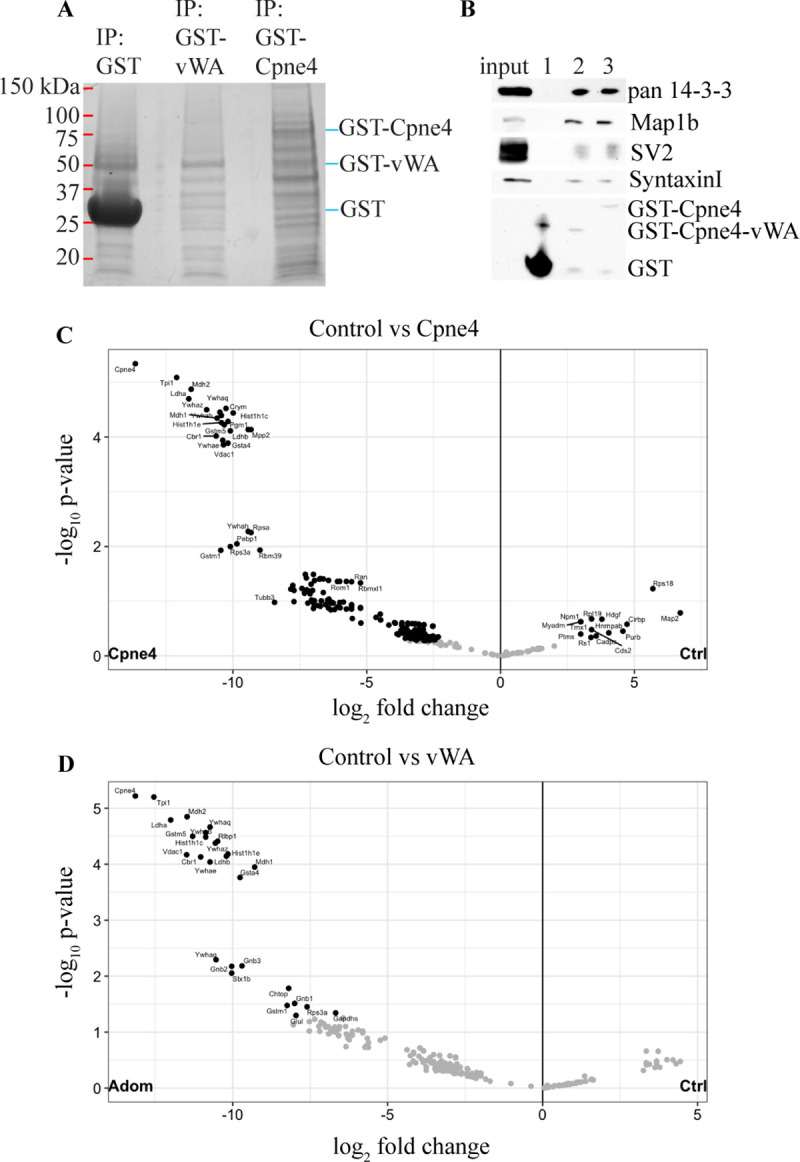
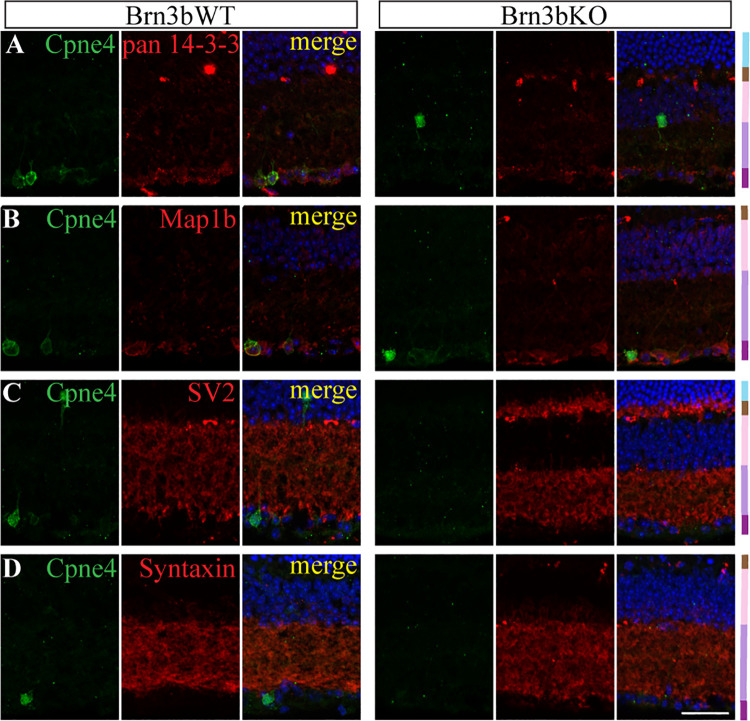
The molecular mechanisms underlying morphological diversity in retinal cell types are poorly understood. We have previously reported that several members of the Copine family of Ca-dependent membrane adaptors are expressed in Retinal Ganglion Cells and transcriptionally regulated by Brn3 transcription factors. Several Copines are enriched in the retina and their over-expression leads to morphological changes -formation of elongated processes-, reminiscent of neurites, in HEK293 cells. However, the role of Copines in the retina is largely unknown. We now investigate Cpne4, a Copine whose expression is restricted to Retinal Ganglion Cells. Over-expression of Cpne4 in RGCs in vivo led to formation of large varicosities on the dendrites but did not otherwise visibly affect dendrite or axon formation. Protein interactions studies using yeast two hybrid analysis from whole retina cDNA revealed two Cpne4 interacting proteins-Host Cell Factor 1 and Morn2. Mass Spectrometry analysis of retina lysate pulled down using Cpne4 or its vonWillebrand A domain showed 207 interacting proteins. A Gene Ontology analysis of the discovered proteins suggests that Cpne4 is involved in several metabolic and signaling pathways in the retina.


Conflict of interest statement

The authors have declared that no competing interests exist.

Figures

Fig 1
Fig 1. Cpne4 and Cpne4 dominant negative transfections in HEK293.
(A) Map of the Flex construct. (B) Map of domain structure of Cpne4 shows three domains of the Cpne4 protein- two C2 domains (blue) and a vWA domain (purple). The location of the three Cpne4 plasmid constructs are shown for full length Cpne4 construct (orange), vWA domain construct (brown) and C2 domains construct (green). The binding of the two Cpne4 antibodies- N-terminal and C-terminal antibodies on the Cpne4 protein are indicated by yellow triangles. (C) Representative images of HEK293 cells transfected with expression constructs for full length Cpne4 (top row), C2 domains construct (middle row) and vWA domain construct (bottom row). The cells were counterstained for eGFP (green), HA (red) and N-terminal or C-terminal Cpne4 (white) antibodies and nuclear marker DAPI (blue). (D) Morphometric analysis showing aspect ratios of an ellipse fitted to the cells calculated for Cpne4, vWA domain and C2 domains transfected cells. The boxes show interquartile intervals with the median indicated with a red line and the whiskers represent the range of the observations. The mean and median aspect ratios for each group and p-values of comparisons of vWA domain and C2 domains transfected cells to Cpne4 transfected cells are given in Table 2.***, p< 0.001. Scale bar: 50μm.
Fig 2
Fig 2. Cpne4 virus infections lead to ‘bleb’ formation on dendrites of Brn3b+ RGCs.
(A, B) Intraocular injections of AAV1-Cpne4 viruses were done in P0 or P14 Brn3bCre/WT mice eyes. Blebs (indicated by boxes and arrows) were seen occasionally on dendrites of Cpne4 infected RGCs. For controls, AAV1-eGFP was similarly injected in P0 Brn3bCre/WT mice (C, D). No blebs were observed in the control infected RGCs. Airy scan images for one of the blebs (A’) and adjoining dendrites (A”). (E) Measurement of the ‘bleb’ areas for Cpne4 infected RGCs as compared to regular varicosities on controls shows a significant difference between them while no difference between P0 and P15 Cpne4 infected retinas. (F, G) Areas and lamination measurements indicate no differences between the Cpne4 transfected RGCs as compared to control transfected RGCs. (ID and OD: Inner and outer distance- distance between innermost or outermost tip of RGC dendrites and the INL; IPL: Width of the IPL). Scale bar for A-C: 50μm; Scale bar for A’, A”: 5μm.***, p< 0.001.
Fig 3
Fig 3. Yeast 2 hybrid analysis shows 5 proteins interacting with Cpne4 vWAdomain.
(A)A Gal4 based yeast two hybrid analysis on the adult mouse retina cDNA library with Cpne4 vWA domain as bait protein showed five positive interactions (blue colonies). (B) Gel image of colony PCR performed on the positive clones from the yeast two hybrid shows the corresponding interacting DNA sequences. The identity of these DNA sequences as confirmed by the Sanger sequencing followed by BLAST analysis are shown as labels on the lanes. (C-E) Sequence maps of the interacting peptides as identified by Sanger sequencing followed by BLAST analysis are shown for- Morn2 (C), Tox3 (D) and HCFC1 (E). The relative positions of the actual interacting region (light blue) are indicated on the respective protein (dark green) and the corresponding mRNA (red) or prey Gal4 DBD- cDNA (maroon) sequences, and the exons (gray) are also indicated on the respective maps.The black ruler with tick marks indicates 100 amino acids (upward ticks) or 100 base pairs (downward ticks).The various domains and regions are as labeled on the maps. E: Exon; MD: Morn domain; MCS: Multi cloning site; K: Kelch domain; FN III: Fibronectin type III domain; H: Cleavage site, Gal4 DBD: Gal4 DNA binding domain derived from prey library.
Fig 4
Fig 4. Cpne4 vWAdomain was pulled down with HCFC1, Morn2 and Mycbp2, but not by Tox3.
(A) Map of a Flag clone consisting of a Flag tag followed by the interacting regions of HCFC1, Morn2, Mycbp2 and Tox3. (B-E) Representative images of HEK293 cells co-infected with the expression construct for Cpne4-vWAdomain (HA-Cpne4vWA) and Flag- tagged interacting protein. (F, G) Box plots and violin plots indicate the Spearmann’s correlation coefficient for co-localization between Morn2, HCFC1, Tox3 or Mycbp2 with Cpne4. Data points are shown as gray circles, medians are indicated by red lines and means by black lines. (H) Western blot images of pull down from co-transfected HEK293 cells using Flag antibody show the total lysate (I) and the co-immunoprecipitated (C) proteins. Cpne4-vWA (green; 31kDa) was pulled down with Flag- HCFC1 (23.5kDa), Morn2 (21kDa), Mycbp2 (42kDa) but not Tox3 (66kDa; all appear as red bands).Scale bar: 50μm.
Fig 5
Fig 5. Expression of Morn2 and HCFC1 in retina.
(A) RNA sequencing data shows FPKM (fragments per kilobase of transcripts per million mapped reads) for Morn2 and HCFC1 in visual brain areas (MTN:medial temporal nucleus, OPN:olivary pretectal nucleus, SC: Superior coliculus, LGN: Lateral geniculate nucleus), rest of the brain (Brain) Brn3a wild-type (WT) and knockout (KO) RGCs, Brn3b WT and KO RGCs and rest of the retina (Retina). Brain samples were obtained from P3 WT (wildtype) mice and retina samples from P3 or E15 mice.The genotypes for retina RGC samples are: Brn3b WT = Pax6α:Cre; Brn3bCKOAP/WT,Brn3b KO = Pax6α:Cre; Brn3bCKOAP/KO, Brn3a WT = Pax6α:Cre; Brn3aCKOAP/WT, Brn3aKO = Pax6α:Cre; Brn3aCKOAP/KO. Values for brain areas represent medians for three samples (LGN, SC), two samples (whole brain) or individual samples pooled from three animals (MTN and PTA). Retina values represent samples obtained from two pooled retinas, while RGC values are medians of two biological replicates each obtained from 6–8 retinas. Data is extracted from Sajgo et al., 2017(10). (B) HCFC1 (red) immunostaining in retina indicates some expression in RGCs in both the WT and Brn3b KO retinas. There is some co-labeling with Cpne4 (green) in the RGC cell bodies (arrows). (C) Morn2 (green) immunolabeling in the retina indicated mostly dendritic labeling in the IPL in both Brn3b WT and KO retinas. There is also some Morn2 labeling in the OPL of WT that is reduced in the Brn3b KO.Retinal layer color codes in B,C: ONL- light blue, OPL- brown, INL- pink, IPL- purple, GCL- magenta. Scale bar: 50μm.
Fig 6
Fig 6. Pulldown with GST-Cpne4 or GST-Cpne4-vWA domain and LC-MS.
(A) Representative SDS-PAGE gel for retina pull downs using GST- Cpne4, GST- Cpne4- vWA and GST only. (B) Representative Western blot image of some of the interactors from the pull-down experiment- pan 14-3-3 (30kDa); Map1b (325kDa); SV2 (95kDa) and Syntaxin1 (33kDa) as compared to GST (28kDa) controlfor retina pull downs using GST (1), GST- Cpne4- vWA (2) and GST- Cpne4 (3). (C) Volcano plot for proteins that had a significant interaction with GST- Cpne4 as compared to GST control. (D) Volcano plot for proteins that had a significant interaction with GST- Cpne4- vWA as compared to GST control.
Fig 7
Fig 7. Immunostaining of LC-MS interactors with Cpne4 in retina.
Representative images showing immunostaining of pan 14-3-3 (A); Map1b (B); SV2 (C) and Syntaxin (D; red) with Brn3b (green) in Brn3b WT (left panel) and KO (right panel). Retinal layer color codes: ONL- light blue, OPL- brown, INL- pink, IPL- purple, GCL- magenta. Scale bar: 50μm.

Similar articles

Cited by

References

    1. Baden T, Berens P, Franke K, Román Rosón M, Bethge M, Euler T. The functional diversity of retinal ganglion cells in the mouse. Nature. 2016. Jan;529(7586):345–50. doi: 10.1038/nature16468 - DOI - PMC - PubMed
    1. Badea TC, Nathans J. Morphologies of mouse retinal ganglion cells expressing transcription factors Brn3a, Brn3b, and Brn3c: analysis of wild type and mutant cells using genetically-directed sparse labeling. Vision Res. 2011. Jan;51(2):269–79. doi: 10.1016/j.visres.2010.08.039 - DOI - PMC - PubMed
    1. Badea TC, Nathans J. Quantitative analysis of neuronal morphologies in the mouse retina visualized by using a genetically directed reporter. J Comp Neurol. 2004. Dec;480(4):331–51. doi: 10.1002/cne.20304 - DOI - PubMed
    1. Bae JA, Mu S, Kim JS, Turner NL, Tartavull I, Kemnitz N, et al.. Digital Museum of Retinal Ganglion Cells with Dense Anatomy and Physiology. Cell. 2018. May;173(5):1293–1306.e19. doi: 10.1016/j.cell.2018.04.040 - DOI - PMC - PubMed
    1. Coombs J, van der List D, Wang G-Y, Chalupa LM. Morphological properties of mouse retinal ganglion cells. Neuroscience. 2006. Jun;140(1):123–36. doi: 10.1016/j.neuroscience.2006.02.079 - DOI - PubMed

Publication types

Substances