. 2021 Nov 30;16(11):e0259912.
doi: 10.1371/journal.pone.0259912. eCollection 2021.

The phytosanitary risks posed by seeds for sowing trade networks

Affiliations

The phytosanitary risks posed by seeds for sowing trade networks

Christopher E Buddenhagen et al. PLoS One. .

Abstract

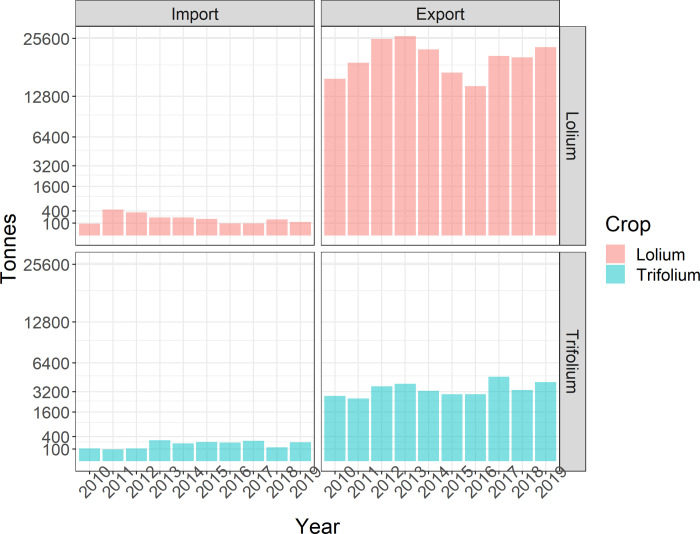
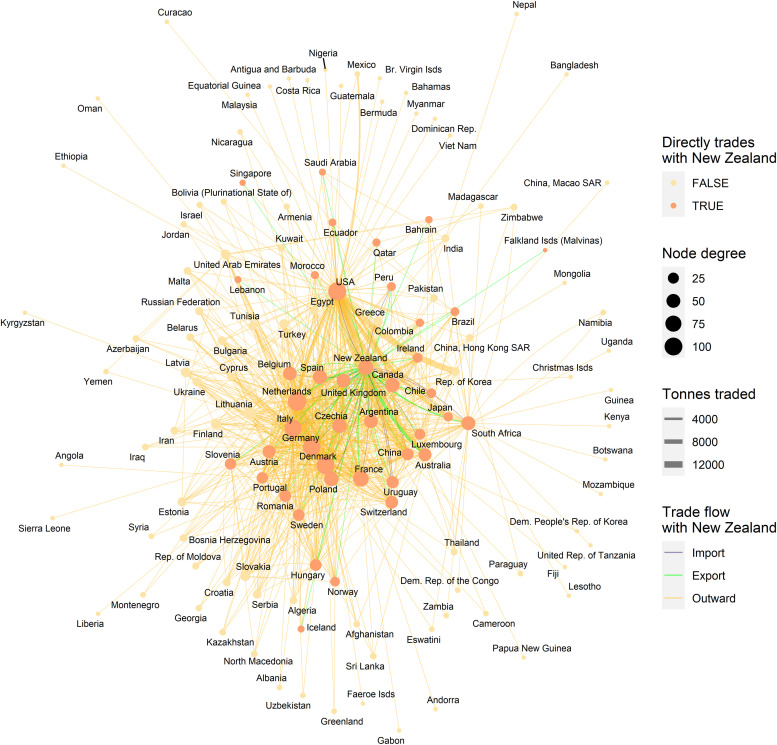
When successful, the operation of local and international networks of crop seed distribution or "seed systems" ensures farmer access to seed and impacts rural livelihoods and food security. Farmers are both consumers and producers in seed systems and benefit from access to global markets. However, phytosanitary measures and seed purity tests are also needed to maintain seed quality and prevent the spread of costly weeds, pests and diseases, in some countries regulatory controls have been in place since the 1800s. Nevertheless, seed contaminants are internationally implicated in between 7% and 37% of the invasive plant species and many of the agricultural pests and diseases. We assess biosecurity risk across international seed trade networks of forage crops using models of contaminant spread that integrate network connectivity and trade volume. To stochastically model hypothetical contaminants through global seed trade networks, realistic dispersal probabilities were estimated from quarantine weed seed detections and incursions from border security interception data in New Zealand. For our test case we use contaminants linked to the global trade of ryegrass and clover seed. Between 2014 and 2018 only four quarantine weed species (222 species and several genera are on the quarantine schedule) warranting risk mitigation were detected at the border. Quarantine weeds were rare considering that average import volumes were over 190 tonnes for ryegrass and clover, but 105 unregulated contaminant species were allowed in. Ryegrass and clover seed imports each led to one post-border weed incursion response over 20 years. Trade reports revealed complex global seed trade networks spanning >134 (ryegrass) and >110 (clover) countries. Simulations showed contaminants could disperse to as many as 50 (clover) or 80 (ryegrass) countries within 10 time-steps. Risk assessed via network models differed 18% (ryegrass) or 48% (clover) of the time compared to risk assessed on trade volumes. We conclude that biosecurity risk is driven by network position, the number of trading connections and trade volume. Risk mitigation measures could involve the use of more comprehensive lists of regulated species, comprehensive inspection protocols, or the addition of field surveillance at farms where seed is planted.


Conflict of interest statement

CEB received funding in the form of salary from AgResearch Ltd. AgResearch Ltd is a government owned research institute whose funding was provided by a public sector agency. This does not alter our adherence to PLOS ONE policies on sharing data and materials.

Figures

Fig 1
Fig 1. Tonnes of Trifolium spp. (clover) and Lolium spp. (ryegrass) traded with New Zealand based on the United Nations Comtrade Database.
Fig 2
Fig 2. A trade network of ryegrass species traded as seed for sowing.
This includes trades reported by New Zealand and those reported by its trading partners from the United Nations Comtrade Database. Node degree indicates the number of links per node. Link colours indicate imports (blue) and exports (green) to New Zealand while “outward” (orange) links indicate trades between other countries, width indicates trade volume in tonnes. Layout is a “stress” layout (ggraph R package). Node colours vary depending on whether the country trades directly with New Zealand.
Fig 3
Fig 3. A trade network of clover species traded as seed for sowing.
This includes trades reported by New Zealand and those reported by its trading partners from the United Nations Comtrade Database. Node degree indicates the number of links per node. Link colours indicate imports (blue) and exports (green) to New Zealand while “outward” (orange) links indicate trades between other countries, width indicates trade volume in tonnes. Layout is a “stress” layout (ggraph R package). Node colours vary depending on whether the country trades directly with New Zealand.
Fig 4
Fig 4. Percent contamination in seed lots of ryegrass and clover seed entering New Zealand from each importing country.
This shows the number of seed lots of ryegrass and clover (n = 570 and 374, respectively), with percentage of lots contaminated per country (the overall contamination rate was 16 and 20%, respectively).
Fig 5
Fig 5. Biosecurity risk differences from network simulation versus trade volume assessments.
We use decile rank differences for trade links from countries (y axis) to countries x axis) for a subset of countries derived from simulated dispersal events in the network model, as compared to risk estimated directly from trade volumes reported on the UN Comtrade Database. A grey background indicates there is no trade. Panels indicate the crop type. A similar figure for all the countries in the networks is available (S3 Fig in S1 File).
Fig 6
Fig 6. The number of countries contaminated after ten annual time-steps (x axis) using a stochastic model of spread for a hypothetical contaminant of ryegrass originating at the start country (displayed vertically).
Jittered points are raw data from each simulation. The numbers to the right of each panel show the total number of simulations that resulted in dispersal out of a possible 200, each with 10 time-steps. The probability of spread is derived from the number of detections or incursions of quarantine weeds seen at the border in New Zealand (panel labels).
Fig 7
Fig 7. The number of countries contaminated after ten annual time-steps (x axis) using a stochastic model of spread for a hypothetical contaminant of clover originating at the start country (displayed vertically).
Jittered points are raw data from each simulation. The numbers to the right of each panel show the total number of simulations that resulted in dispersal out of a possible 200, each with 10 time-steps. The probability of spread is derived from the number of detections or incursions of quarantine weeds seen at the border in New Zealand (panel labels).
Fig 8
Fig 8. The number of times that a hypothetical contaminant of ryegrass arrives to New Zealand, after starting in each country.
We distinguish cases where it occurs via a direct link from the country or indirectly via another country. Each simulation relies on a probability of spread derived from the number of detections or incursions of quarantine weeds seen at the border in New Zealand and the volume of trade between any two nodes (panel labels). The numbers (to the right of the stacked bars) show the total number of simulations that resulted in dispersal out of a possible 200.
Fig 9
Fig 9. The number of times that a hypothetical contaminant of clover arrives to New Zealand, after starting in each country.
We distinguish cases where it occurs via a direct link from the country or indirectly via another country. The probability of spread is derived from the number of detections or incursions of quarantine weeds seen at the border in New Zealand. The numbers (to the right of the stacked bars) show the total number of simulations that resulted in dispersal out of a possible 200.

References

    1. Jaffee S, Srivastava J. The roles of the private and public sectors in enhancing the performance of seed systems. The World Bank Research Observer. 19949: 97–117.
    1. Tripp R, Louwaars N. Seed regulation: choices on the road to reform. Food Policy. 1997;22: 433–446. doi: 10.1016/S0306-9192(97)00033-X - DOI
    1. Hampton JG, Young KA. Quality herbage seed—germination and contamination: 1. Ryegrass. Proceedings of the New Zealand Grassland Association. 1985;46: 191–194.
    1. Matthews S, Noli E, Demir İ, Khajeh-Hosseini M, Wagner M-H. Evaluation of seed quality: From physiology to international standardization. Seed Science Research. 2012;22. doi: 10.1017/S0960258511000365 - DOI
    1. ISTA. International Rules for Seed Testing. International Rules for Seed Testing. Bassersdorf, Switzerland: International Seed Testing Association; 2021. Available: https://www.ingentaconnect.com/content/ista/rules/.

Publication types