. 2022 Jan 11;55(1):82-97.e8.
doi: 10.1016/j.immuni.2021.11.002. Epub 2021 Nov 29.

CXCL10 chemokine regulates heterogeneity of the CD8+ T cell response and viral set point during chronic infection

Affiliations

CXCL10 chemokine regulates heterogeneity of the CD8+ T cell response and viral set point during chronic infection

Aleksandra J Ozga et al. Immunity. .

Abstract

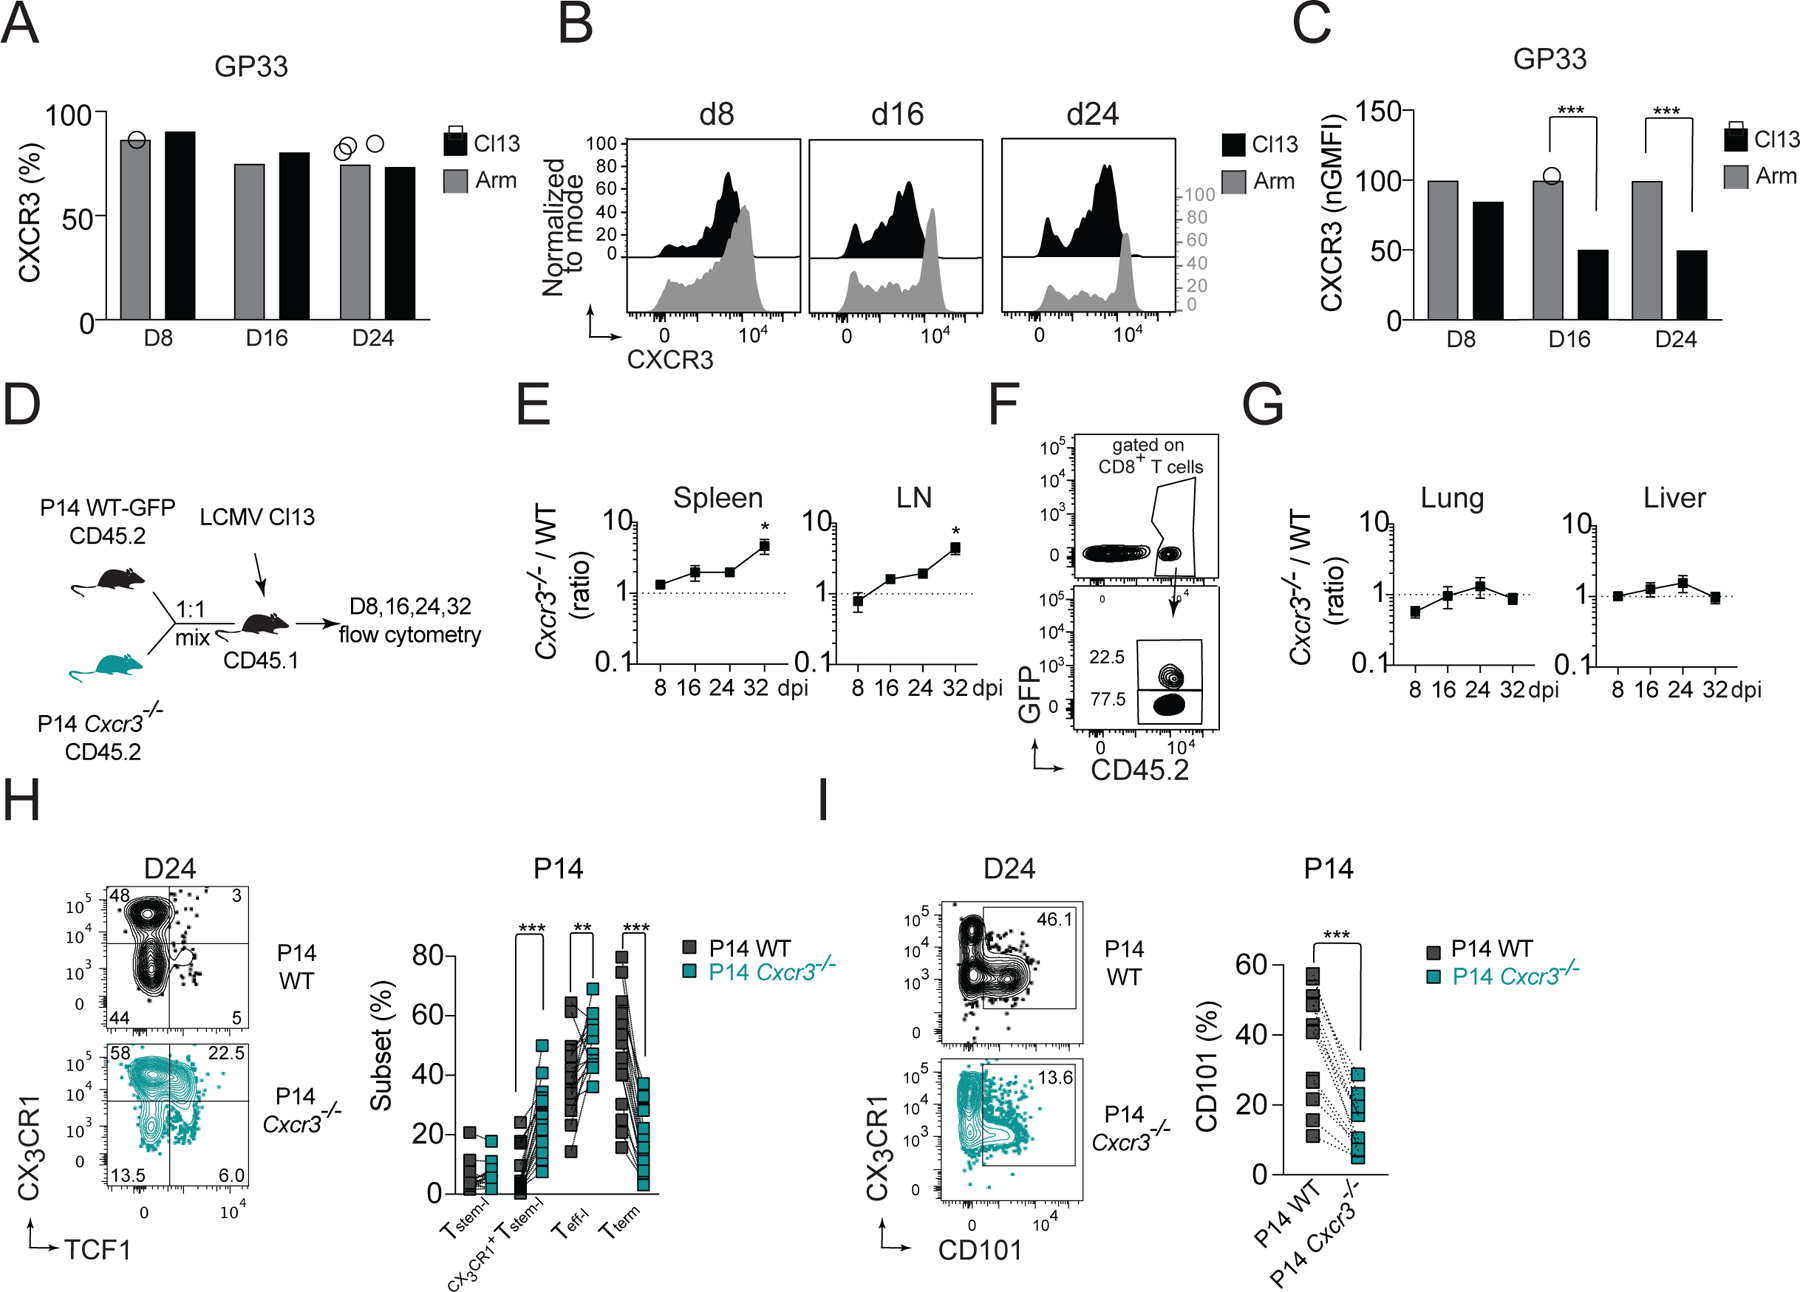
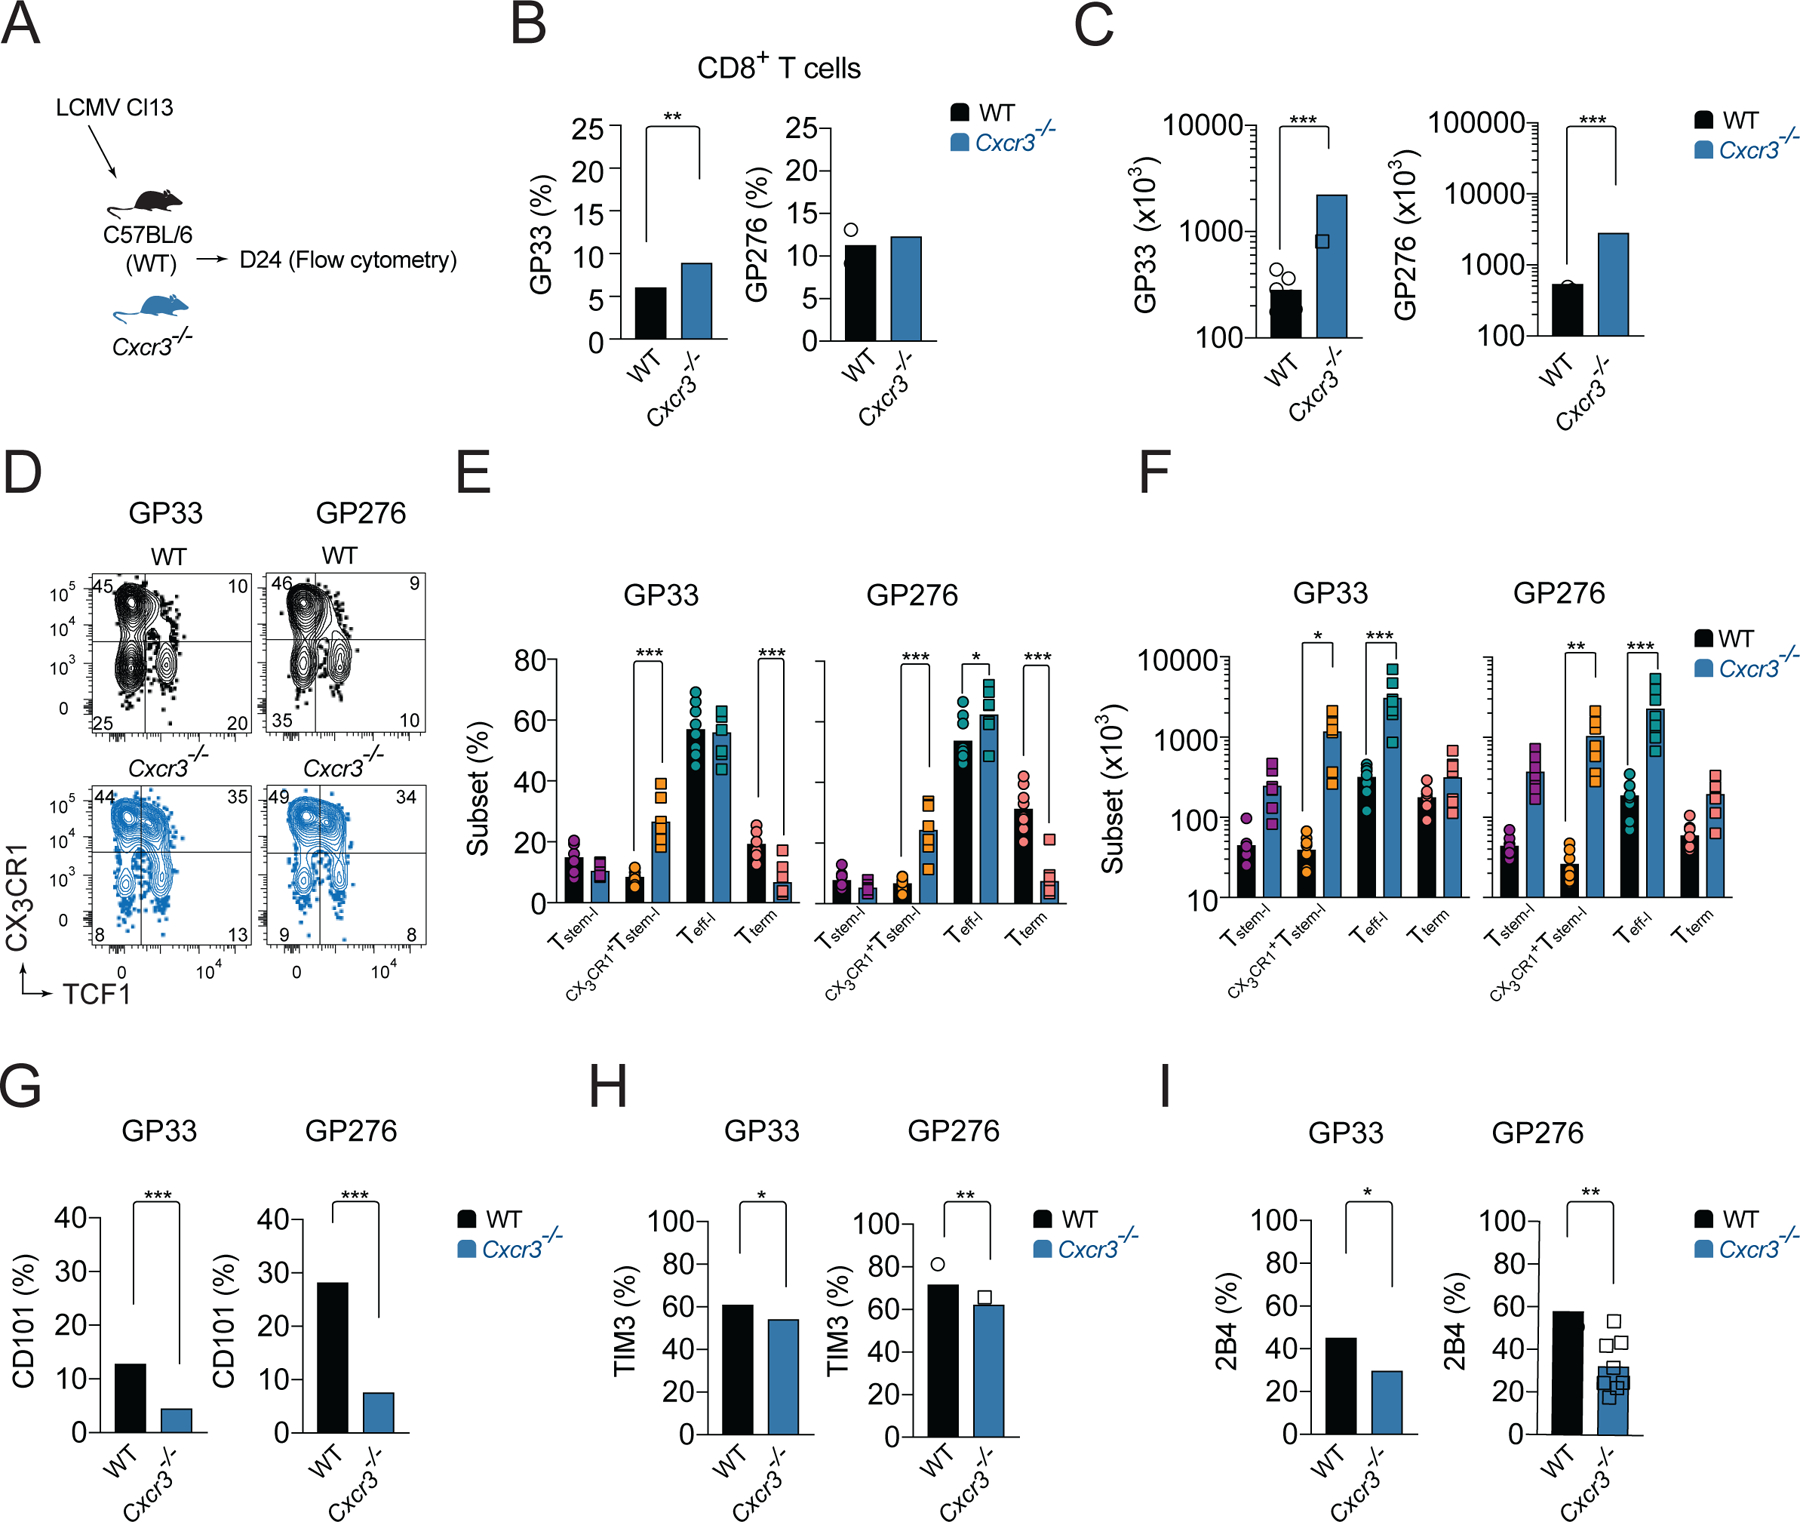
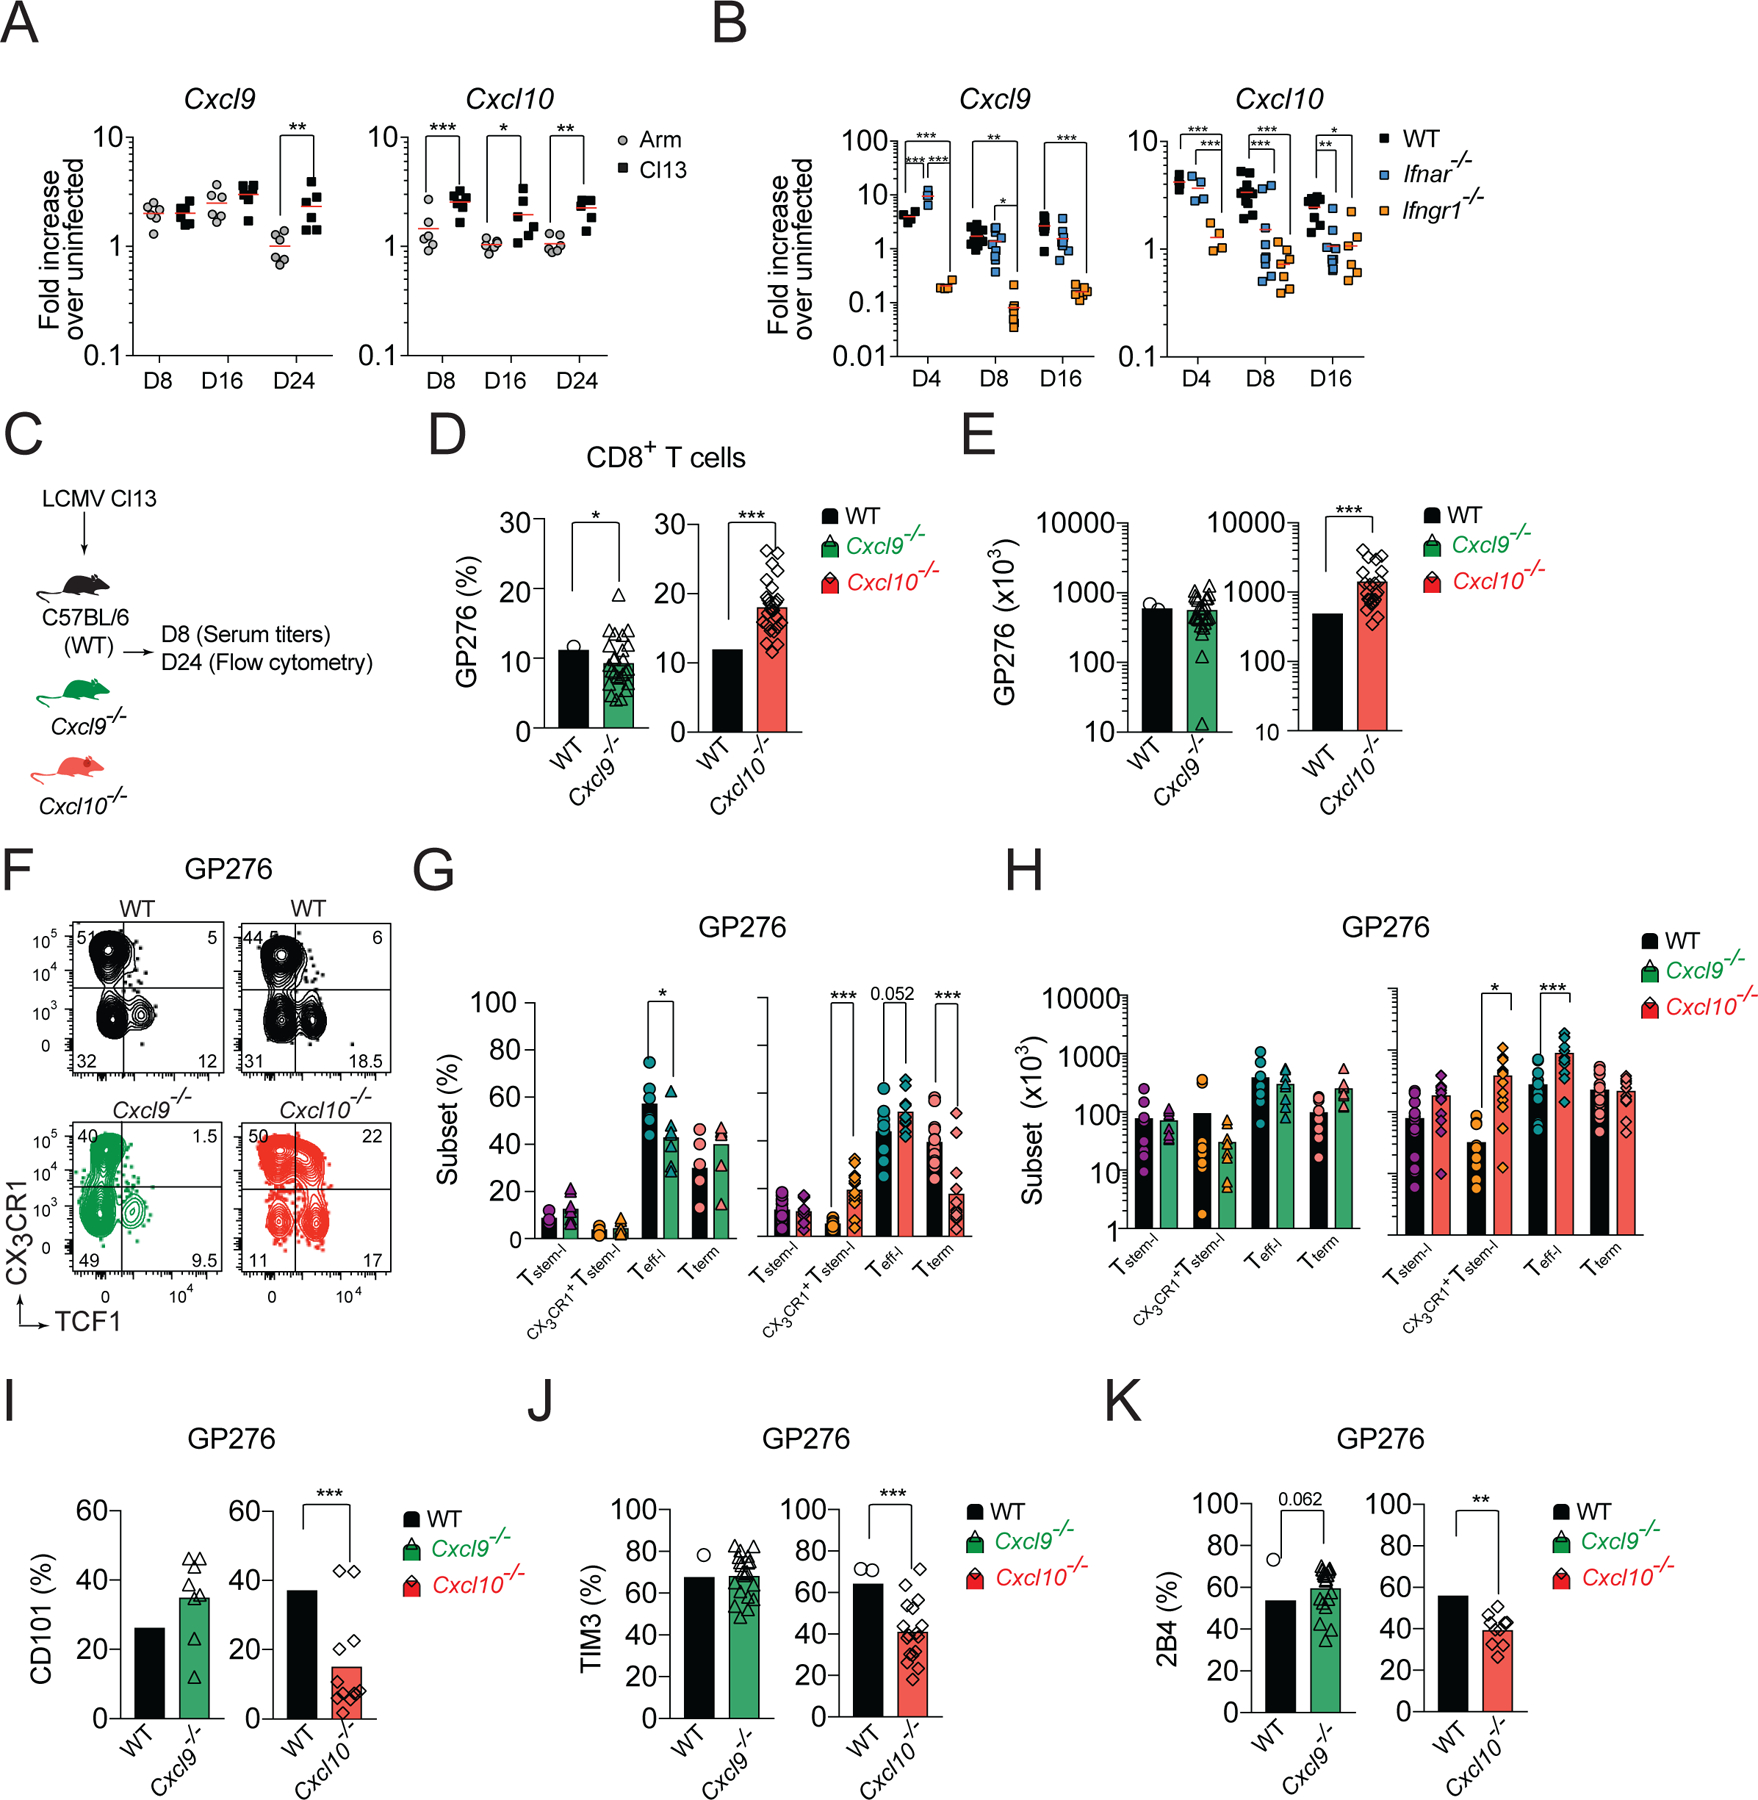
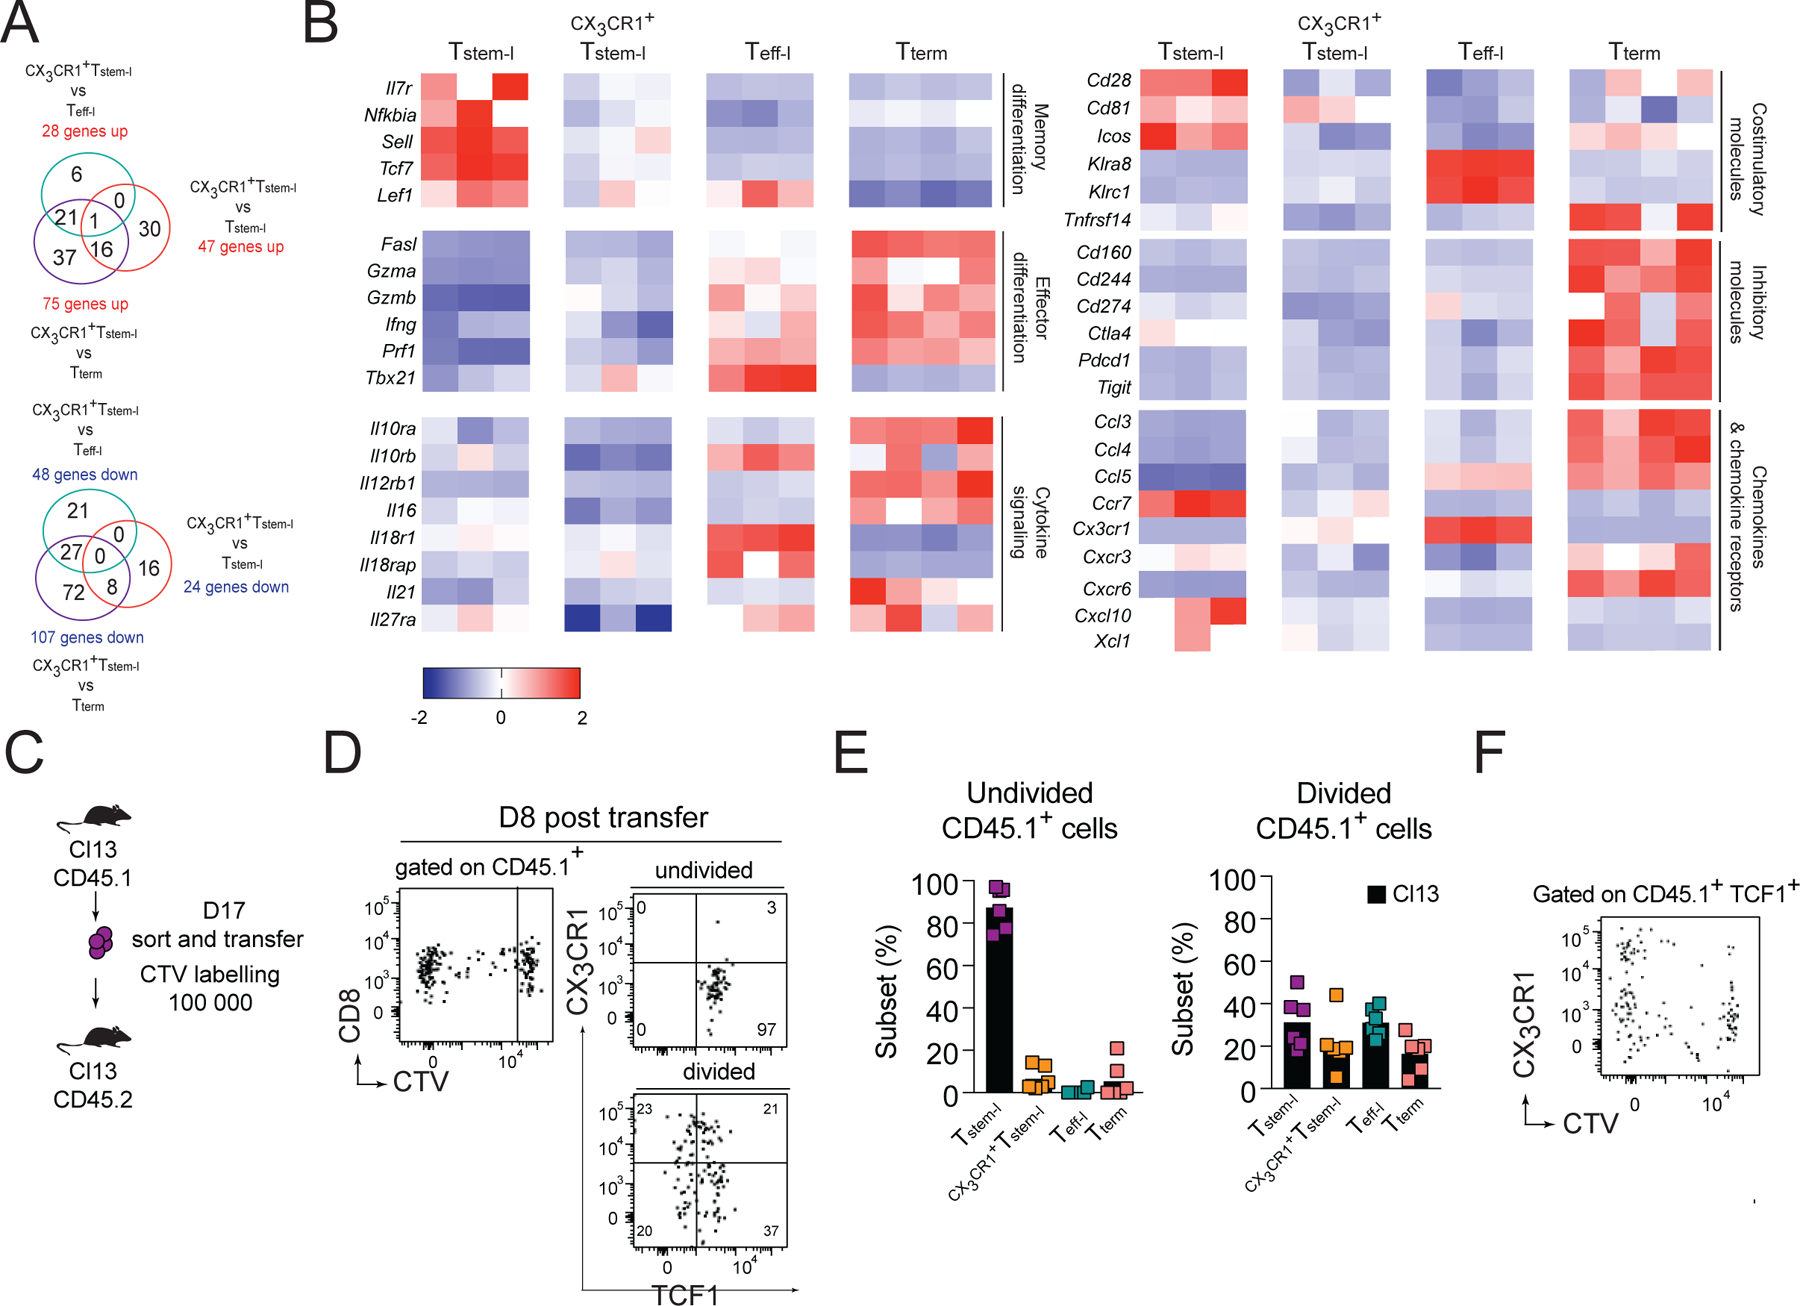
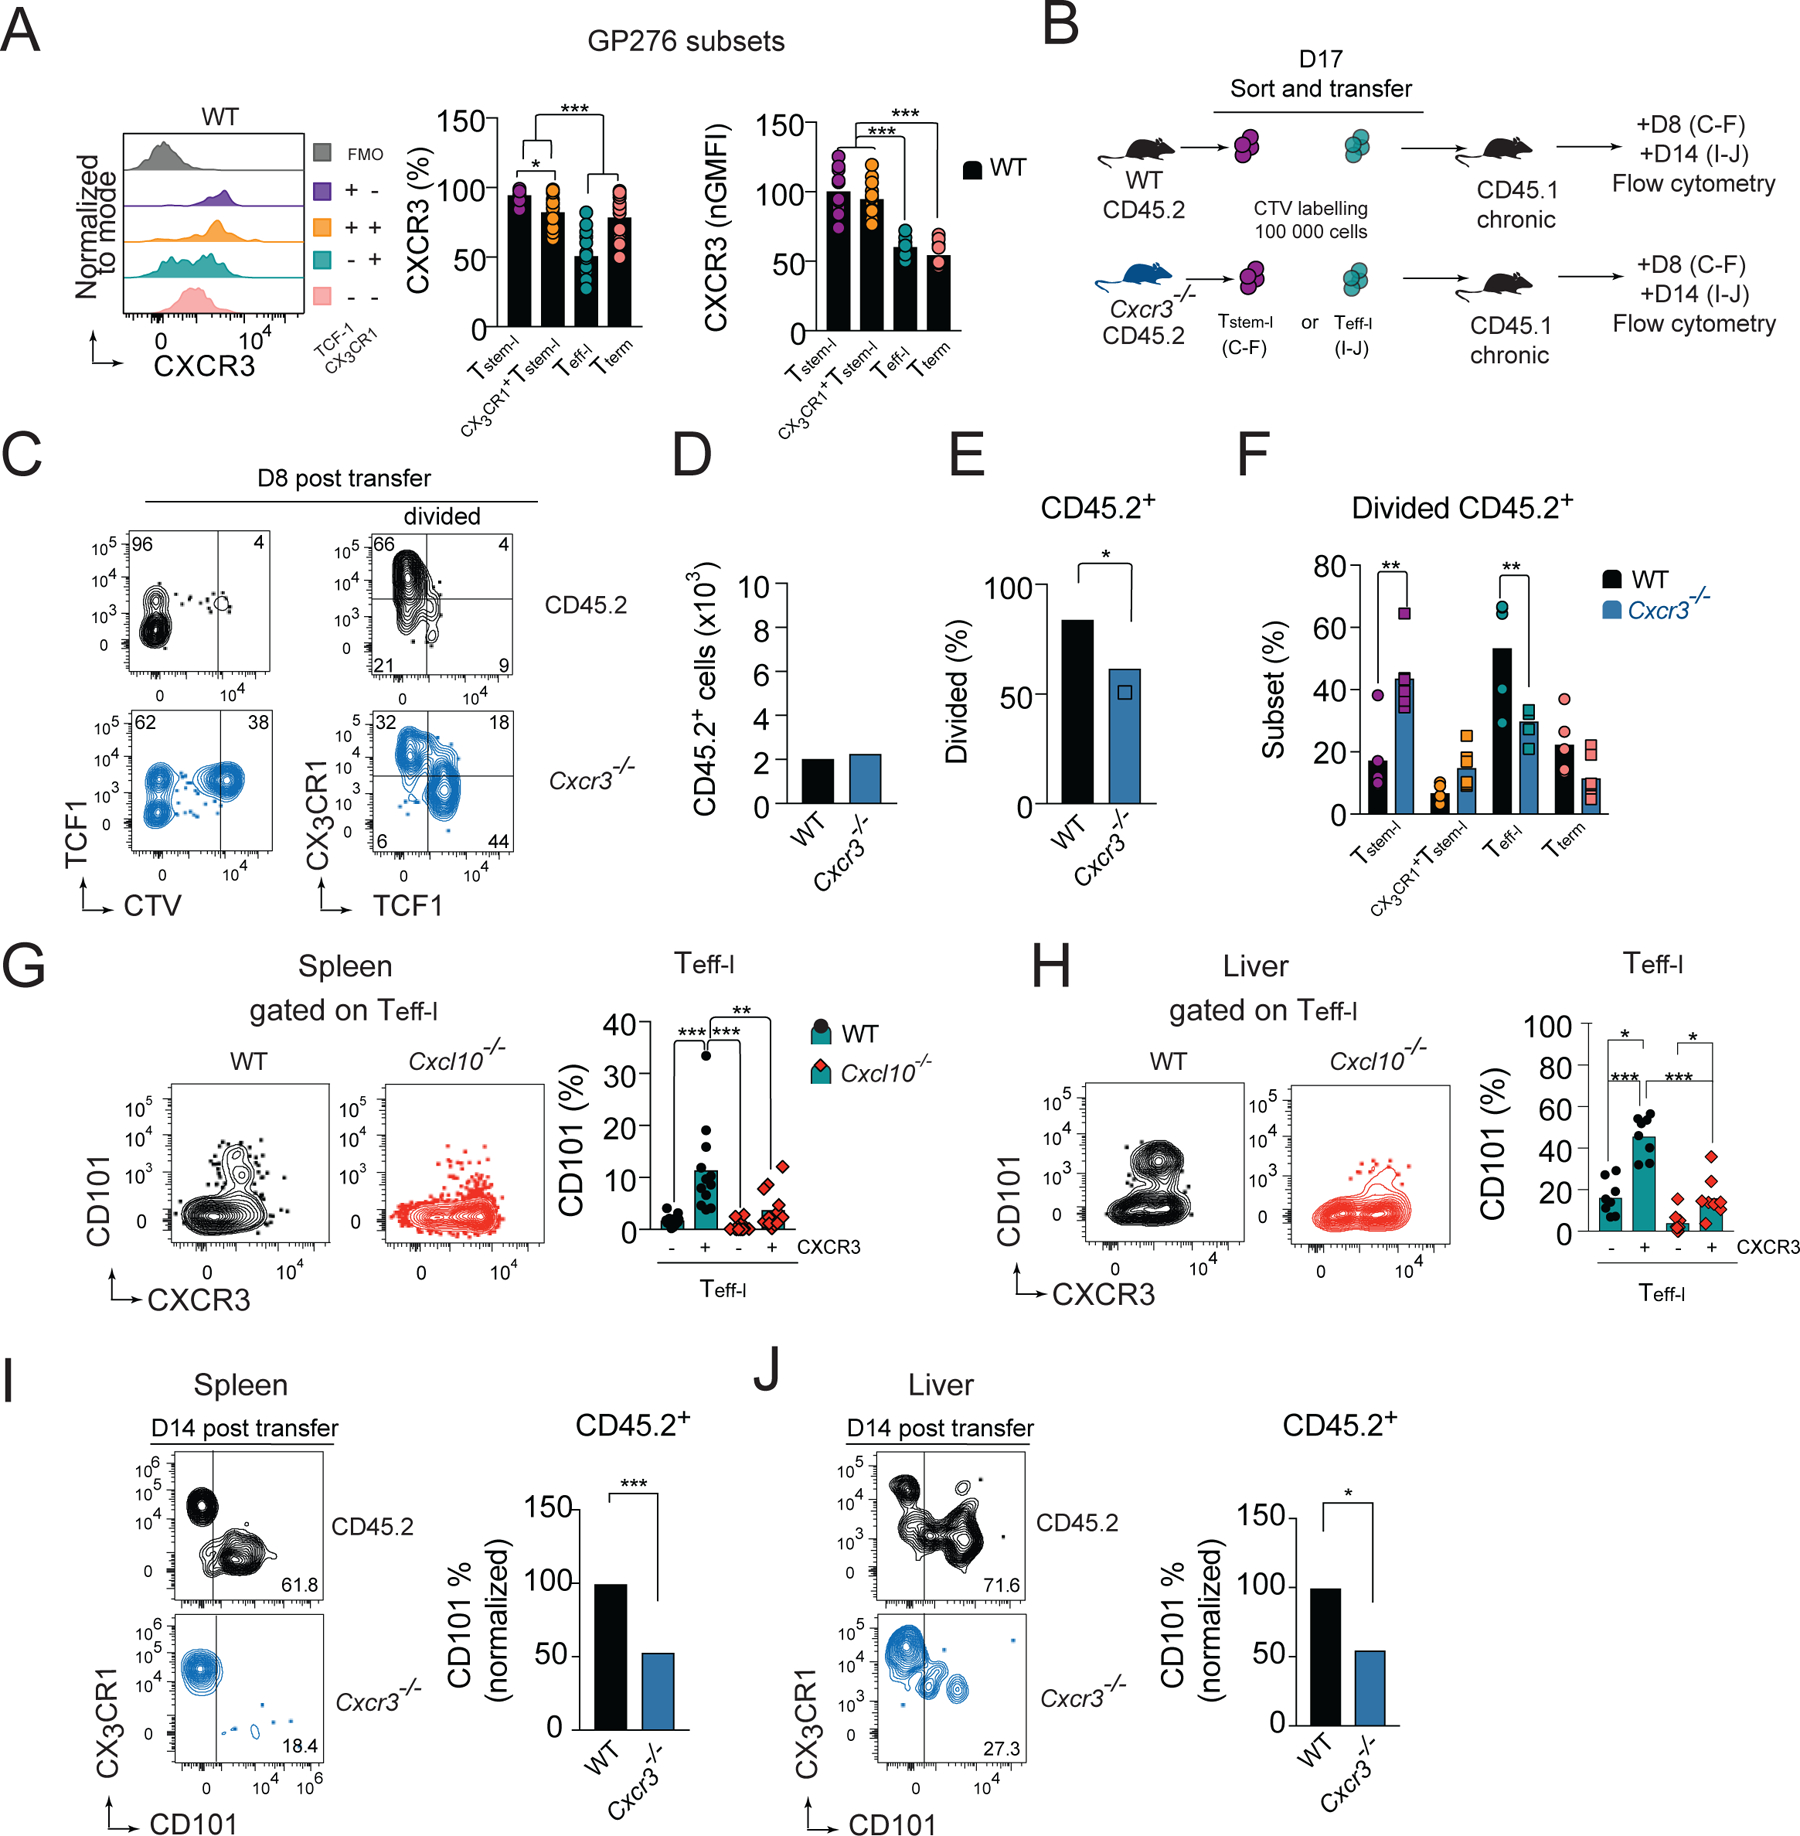
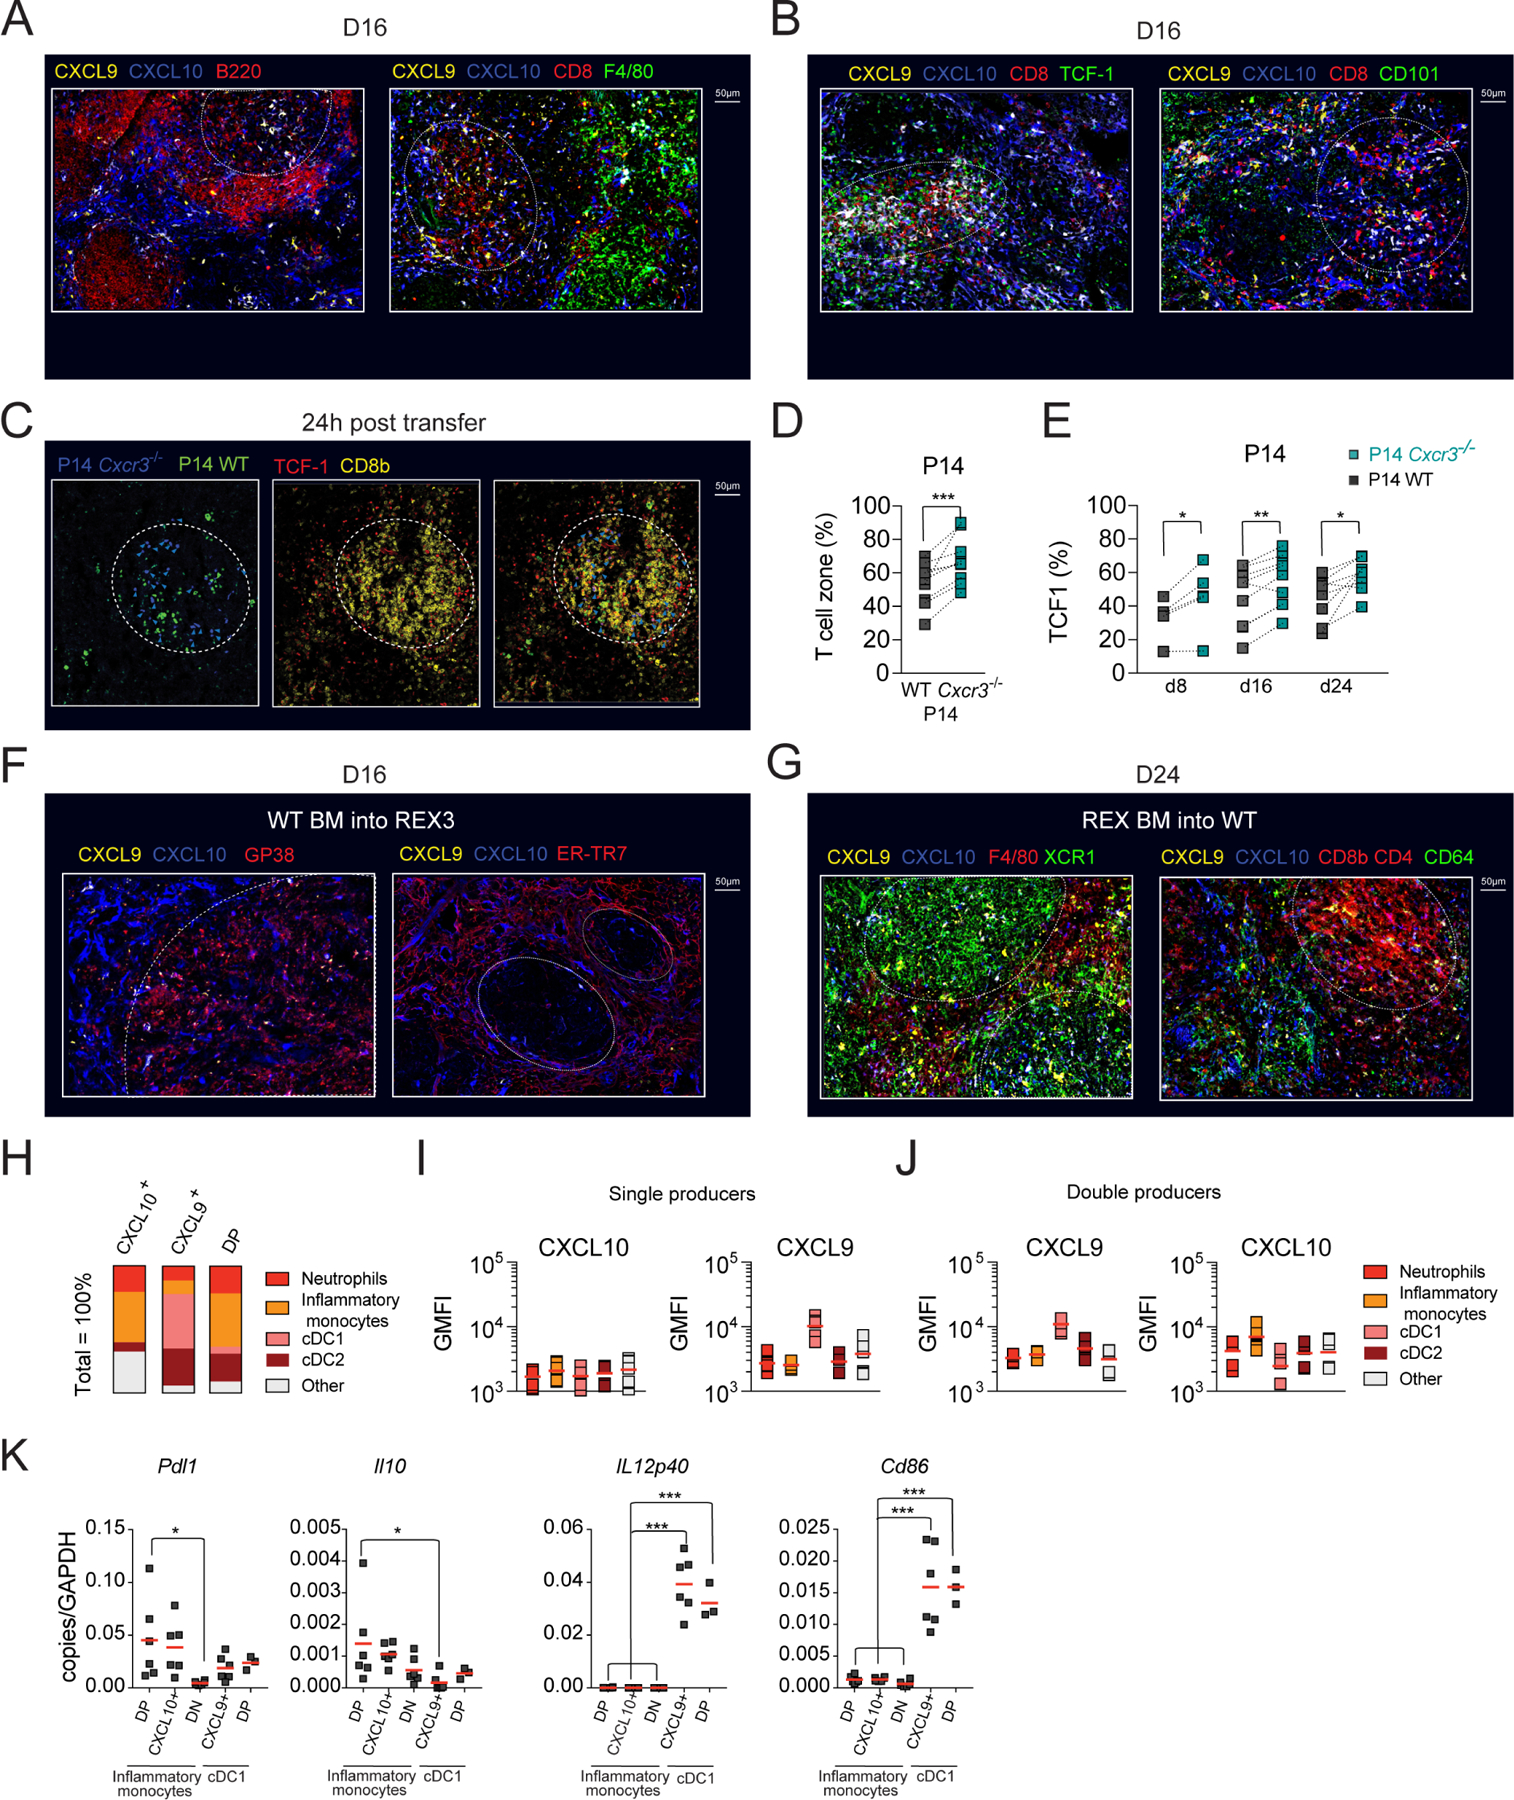
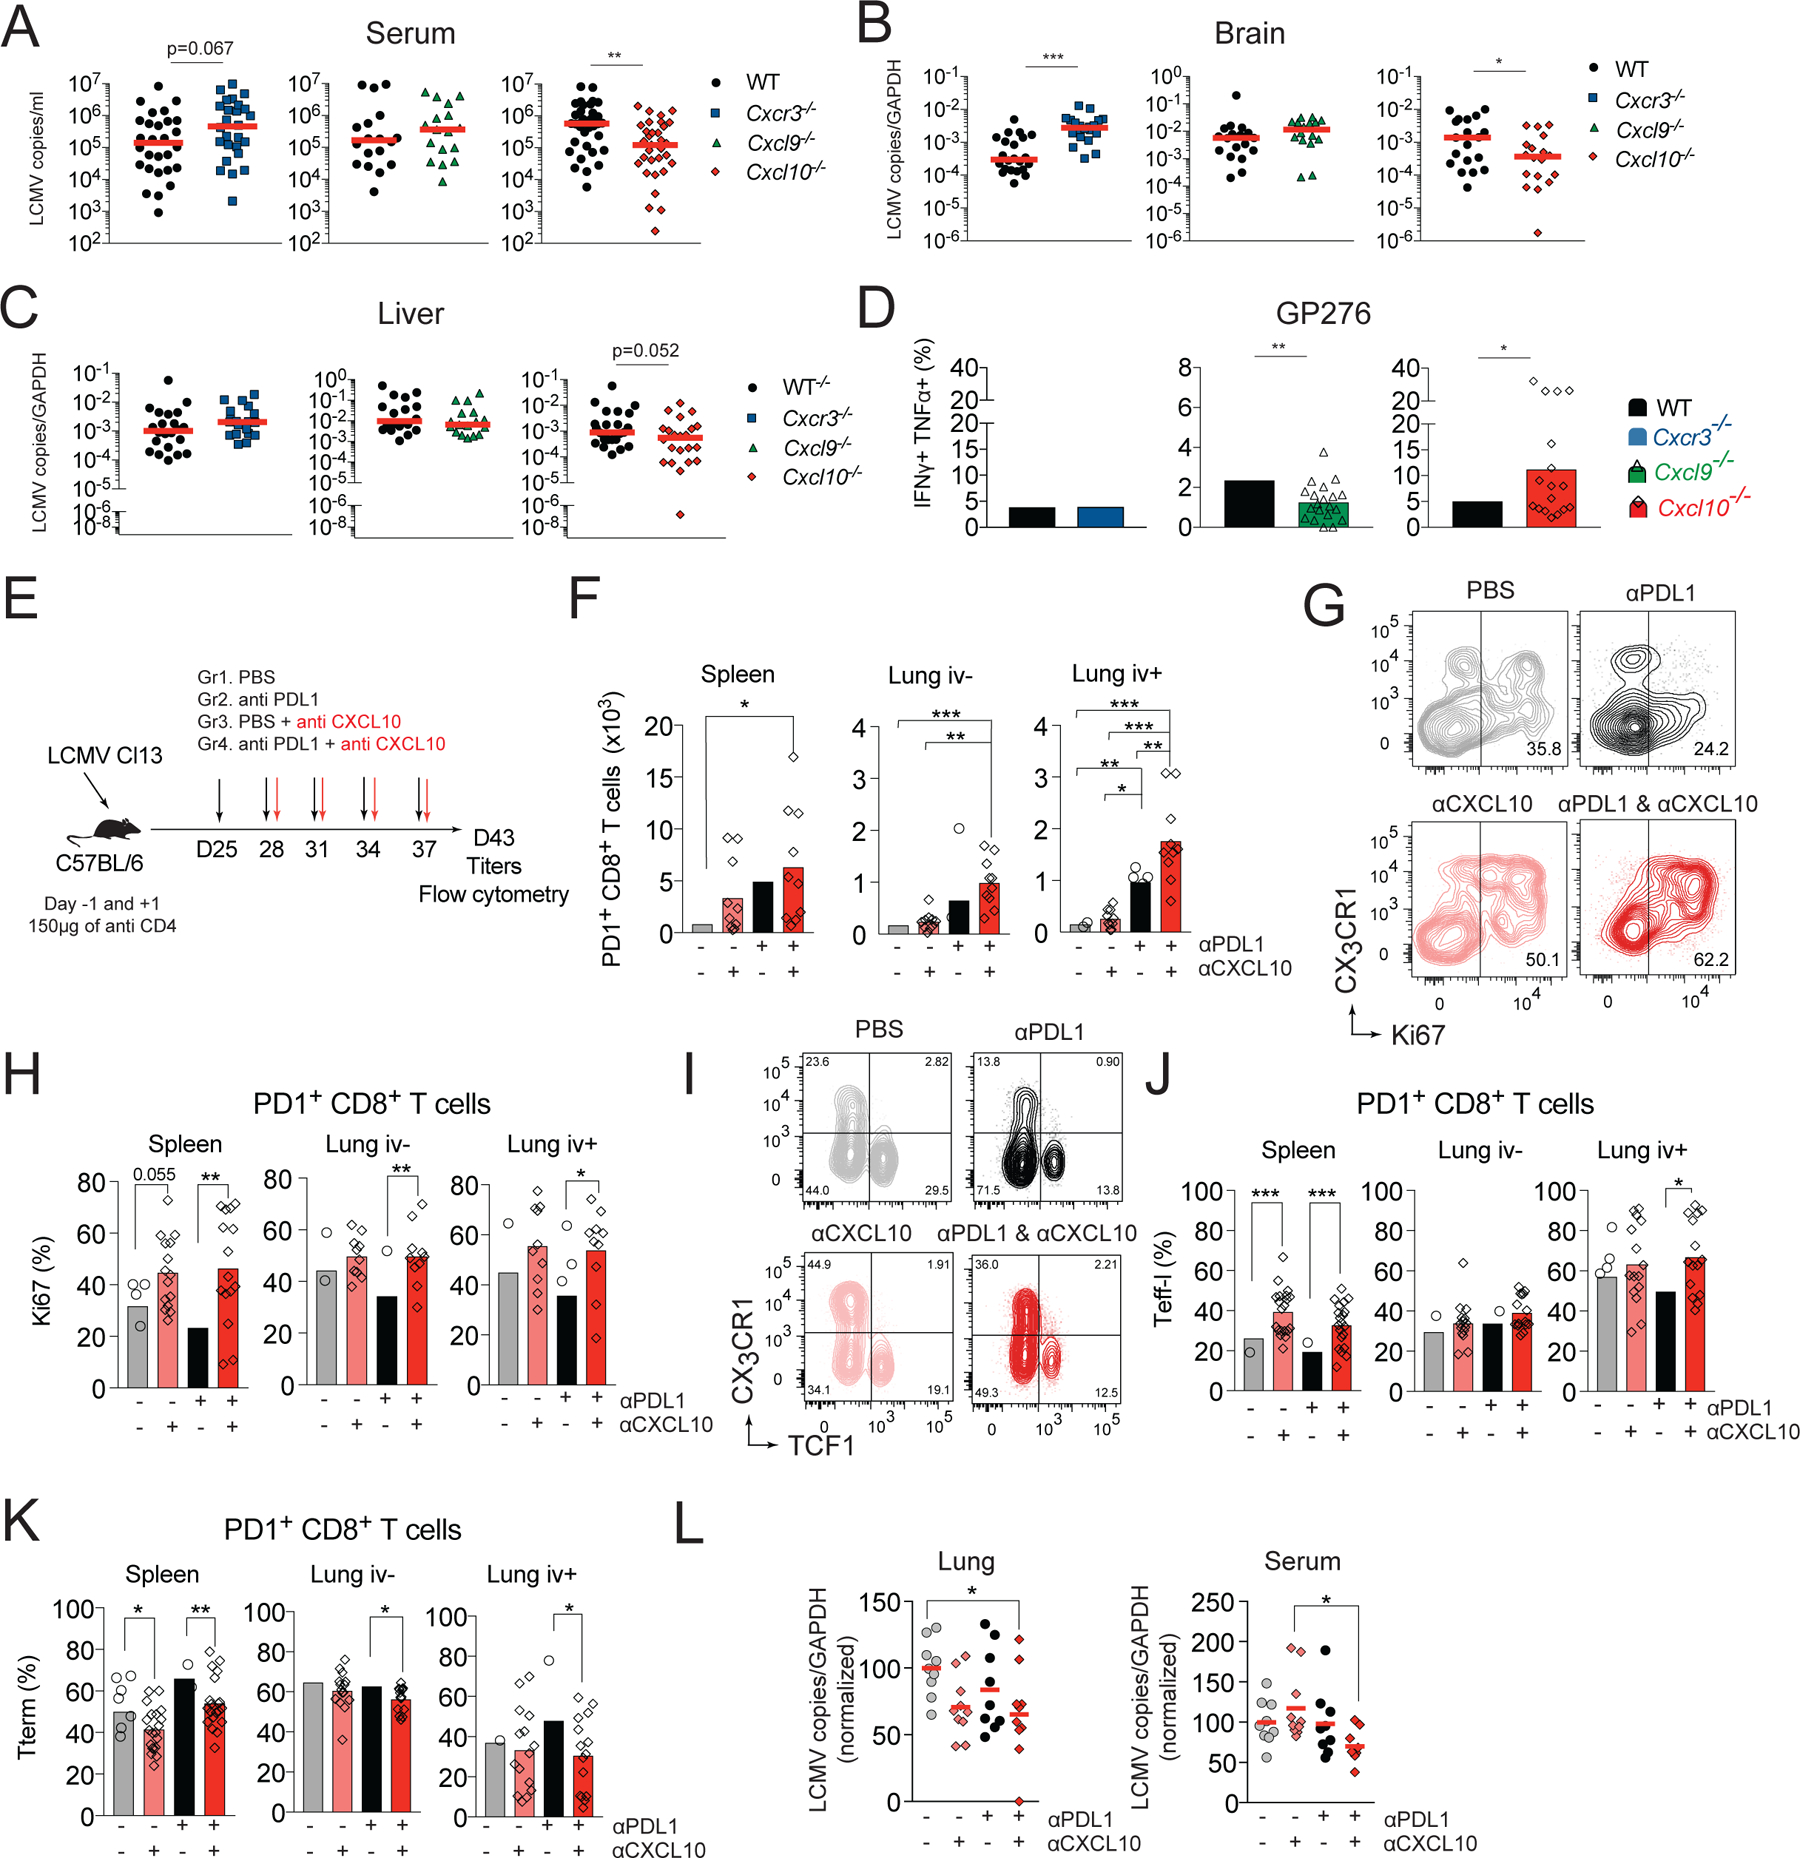
CD8+ T cells responding to chronic infection adapt an altered differentiation program that provides some restraint on pathogen replication yet limits immunopathology. This adaptation is imprinted in stem-like cells and propagated to their progeny. Understanding the molecular control of CD8+ T cell differentiation in chronic infection has important therapeutic implications. Here, we find that the chemokine receptor CXCR3 is highly expressed on viral-specific stem-like CD8+ T cells and that one of its ligands, CXCL10, regulates the persistence and heterogeneity of responding CD8+ T cells in spleens of mice chronically infected with lymphocytic choriomeningitis virus. CXCL10 is produced by inflammatory monocytes and fibroblasts of the splenic red pulp, where it grants stem-like cells access to signals promoting differentiation and limits their exposure to pro-survival niches in the white pulp. Consequently, functional CD8+ T cell responses are greater in Cxcl10-/- mice and are associated with a lower viral set point.

Keywords: CD8+ T cells; CXCL10; CXCR3; LCMV; T cell exhaustion; TCF-1; T cell differentiation; chemokine; chronic viral infection.


Conflict of interest statement

Declaration of interests T.R.M is a founder, shareholder, and member of the advisory board of Monopteros Therapeutics, Inc. The remaining authors declare no competing interests.

Figures

Figure 1.
Figure 1.. CXCR3 controls the magnitude and heterogeneity of the LCMV-specific CD8+ T cell response in cell intrinsic manner.
(A-C) Kinetics of CXCR3 expression on splenic GP33-specific cells isolated from C57BL/6 WT mice during acute (Arm) and chronic (Cl13) infection. Percentage of CXCR3+ cells among GP33-specific cells (A); flow cytometry histograms of CXCR3 expression on GP33-specific cells (B), and amount of CXCR3 expression on GP33-specific cells (normalized to Arm) (C). (D-I) CD45.1 mice received an adoptive transfer of 1:1 mixture of CD45.2 positive GFP+ WT P14 and Cxcr3−/− P14 cells followed by infection with Cl13. (D) Experimental scheme. (E-G) The ratio of Cxcr3−/−/WT P14 cells recovered from spleen and LNs (E) with exemplary gating of transferred cells on d24 (F), or the ratio of Cxcr3−/−/WT P14 cells recovered from parenchyma of liver and lung (G) pi. with Cl13. (H-I) Frequency of T cell subsets based on the expression of TCF1 and CX3CR1 among WT and Cxcr3−/− P14 cells (H) and frequency of CD101+ P14 cells (I) in spleens on d24 pi. with Cl13. Data are from at least two independent experiments (n=3–4 per time point). Data in A, C and H were analyzed with an ordinary one-way Anova test with Sidak’s multiple comparison test; data in E and G with Dunnett’s multiple comparison test; and data in I with paired Student’s t-test; *, P < 0.05; **, P < 0.01; ***, P < 0.001. See also Figure S1.
Figure 2.
Figure 2.. CXCR3 deficiency results in increased CX3CR1+Tstem-l and Teff-l LCMV-specific CD8+ T cell responses.
(A-I) WT or Cxcr3−/− mice were infected with Cl13 and the phenotype of splenic LCMV-specific responses was analyzed on d24 pi. (A) Experimental scheme. (B-C) Percentage (B) and total numbers (C) of GP33- and GP276-specific cells. (D-F) Frequency and total number of T cell subsets based on the expression of TCF1 and CX3CR1 among LCMV-specific cells. Flow cytometry representative graphs (D), quantification (E) and total numbers (F). (G-I) Frequency of CD101 (G), TIM3 (H), and 2B4 (I) expressing cells among LCMV-specific cells. Data are from at least two independent experiments (n=3–4 per time point). Data in B and G-I were analyzed with unpaired Student’s t-test; data in C with Mann-Whitney test; and data in E, F with an ordinary one-way Anova test with Sidak’s multiple comparison test; *, P < 0.05; **, P < 0.01; ***, P < 0.001. See also Figure S1.
Figure 3.
Figure 3.. CXCL10 controls the magnitude and heterogeneity of LCMV-specific CD8+ T cell response.
(A) Fold increase in Cxcl9 and Cxcl10 mRNA expression in the spleen of WT mice on the indicated days pi. with Cl13 or Arm relative to uninfected. (B) Fold increase in Cxcl9 and Cxcl10 mRNA expression in the spleen of WT, Ifnar−/−, and Ifnγr−/− mice on the indicated days pi. with Cl13 relative to uninfected. (C-J) WT, Cxcl9−/−, or Cxcl10−/− mice were infected with Cl13 and phenotype of splenic GP276-specific cells was analyzed on d24 pi. (C) Experimental scheme. (D-E) Percentage (D) and total numbers (E) of GP276-specific cells. (F-H) Flow cytometry representative graphs (F), quantification (G) and total numbers (H) of T cell subsets based on the expression of TCF1 and CX3CR1 among GP276-specific cells. (I-K) Frequency of CD101 (I); TIM3 (J); and 2B4 (K) positive cells among GP276-specific cells. Data are from at least two independent experiments (n=3–4 per time point). Data in A, B and G, H were analyzed with an ordinary one-way Anova with Sidak’s multiple comparison test; and data in D-E and I-K with unpaired Student’s t-test; *, P < 0.05; **, P < 0.01; ***, P < 0.001. See also Figure S1.
Figure 4.
Figure 4.. CX3CR1+Tstem-l have a distinct transcriptional signature
(A-B) Ly108, CX3CR1 and CD101 were used to distinguish and sort four T cell subsets from WT mice for analysis of differentially expressed genes using NanoString. (A) Number of differentially expressed genes between CX3CR1+Tstem-l and other T cell subsets. (B) Heatmap representing relative expression of selected differentially expressed genes between all subsets. (C-F) Congenically marked CX3CR1Ly108+CD44+PD1+ CD8+ T cells (Tstem-l) were sorted from d17 Cl13-infected mice, labelled with cell tracker violet (CTV) and transferred into infection matched recipients. (C) Experimental scheme. (D) Proliferation and differentiation of Tstem-l in the spleen on d8 post-transfer. (E) Frequency of distinct subsets among undivided and divided cells. (F) Representative flow cytometry plot showing CX3CR1 and CTV expression on transferred cells that remained TCF1 positive. Data are from at least two independent experiments (n=3–4 per time point). Data in B were analyzed with the use of nSolver and multiple comparison test with Benjamini-Yekutieli False Discovery Rate method; *, P < 0.05; **, P < 0.01; ***, P < 0.001. See also Figure S2.
Figure 5.
Figure 5.. CXCR3 deficiency results in improved survival and decreased TCF1 downregulation of TCF1+ cells and decreased terminal differentiation of Teff-l
(A) CXCR3 expression normalized to expression on Tstem-l and the frequency of CXCR3+ cells on distinct subsets of GP276-specific cells on d24 of Cl13 infection in WT mice. (B-F) Congenically marked cell tracker violet (CTV)-labelled CX3CR1Ly108+CD44+PD1+ CD8+ T cells (Tstem-l) from chronically infected CD45.2 WT, or CD45.2 Cxcr3−/− mice were adoptively transferred into infection matched CD45.1 recipient. (B) Experimental scheme. (C) Flow cytometry plots of recovered cells. (D-F) The total number of recovered cells (D), percentage of divided cells (E), and phenotype of divided cells (F) among adoptively transferred WT and Cxcr3−/− cells on d8 post-transfer. (G-H) Flow cytometry plots and quantification of CD101 expression on CXCR3 and CXCR3+ Teff-l on d24 pi. with Cl13 in WT and Cxcl10−/− mice in spleen (G) and liver (H). (B, I-J) Congenically marked CX3CR1+Ly108PD1+ CD8+ T cells (Teff-l) from chronically infected CD45.2 WT or CD45.2 Cxcr3−/− mice were adoptively transferred into infection matched WT CD45.1 recipient that were treated with 150μg of CD4 depleting mAb one day before and after infection to induce stable viremia. (B) Experimental scheme. (I-J) Flow cytometry plots and frequency of CD101+ cells among transferred WT and Cxcr3−/− cells recovered from spleen (I) and liver (J) on d14 post-transfer. Data are from at least two independent experiments (n=3–4 per time point). Data in A,G and H were analyzed with an ordinary one-way Anova test with Tukey’s multiple comparison test; data in D-E, I-J with unpaired Student’s t-test; and data in F with an ordinary one-way Anova test Sidak’s multiple comparison test; *, P < 0.05; **, P < 0.01; ***, P < 0.001. See also Figure S3.
Figure 6.
Figure 6.. CXCR3 ligand expression distinguishes stimulatory and inhibitory myeloid cell subsets.
(A-B) Pattern of CXCL10 and CXCL9 expression in Cl13-infected spleens. REX3 (CXCL9 and CXCL10 dual fluorescent reporter) mice were infected with Cl13 and on d16 pi. spleens were harvested for immunofluorescence. (A) B cell follicles (B220, red, left panel) or red pulp macrophages (F4/80, green, right panel) in infected spleens with respect to CXCL10 (blue), CXCL9 (yellow), and CXCL10 and CXCL9 double producers (white). (B) Localization of TCF1+ CD8+ T cells (left panel) and CD101+ CD8+ T cells (right panel) in infected spleens with respect to CXCL10 (blue) and CXCL9 (yellow). (C-E) WT GFP+ P14 and Cxcr3−/− P14 cells in 1:1 ratio were cultured in vitro in conditions favoring TCF1+ phenotype (Figure S4A–C) followed by transfer into d8, d16, d24 Cl13-infected CD45.1 mice and analyzed by immunofluorescence (24h post-transfer) and flow cytometry analysis (d4 post-transfer). (C) Localization of in vitro transferred cells in infected spleens. In vitro generated TCF1+ P14 WT (green asterisk) and TCF1+ Cxcr3−/− P14 cells (blue arrow) in infected spleens 24h post-transfer (left panel). Identification of T cell zones defined as TCF1 (red) and CD8b (yellow) dense regions (middle panel, white dashed circle). Localization of in vitro transferred cells with respect to naïve T cell zones (TCF1+ CD8b+, white dashed circle) (right panel). (D) Percentage of transferred cells that localized within TCF1+ CD8b+ dense areas (white dashed circle). (E) Percentage of P14 cells that express TCF1 in infected spleens on d4 post-transfer into d8, d16 and d24 Cl13-infected mice. (F-G) Localization and identity of CXCL10 and CXCL9 expressing stromal (F) or hematopoietic (G) cells in Cl13-infected spleens of WT BM into REX3 (F) or REX3 BM into WT (G) chimeras. On d24 when stroma compartment recovered from Cl13-induced destruction (F) or d16 when the reporter expression in hematopoietic compartment was highest (G), spleens were harvested and processed for immunofluorescence. (F) Gp38+ reticular fibroblasts (red, left panel) or ER-TR7+ red pulp fibroblasts (red, right panel) in infected spleens with respect to CXCL10 (blue) and CXCL9 (yellow). (G) XCR1+ (green), F4/80+ cells (red, left panel), CD8 and CD4+ (red), and CD64+ cells (green, right panel) in infected spleens with respect to CXCL10 (blue) and CXCL9 (yellow) (H-J) REX3 mice were infected with Cl13 and on d16 pi., the phenotype of CXCL10+ and CXCL9+ single positive (SP) and CXCL9+CXCL10+ double positive (DP) were analyzed by flow cytometry according to the gating strategy in Figure S5A and tabulated (H). (I-J) Expression of CXCL10 and CXCL9 among single producer (I) and double producer (J) myeloid cell subsets (GMFI calculated for positive cells). (K) Distinct myeloid cell subsets were sorted from d15 Cl13-infected mice and Pdl1, Il10, Cd86, and IL12p40 mRNA expression was determined by RT-qPCR. Images are representative of two independent experiments with n=1–2 per time point. Data are from at least two independent experiments (n=3–4 per time point). White dashed circles mark T cell zones, Data in D and E were analyzed with paired t-test; and data in K with an ordinary one-way Anova with Dunnett’s multiple comparison test; *, P < 0.05; **, P < 0.01; ***, P < 0.001. See also Figures S4 and S5.
Figure 7.
Figure 7.. CXCL10 deficiency is associated with lower viral set point and improved response to anti-PDL1.
(A-D) Paired groups of WT and Cxcr3−/−, Cxcl9−/−, or Cxcl10−/− mice were infected with Cl13 and on day 24 pi. mice were analyzed for viral titer in serum (A), brain (B) and liver (C). (D) Splenocytes from d24 infected mice were restimulated with GP276 peptide and analyzed for cytokine production by flow cytometry. Percentage of GP276-specific cells that are IFNγ+TNFα+. (E-L) WT mice were infected with Cl13 and treated with 150μg of anti-CD4 i.p. to induce stable viremia. Beginning on day 24, mice were treated with PBS, anti-CXCL10, anti-PDL1, or anti-PDL1 and anti-CXCL10 i.p. every third day for 2 weeks. Six days after the last treatment, mice were sacrificed, and organs processed for flow cytometry and viral titers. (E) Experimental scheme. (F) Total number of PD1+ CD8+ T cells in spleen and lung vascular and parenchymal compartments. (G-H) Frequency of Ki67+ cells among PD1+ CD8+ T cells in spleen and lungs. Representative flow cytometry plots (G) and quantification (H). (I-K) Representative flow cytometry plots (I) and quantification of the frequency of Teff-l (J) or Tterm (K) in spleen and lungs. (L) Viral titers in lung and serum (normalized to the no treatment group). Data are from at least two independent experiments (n=3–4 per time point). Data in A-C were analyzed with Mann-Whitney test, the red line marks median, data in D with unpaired Student’s t-test; data in F-K with Anova with Sidak’s multiple comparison test; and data in L with Tukey’s multiple comparison test *, P < 0.05; **, P < 0.01; ***, P < 0.001. See also Figure S6.

References

    1. Ahmed R, Salmi A, Butler LD, Chiller JM, and Oldstone MB 1984. Selection of genetic variants of lymphocytic choriomeningitis virus in spleens of persistently infected mice. Role in suppression of cytotoxic T lymphocyte response and viral persistence. J Exp Med 160:521–540. - PMC - PubMed
    1. Alfei F, Kanev K, Hofmann M, Wu M, Ghoneim HE, Roelli P, Utzschneider DT, von Hoesslin M, Cullen JG, Fan Y, Eisenberg V, Wohlleber D, Steiger K, Merkler D, Delorenzi M, Knolle PA, Cohen CJ, Thimme R, Youngblood B, and Zehn D 2019. TOX reinforces the phenotype and longevity of exhausted T cells in chronic viral infection. Nature 571:265–269. - PubMed
    1. Argilaguet J, Pedragosa M, Esteve-Codina A, Riera G, Vidal E, Peligero-Cruz C, Casella V, Andreu D, Kaisho T, Bocharov G, Ludewig B, Heath S, and Meyerhans A 2019. Systems analysis reveals complex biological processes during virus infection fate decisions. Genome Res 29:907–919. - PMC - PubMed
    1. Barber DL, Wherry EJ, Masopust D, Zhu B, Allison JP, Sharpe AH, Freeman GJ, and Ahmed R 2006. Restoring function in exhausted CD8 T cells during chronic viral infection. Nature 439:682–687. - PubMed
    1. Blank CU, Haining WN, Held W, Hogan PG, Kallies A, Lugli E, Lynn RC, Philip M, Rao A, Restifo NP, Schietinger A, Schumacher TN, Schwartzberg PL, Sharpe AH, Speiser DE, Wherry EJ, Youngblood BA, and Zehn D 2019. Defining ‘T cell exhaustion’. Nat Rev Immunol 19:665–674. - PMC - PubMed

Publication types

MeSH terms