. 2022 Feb;602(7895):156-161.
doi: 10.1038/s41586-021-04248-x. Epub 2021 Nov 30.

An autoimmune stem-like CD8 T cell population drives type 1 diabetes

Affiliations

An autoimmune stem-like CD8 T cell population drives type 1 diabetes

Sofia V Gearty et al. Nature. 2022 Feb.

Abstract

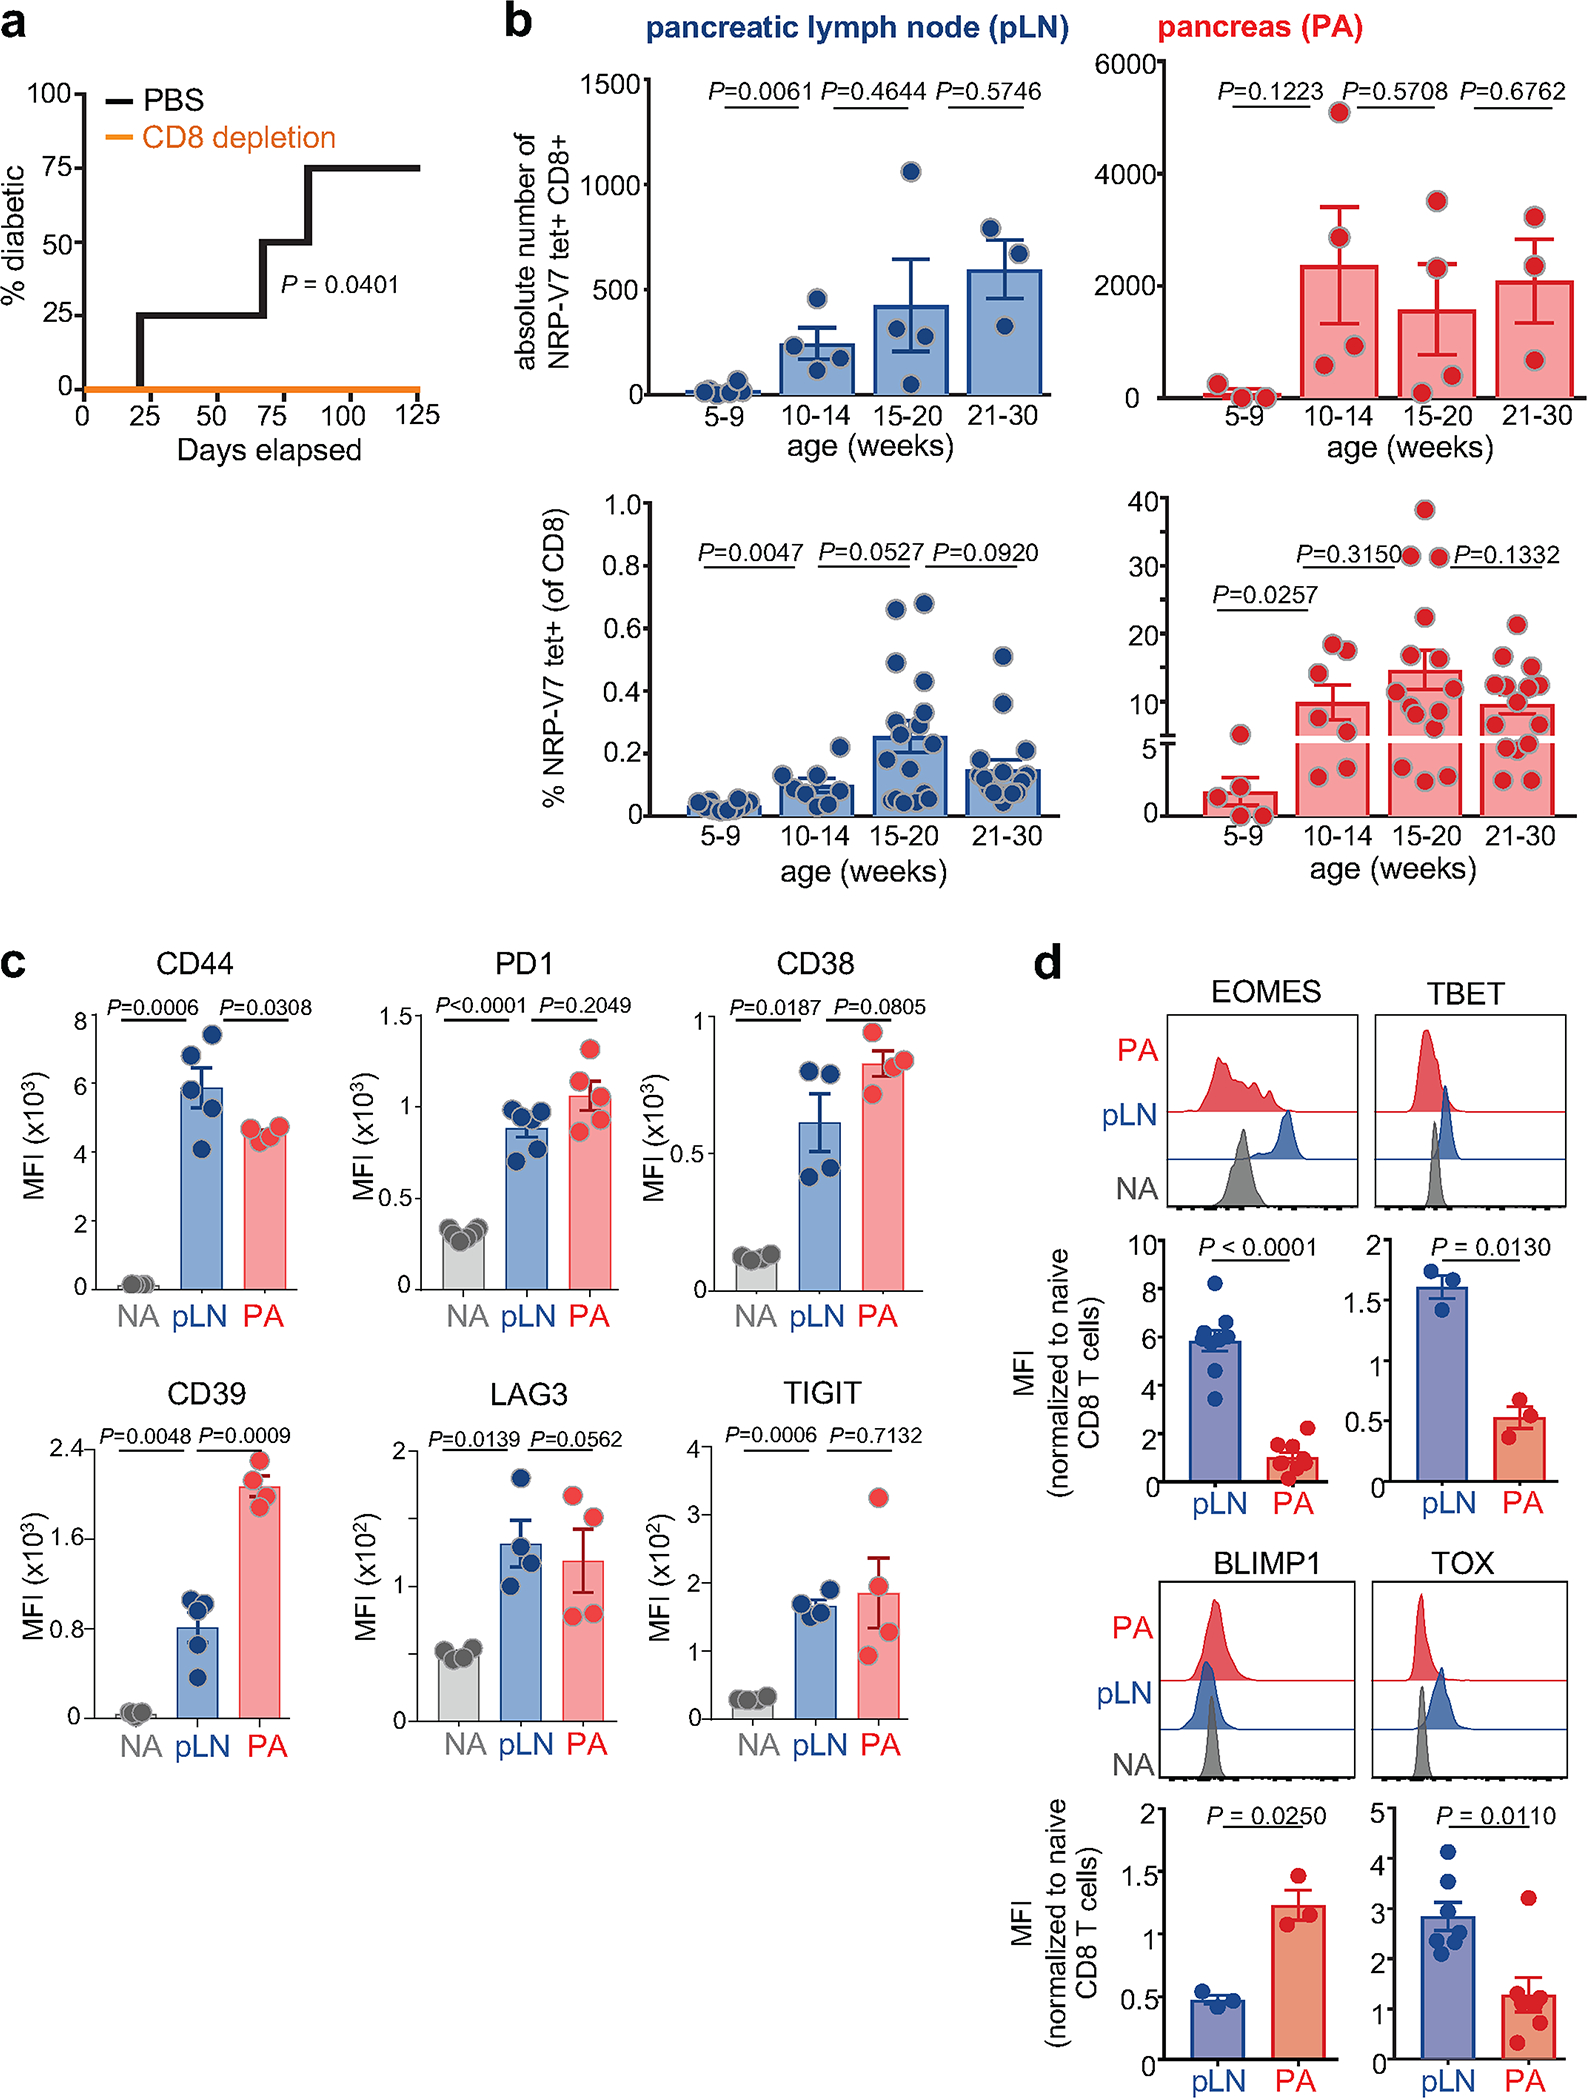
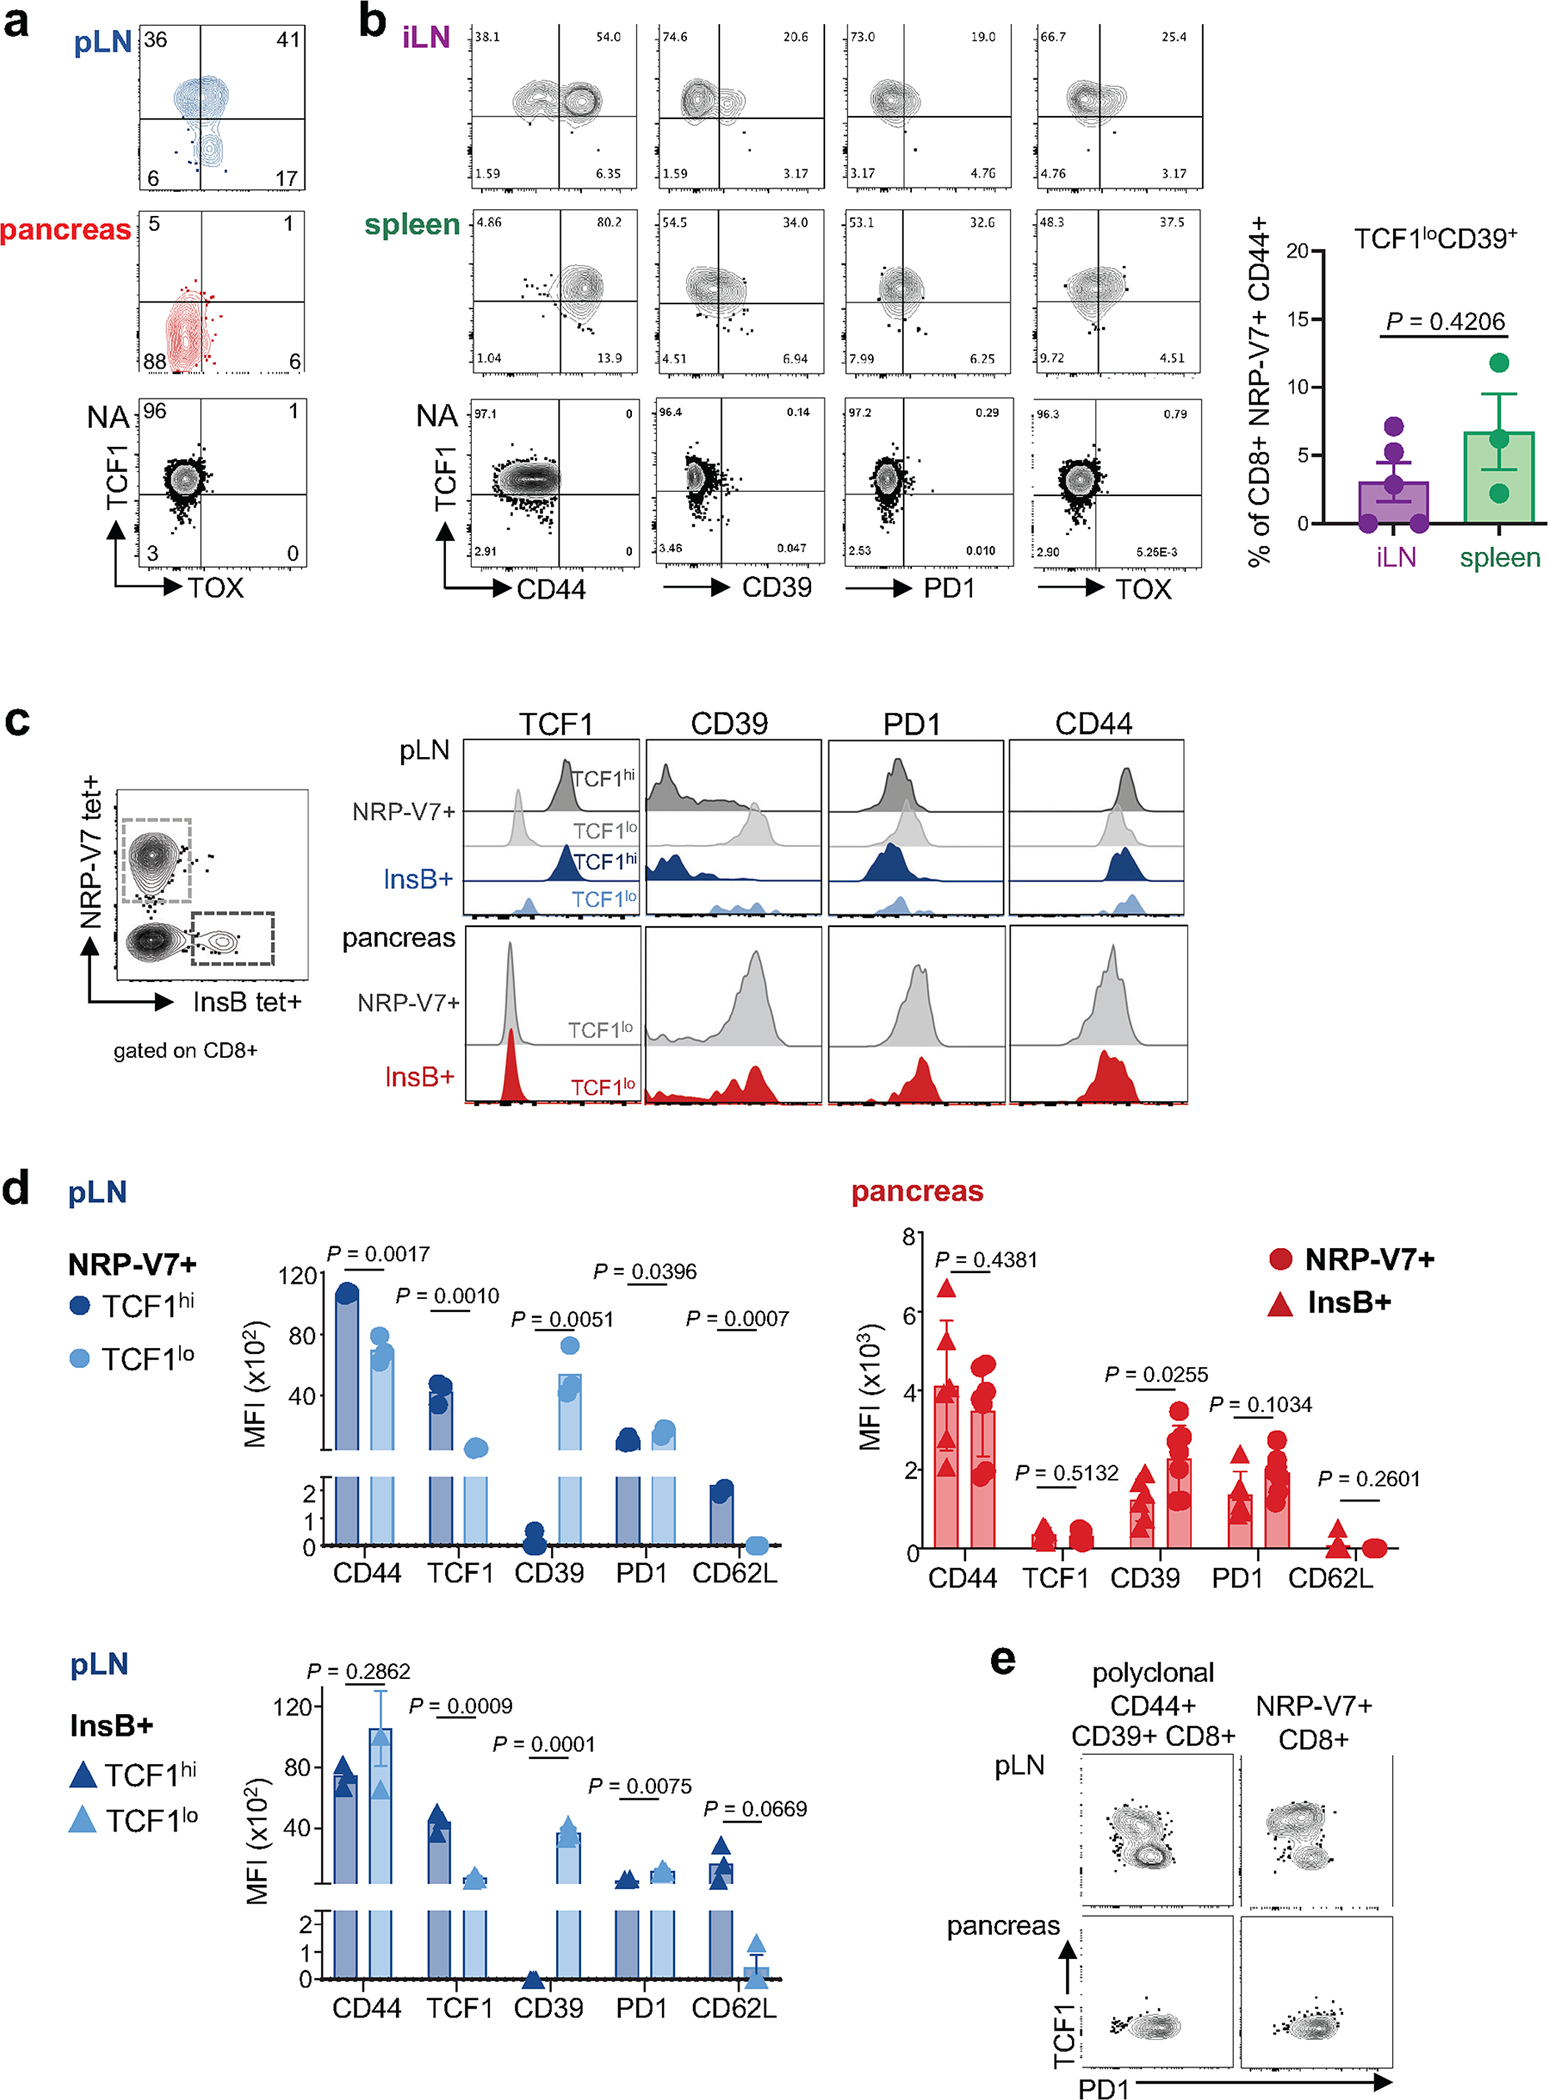
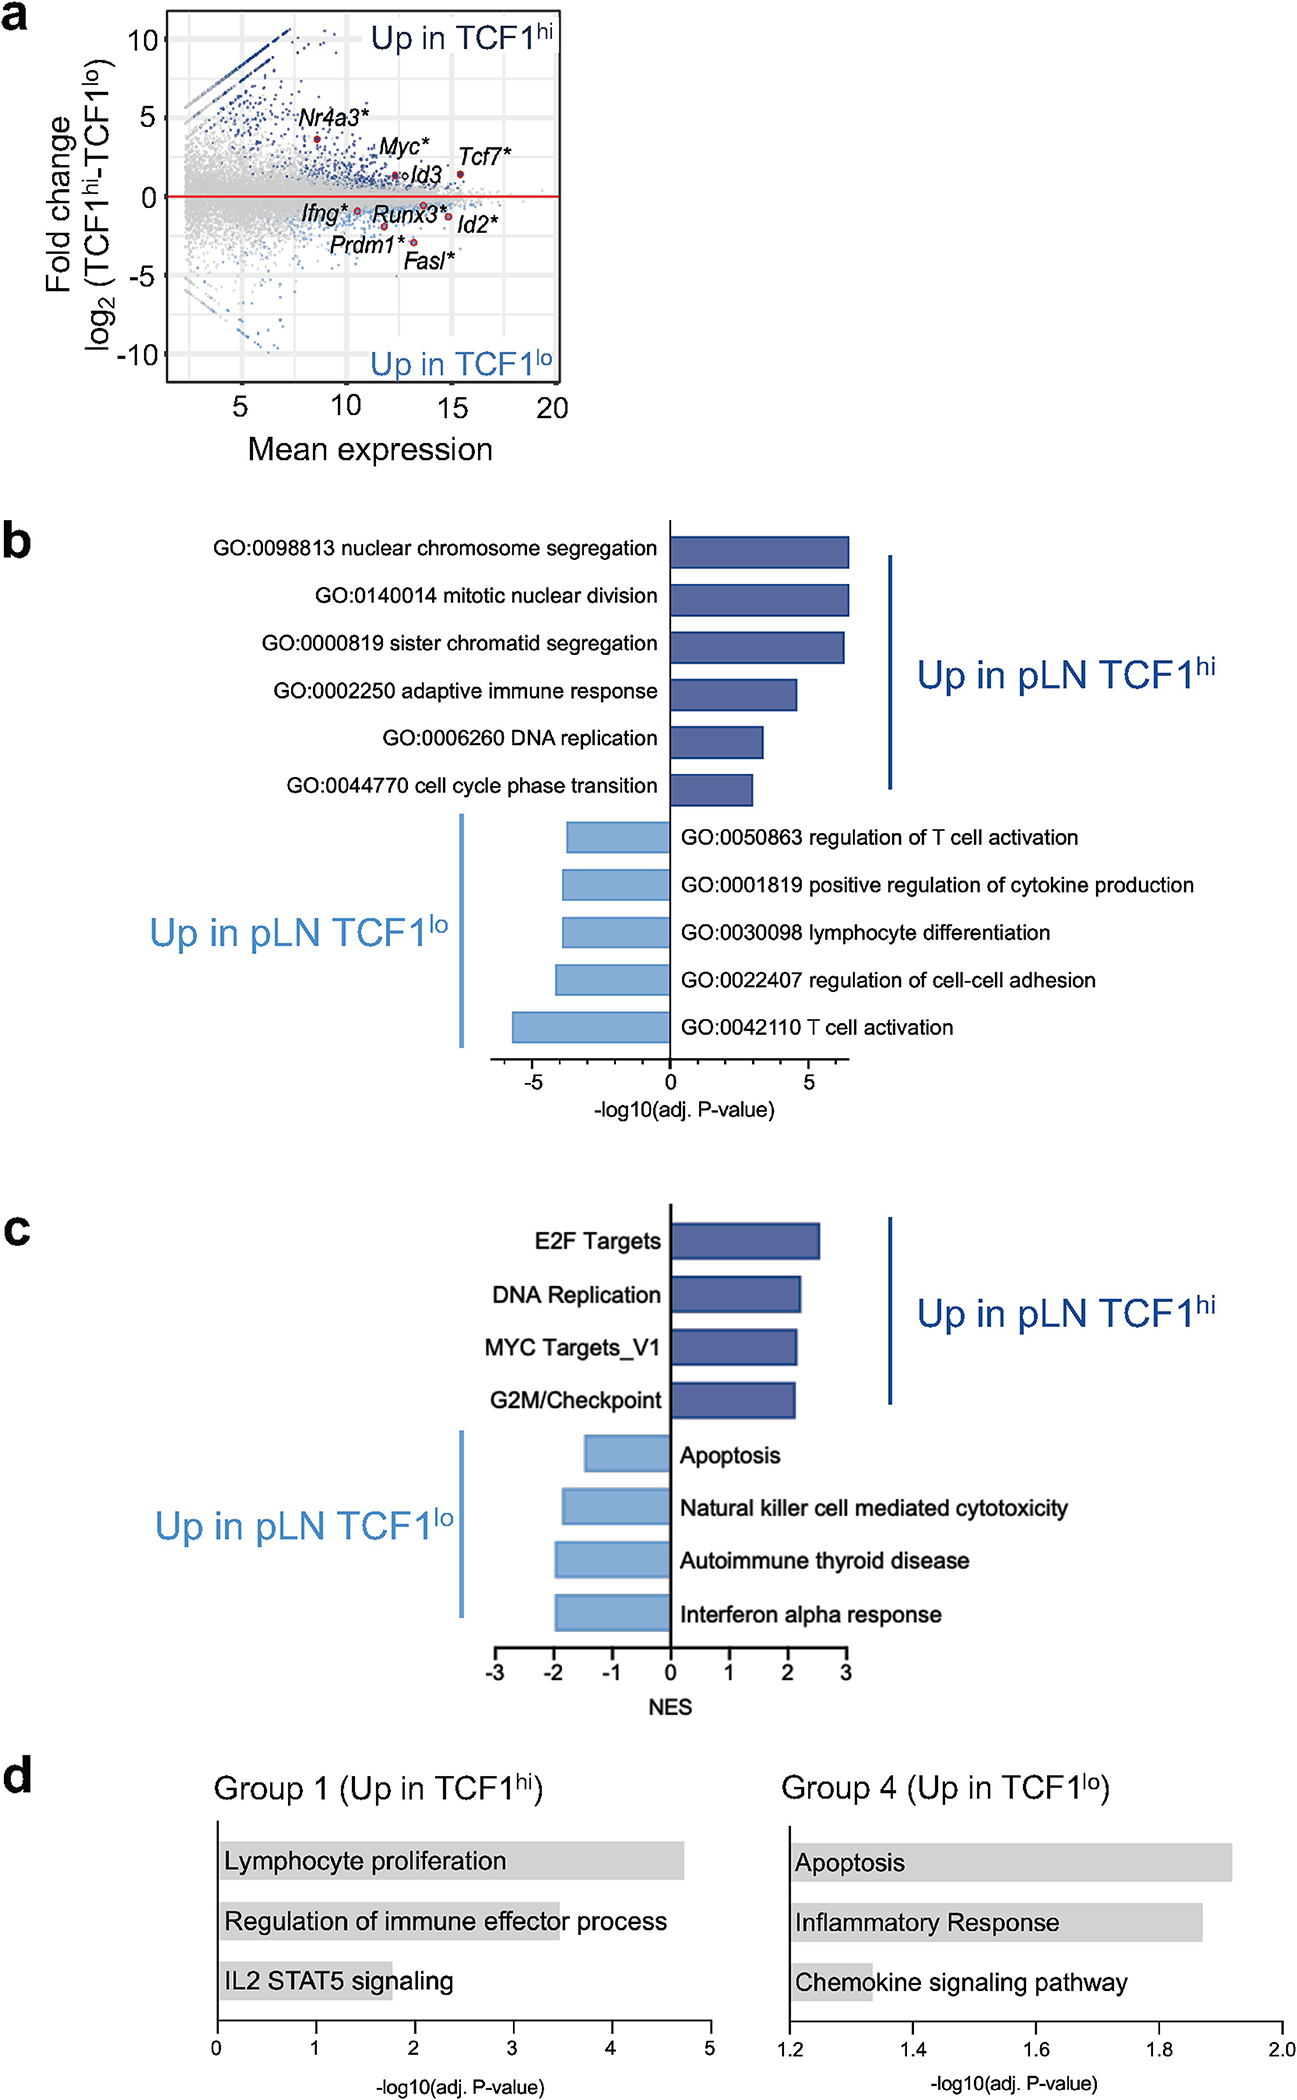
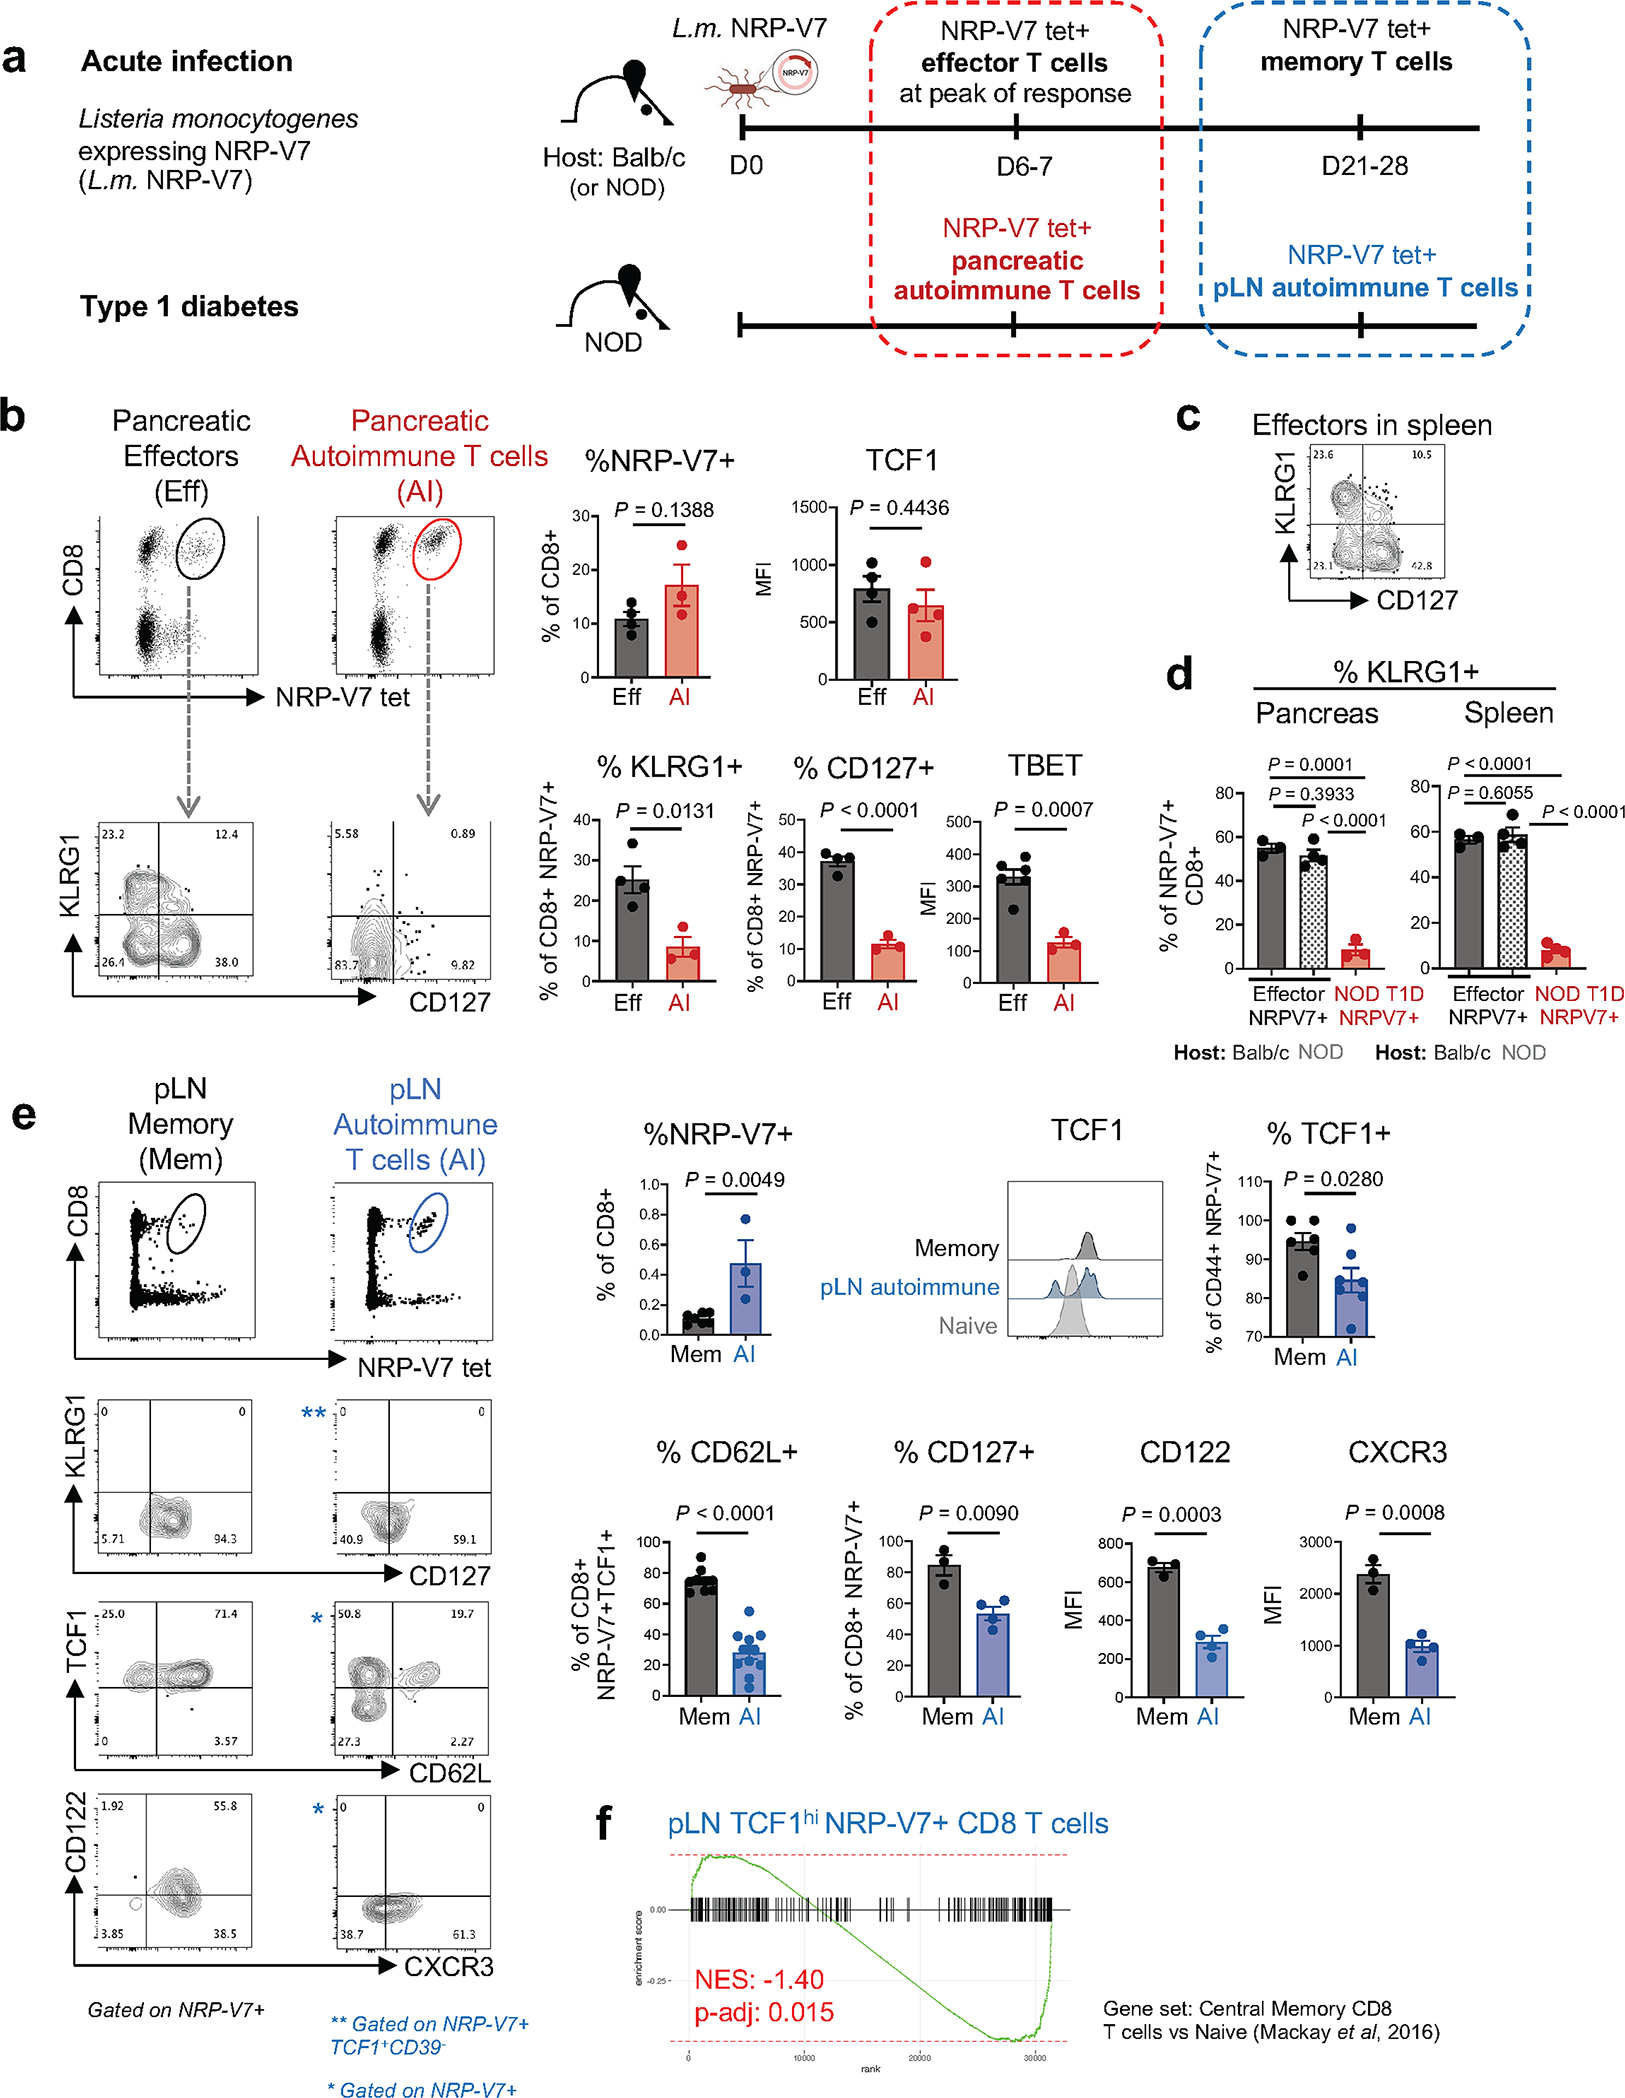
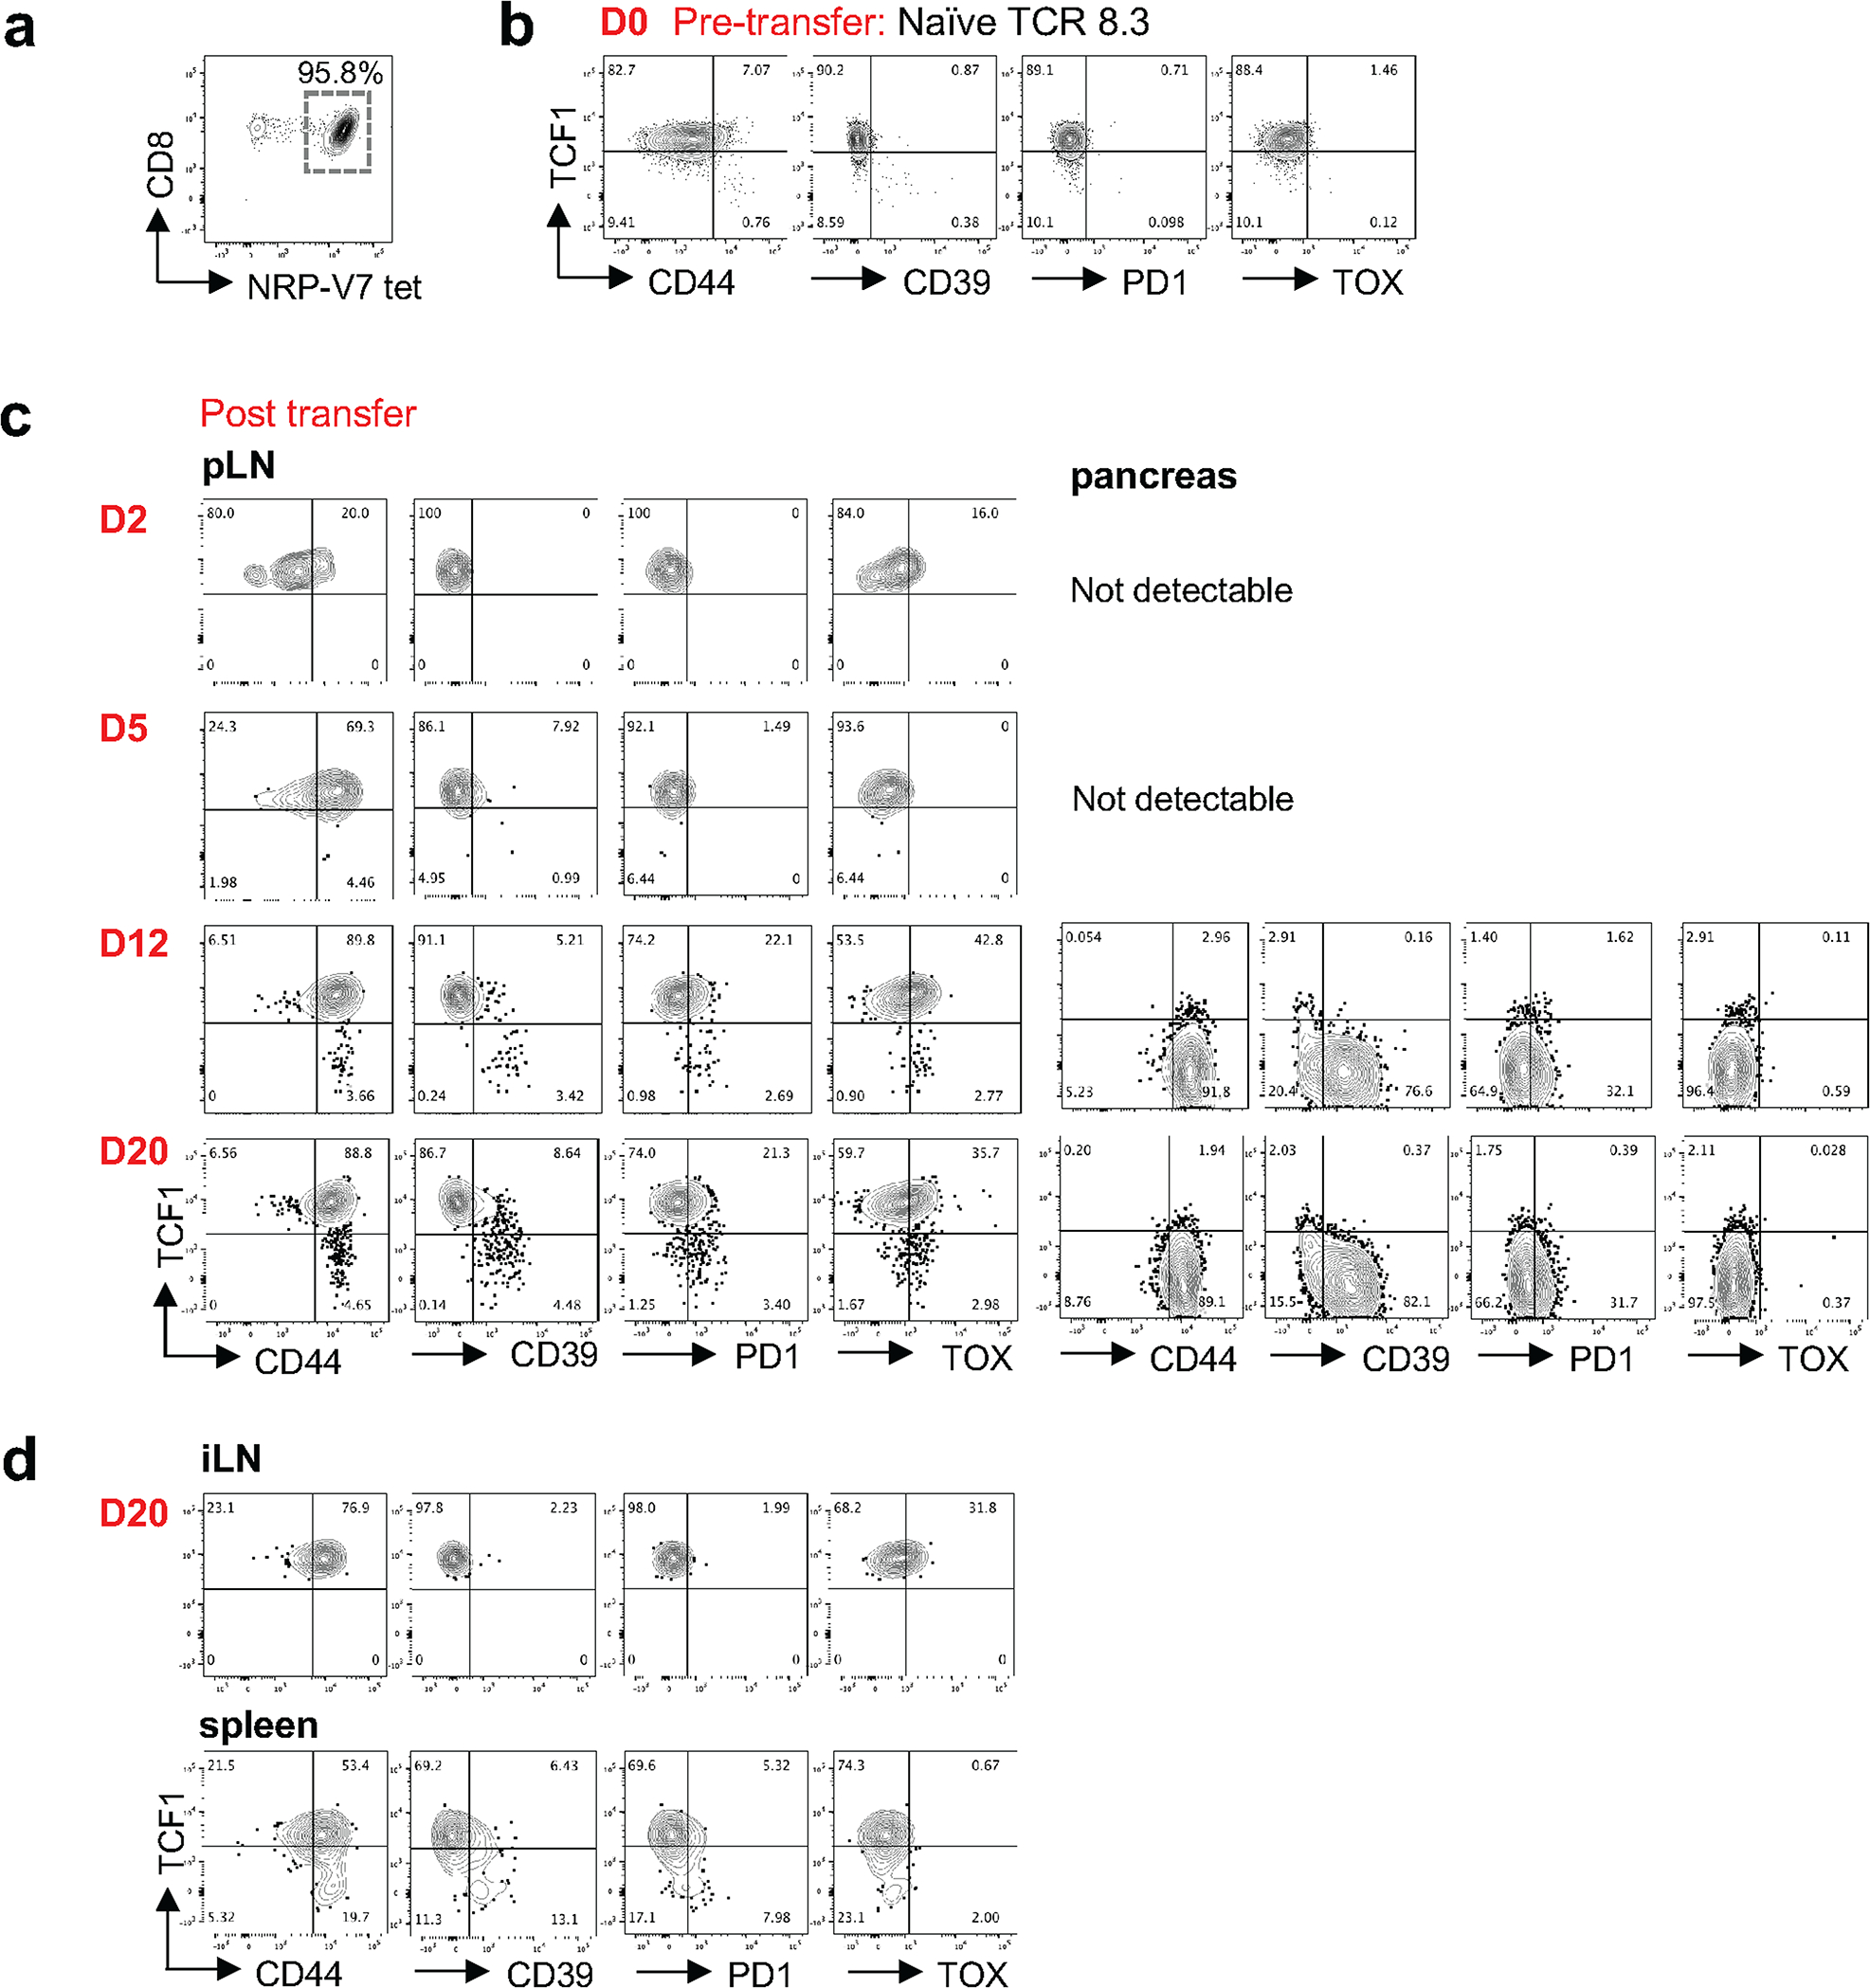
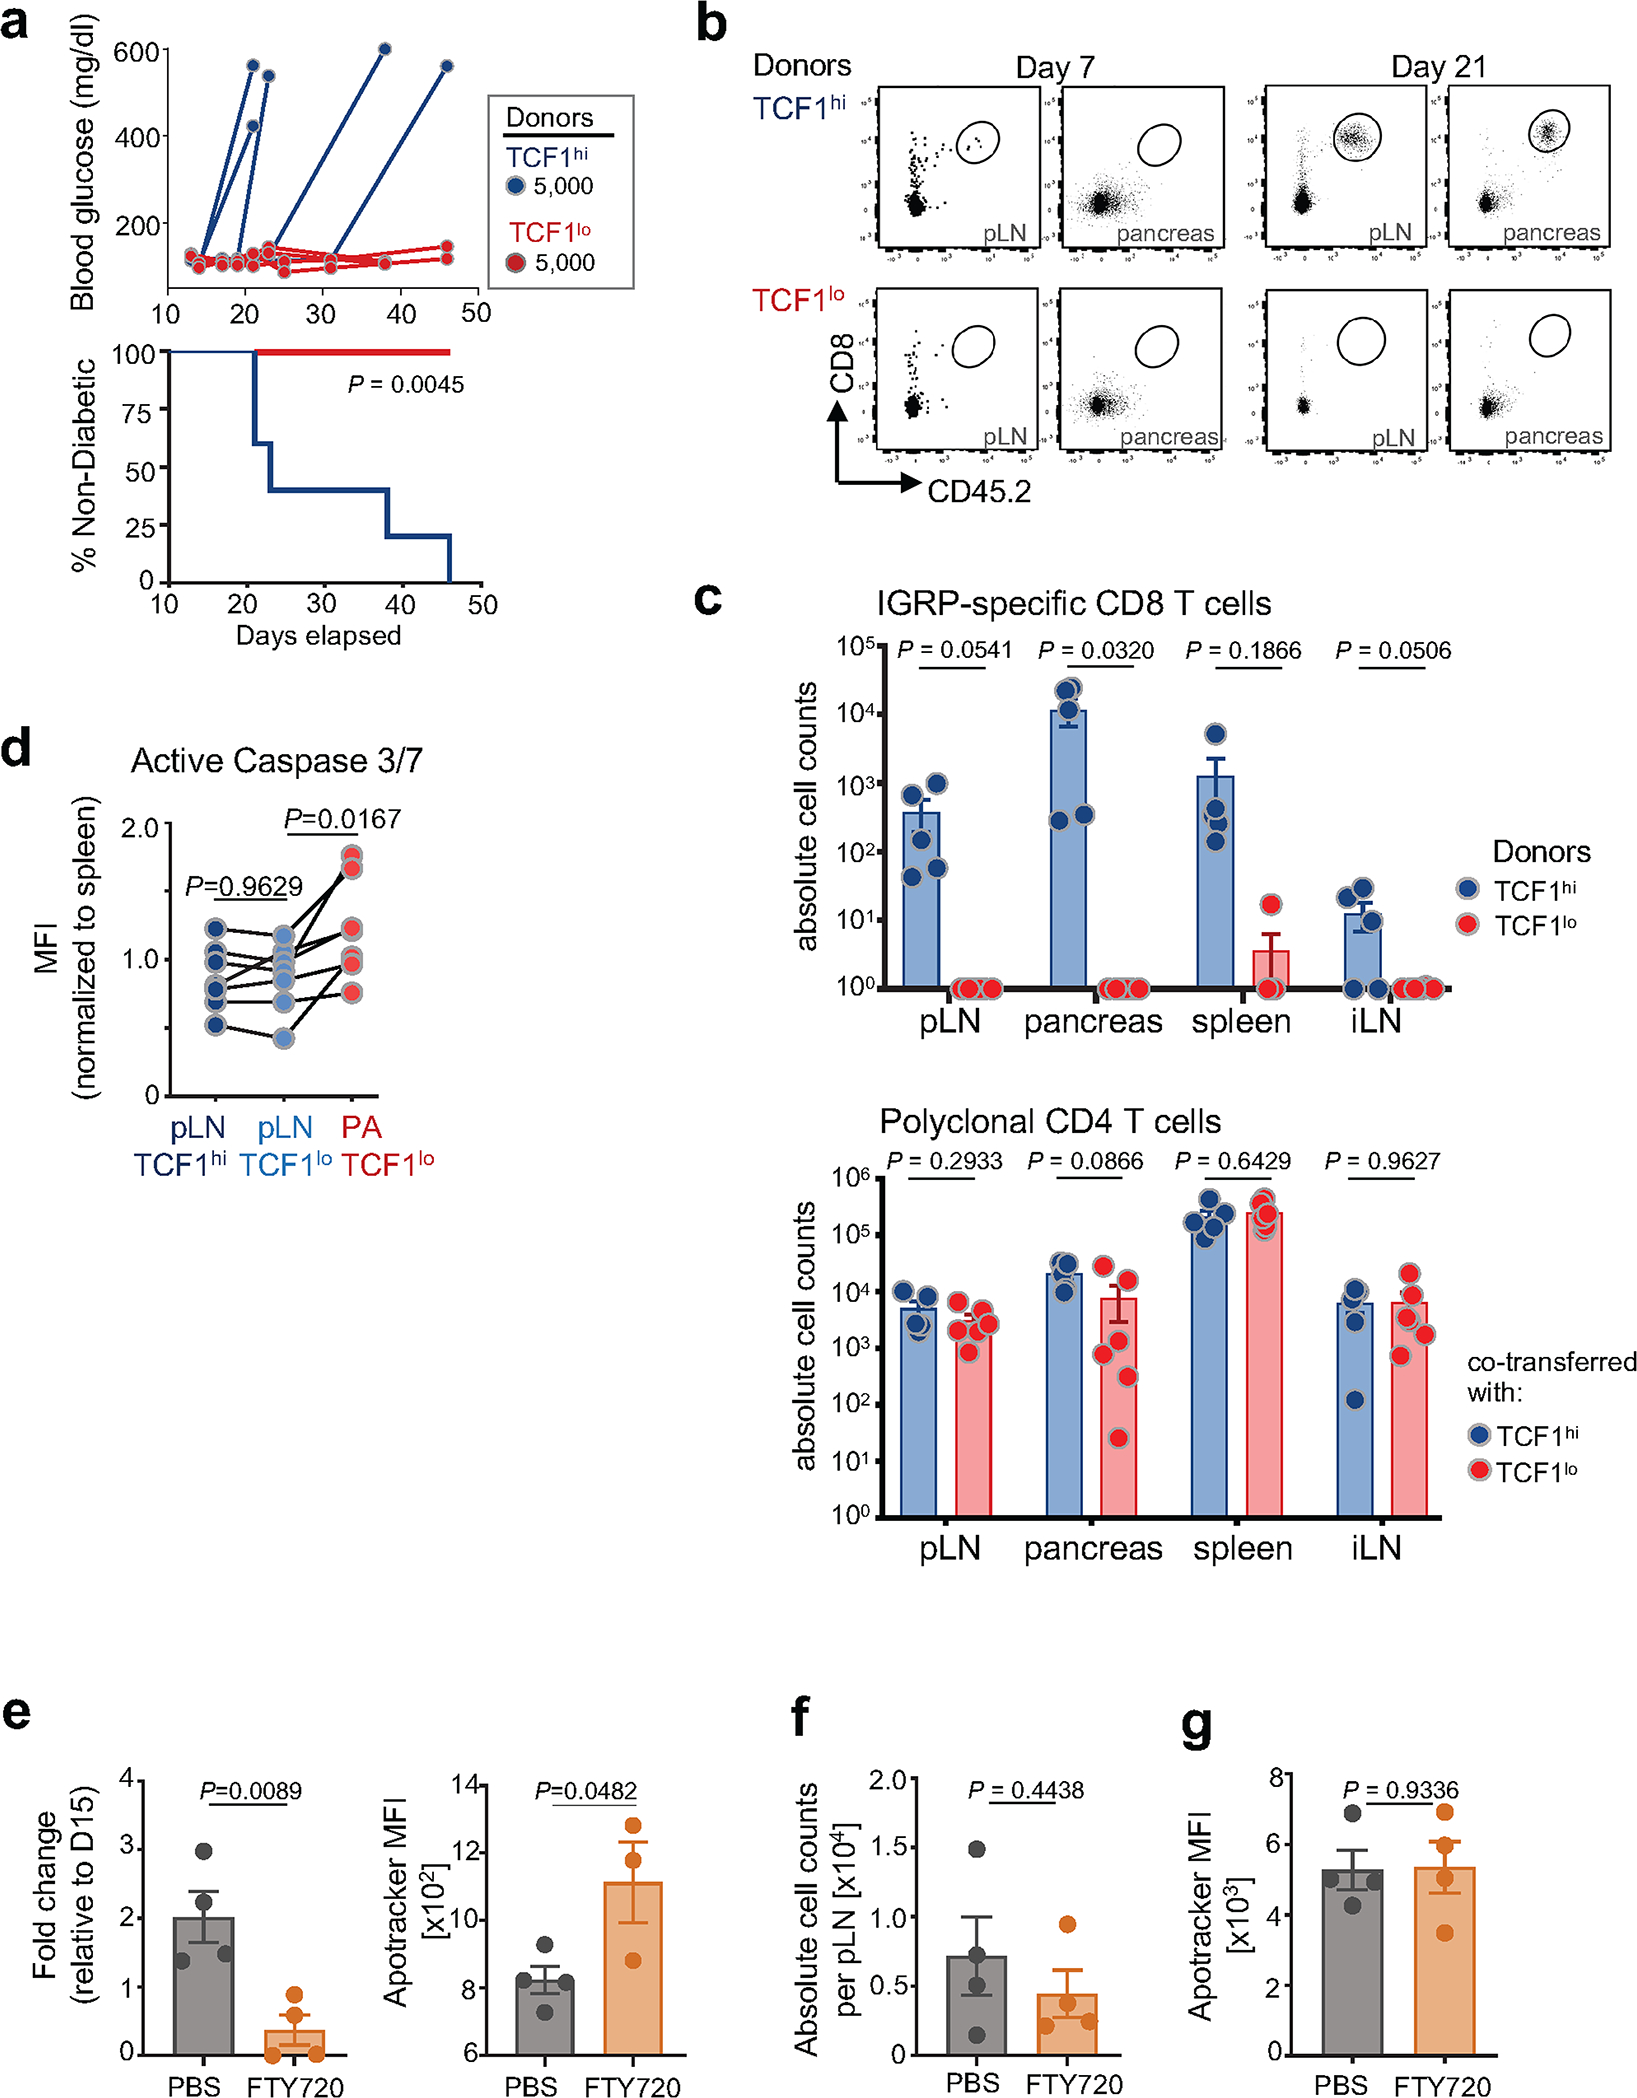
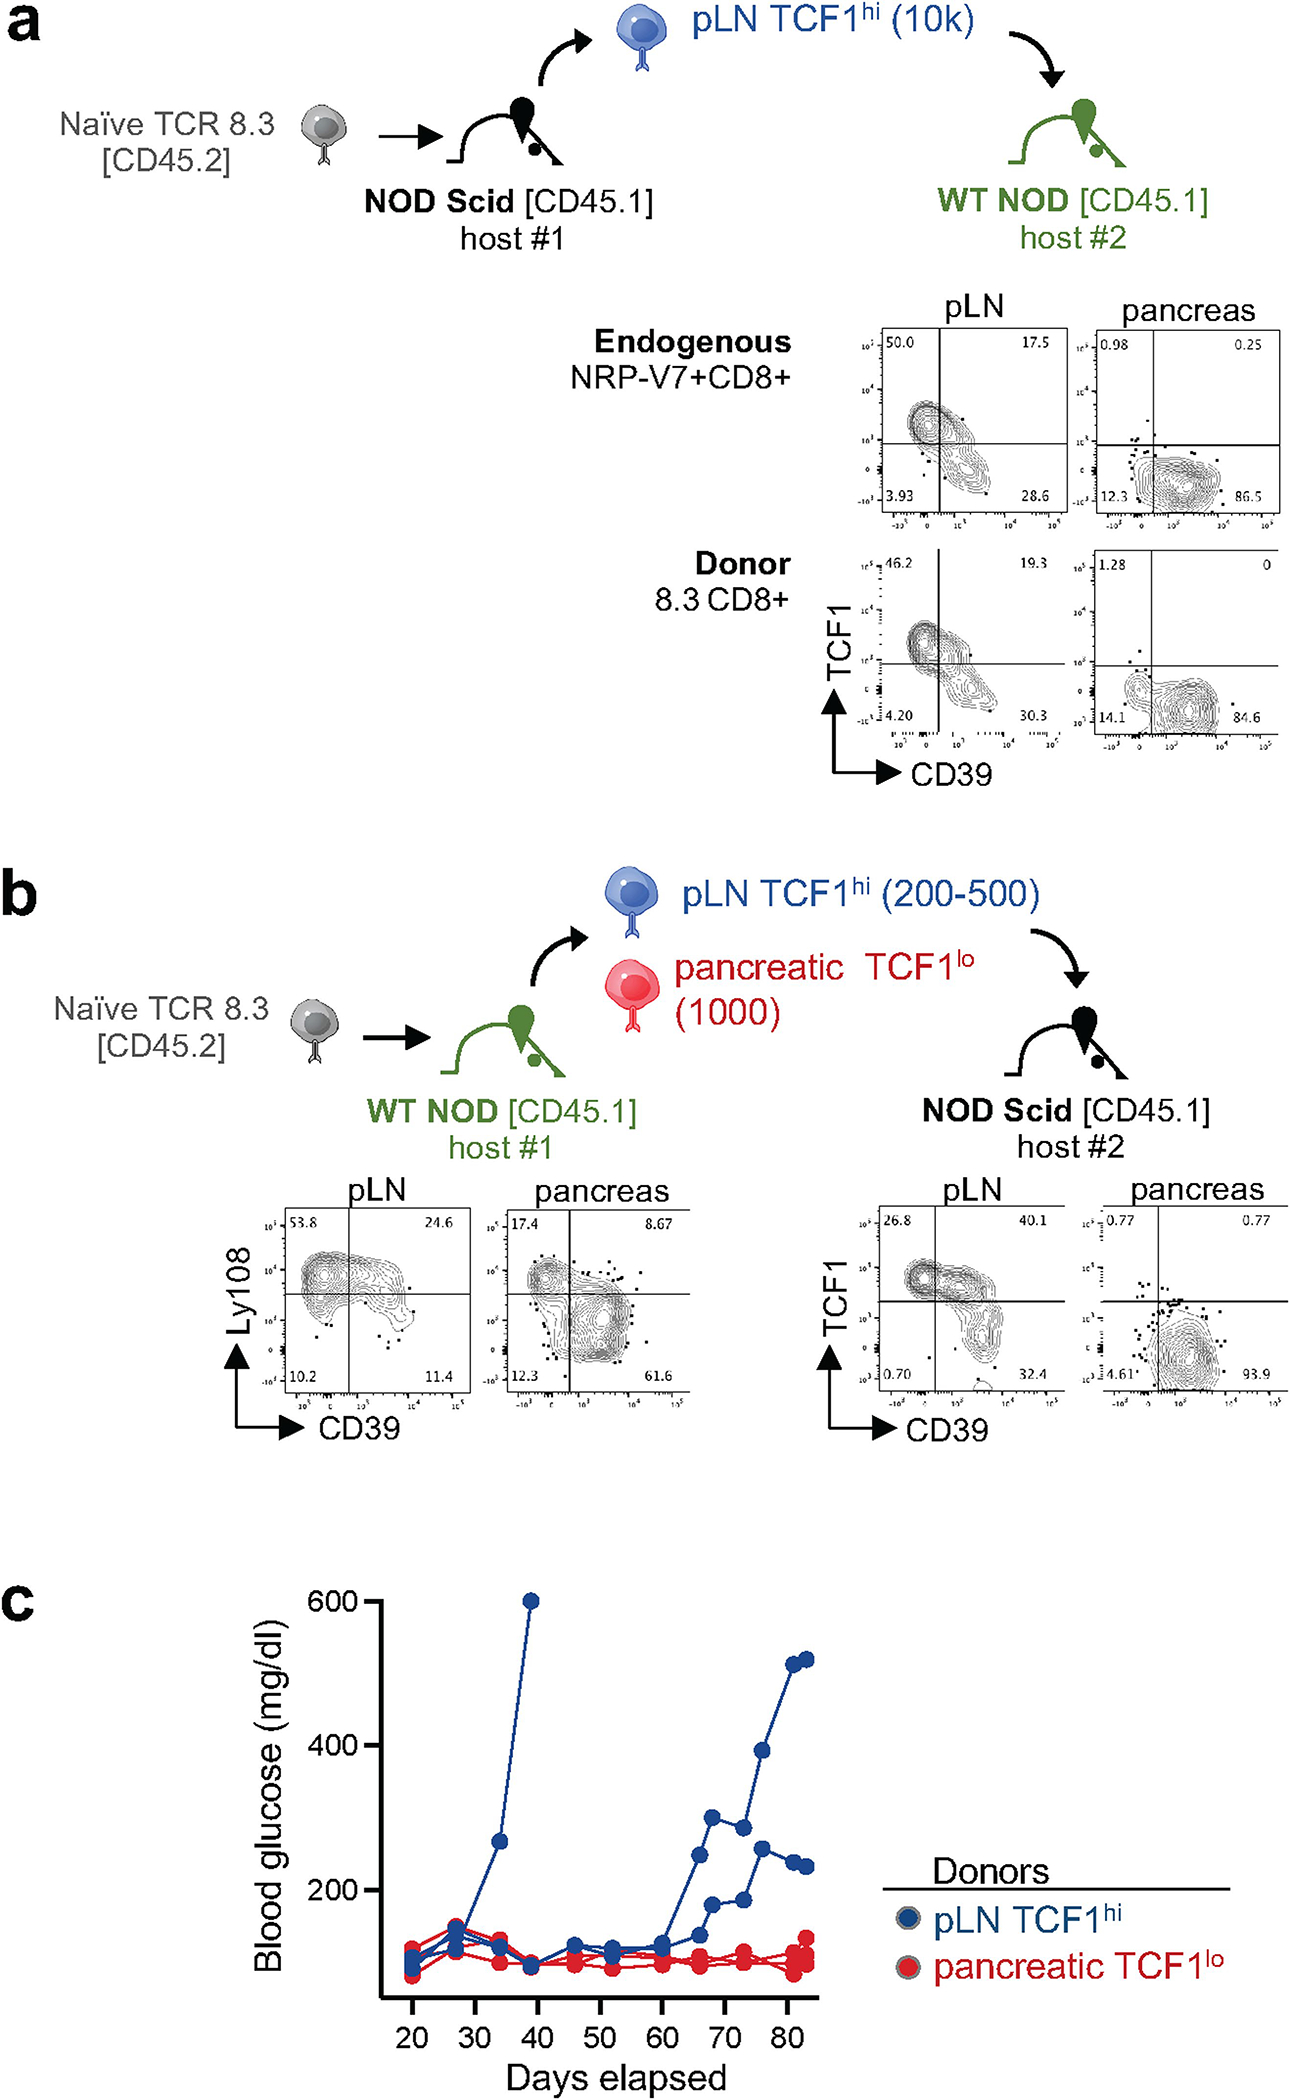
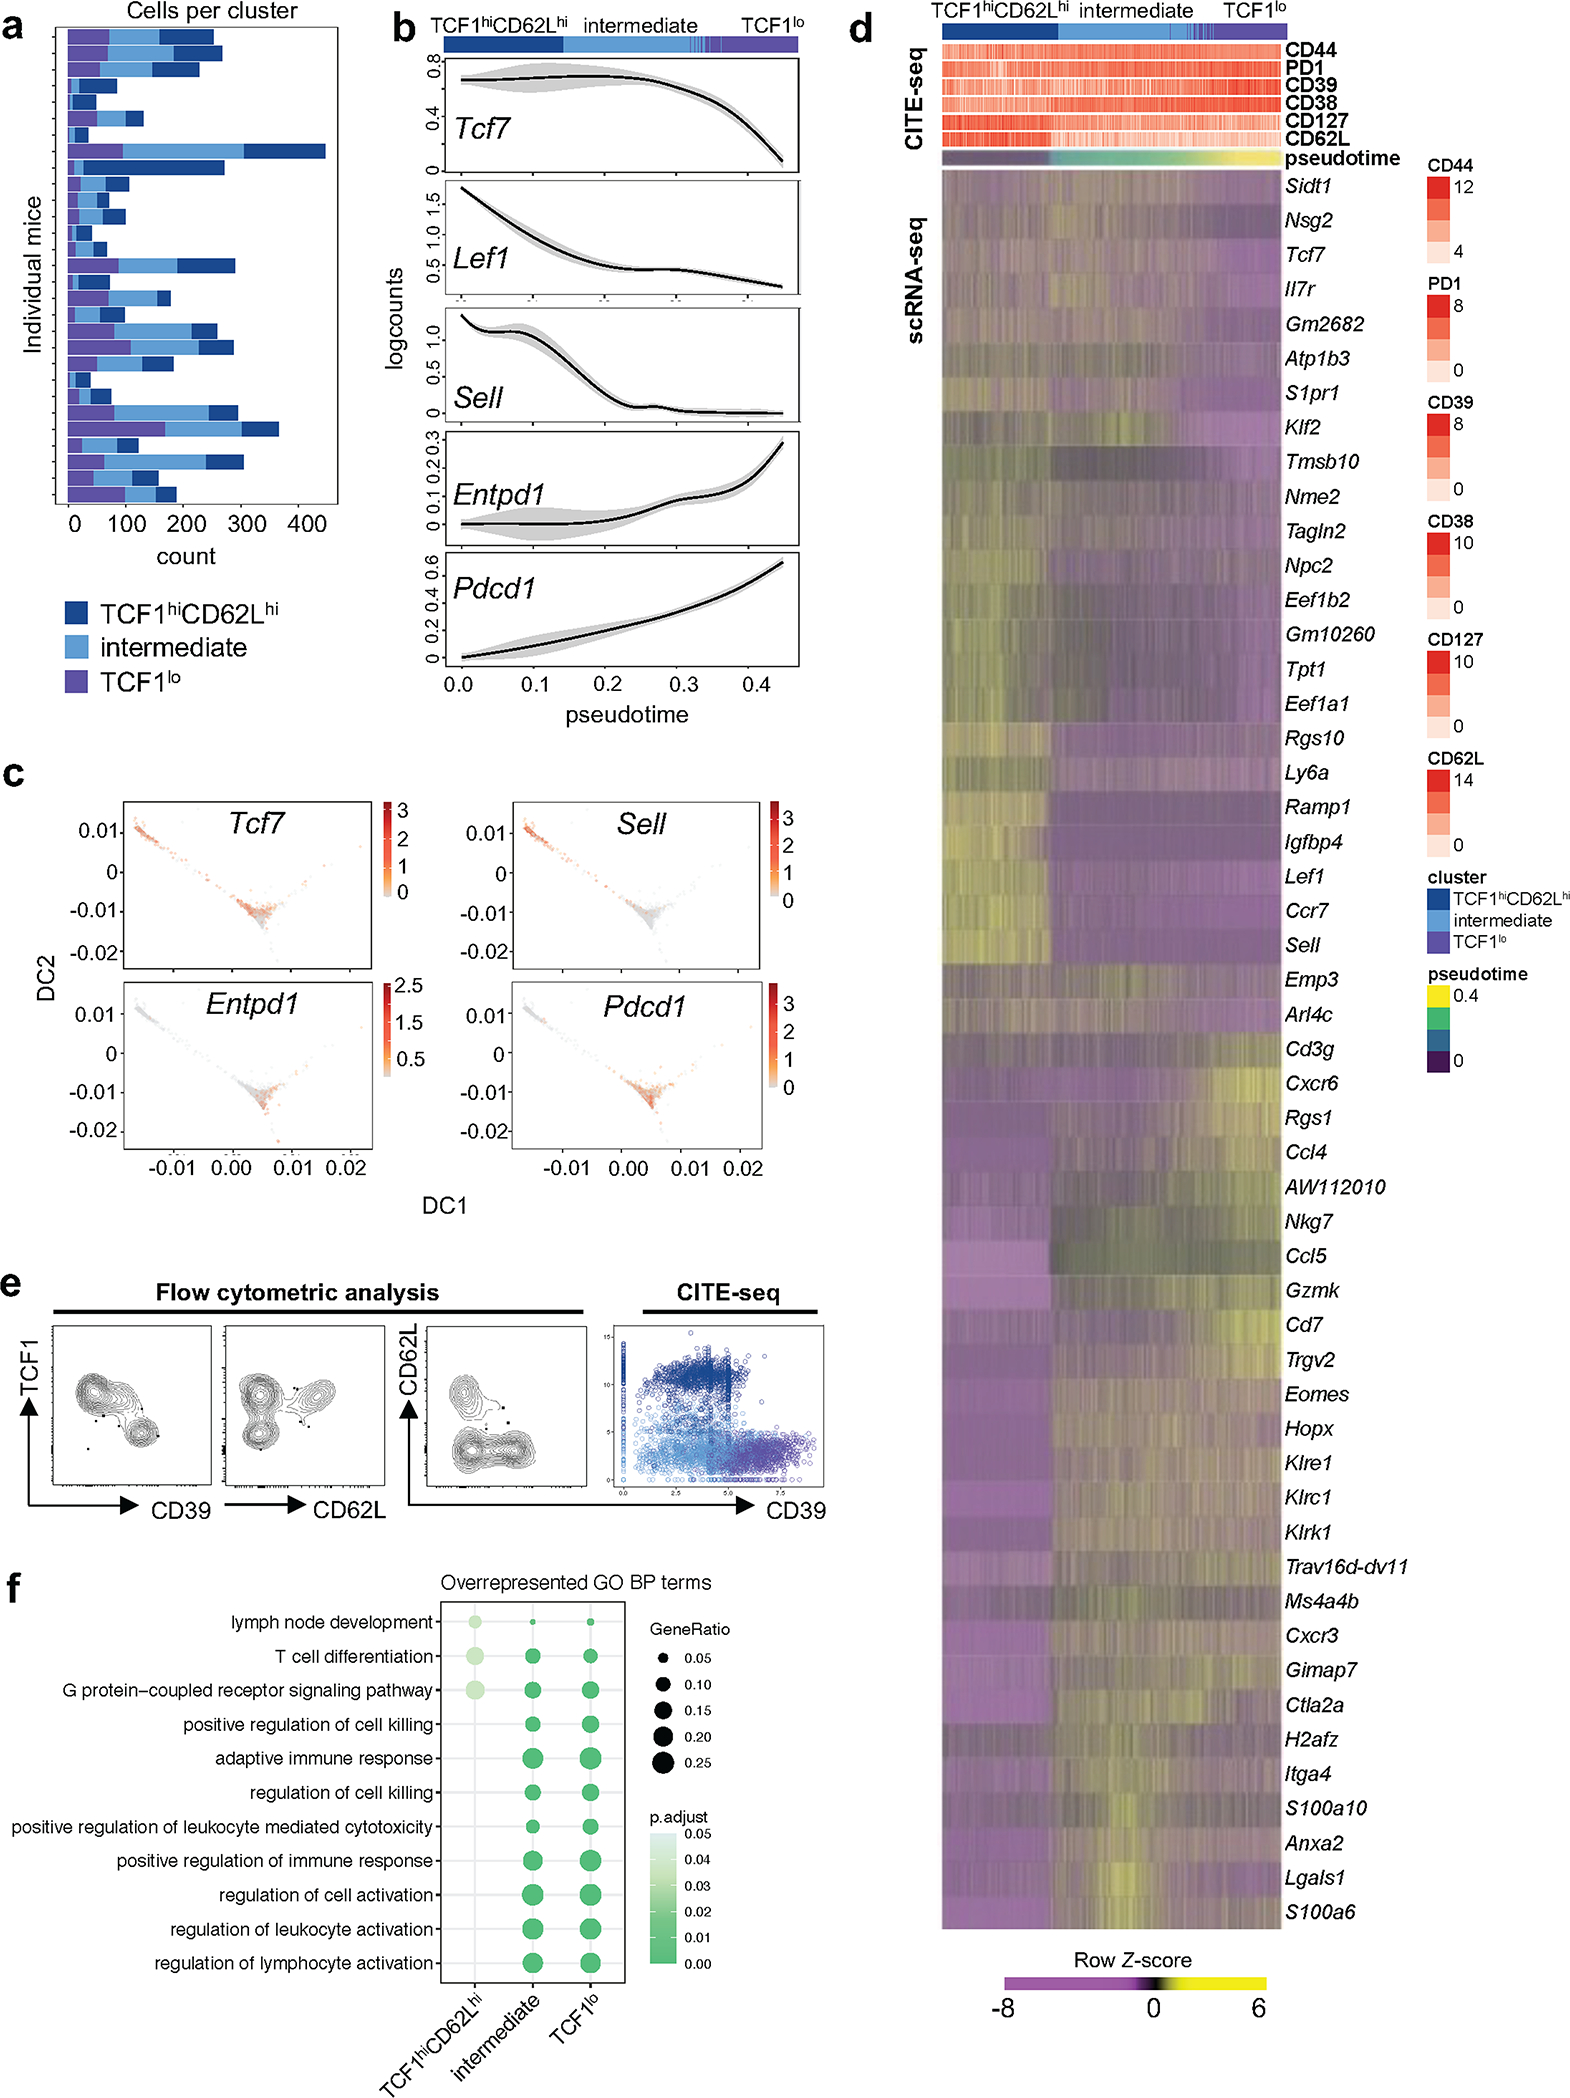
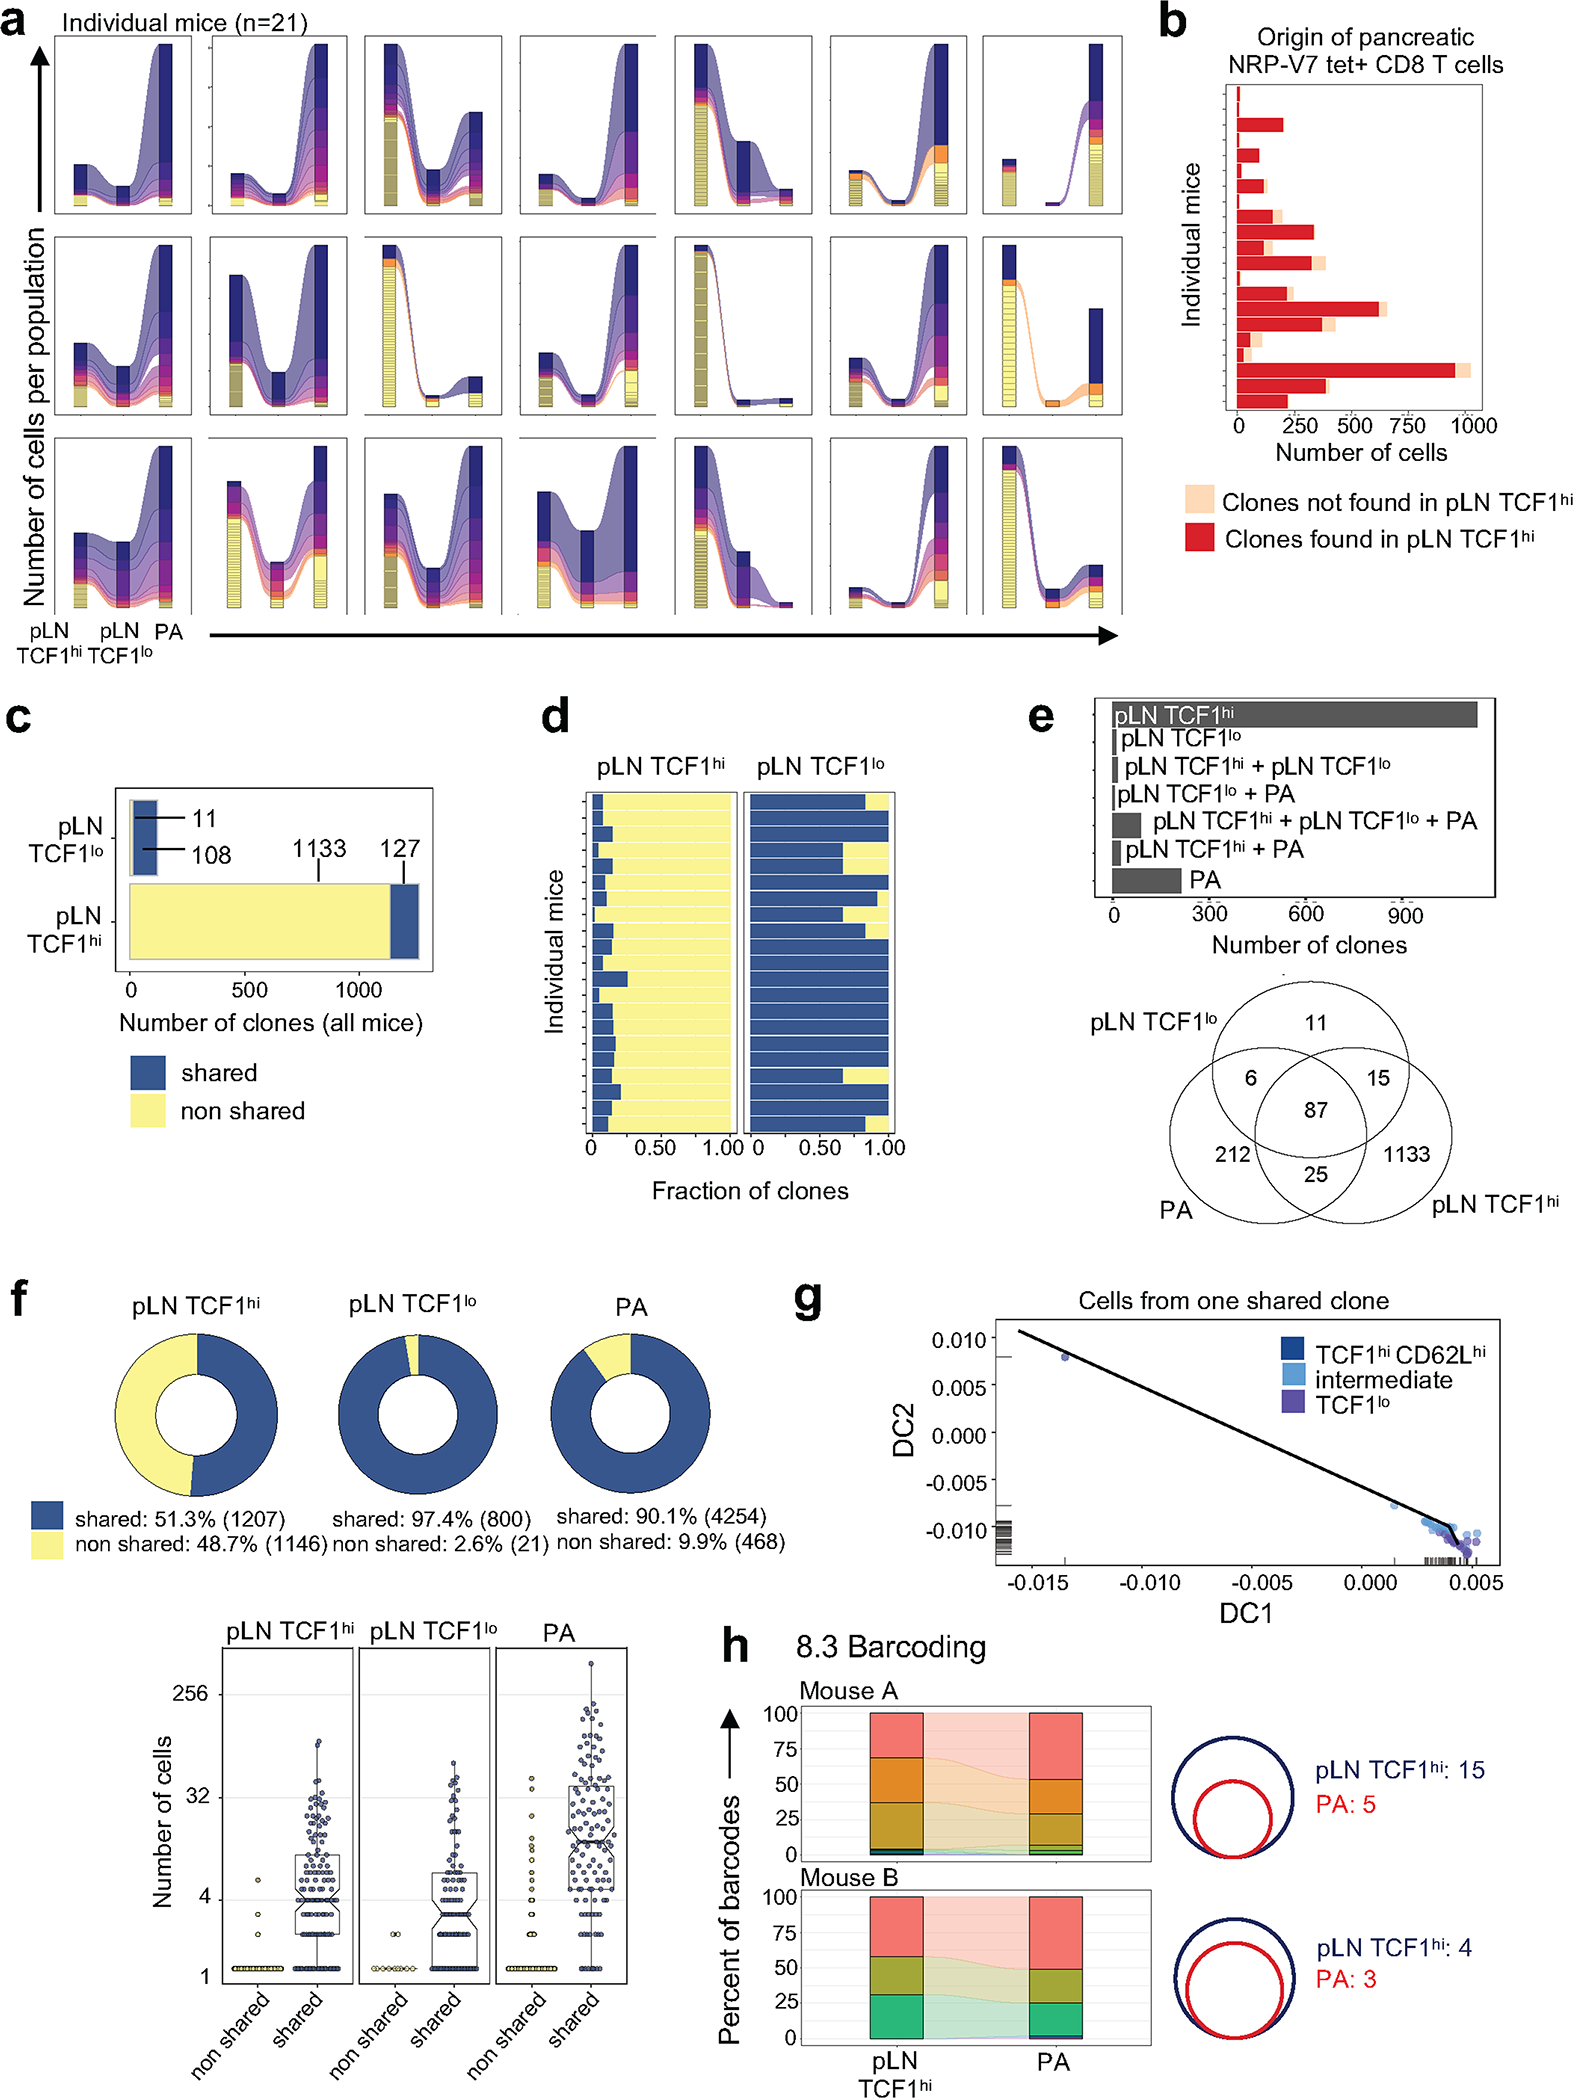
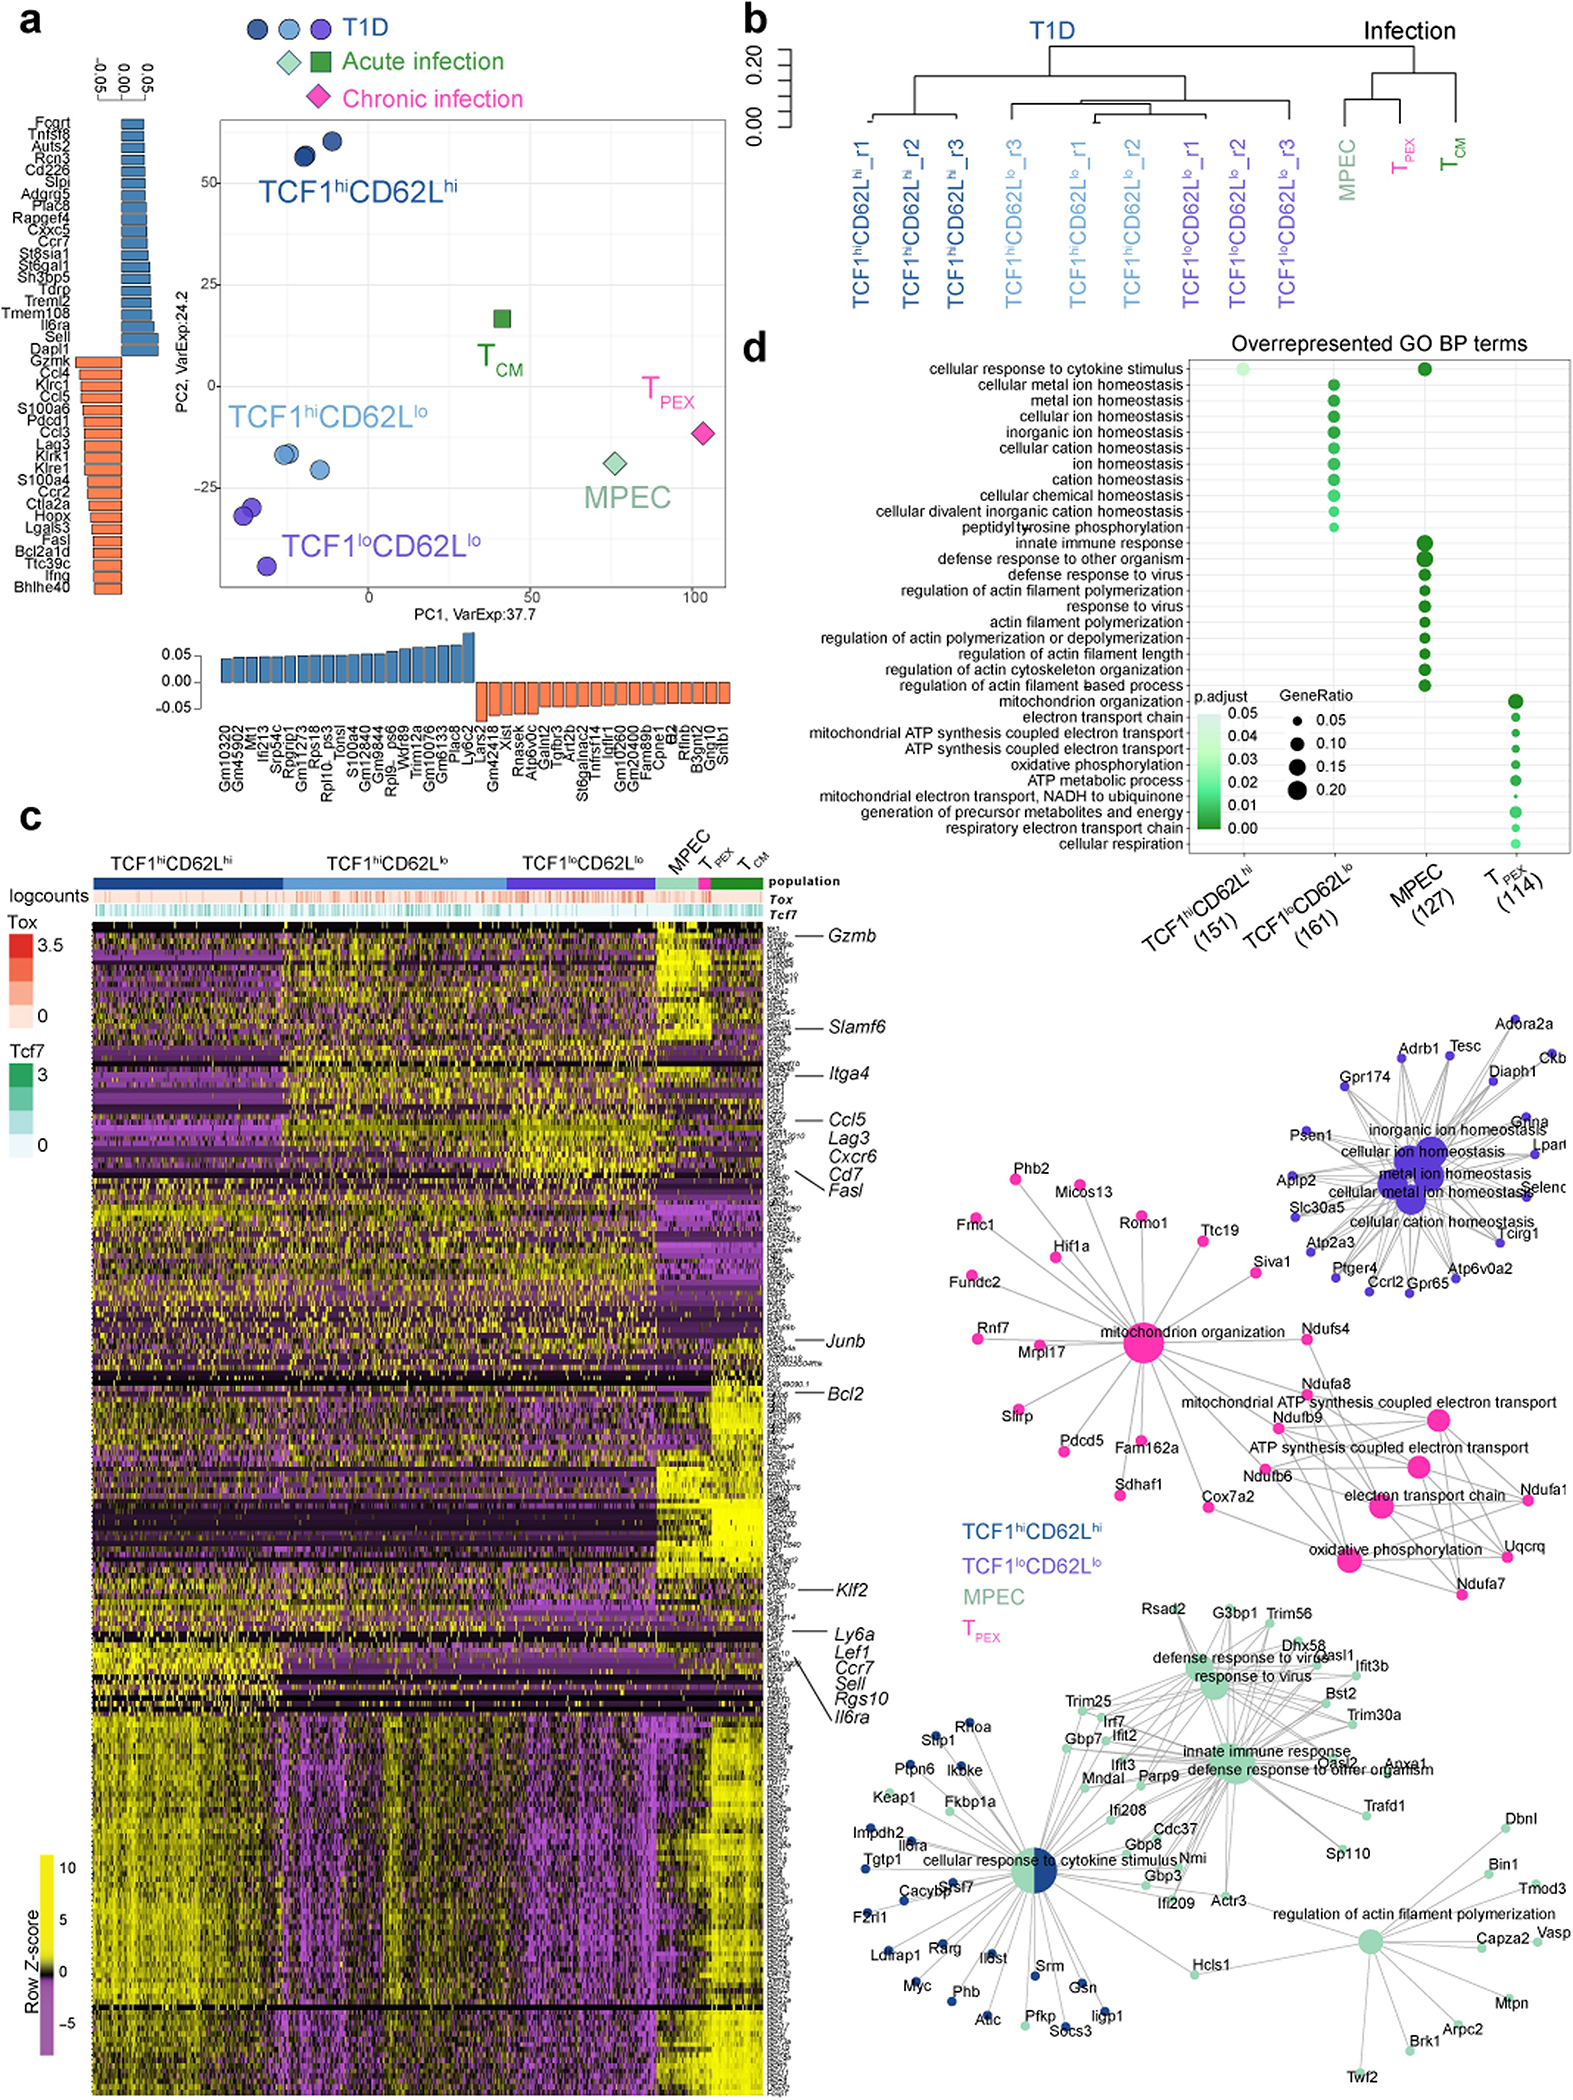
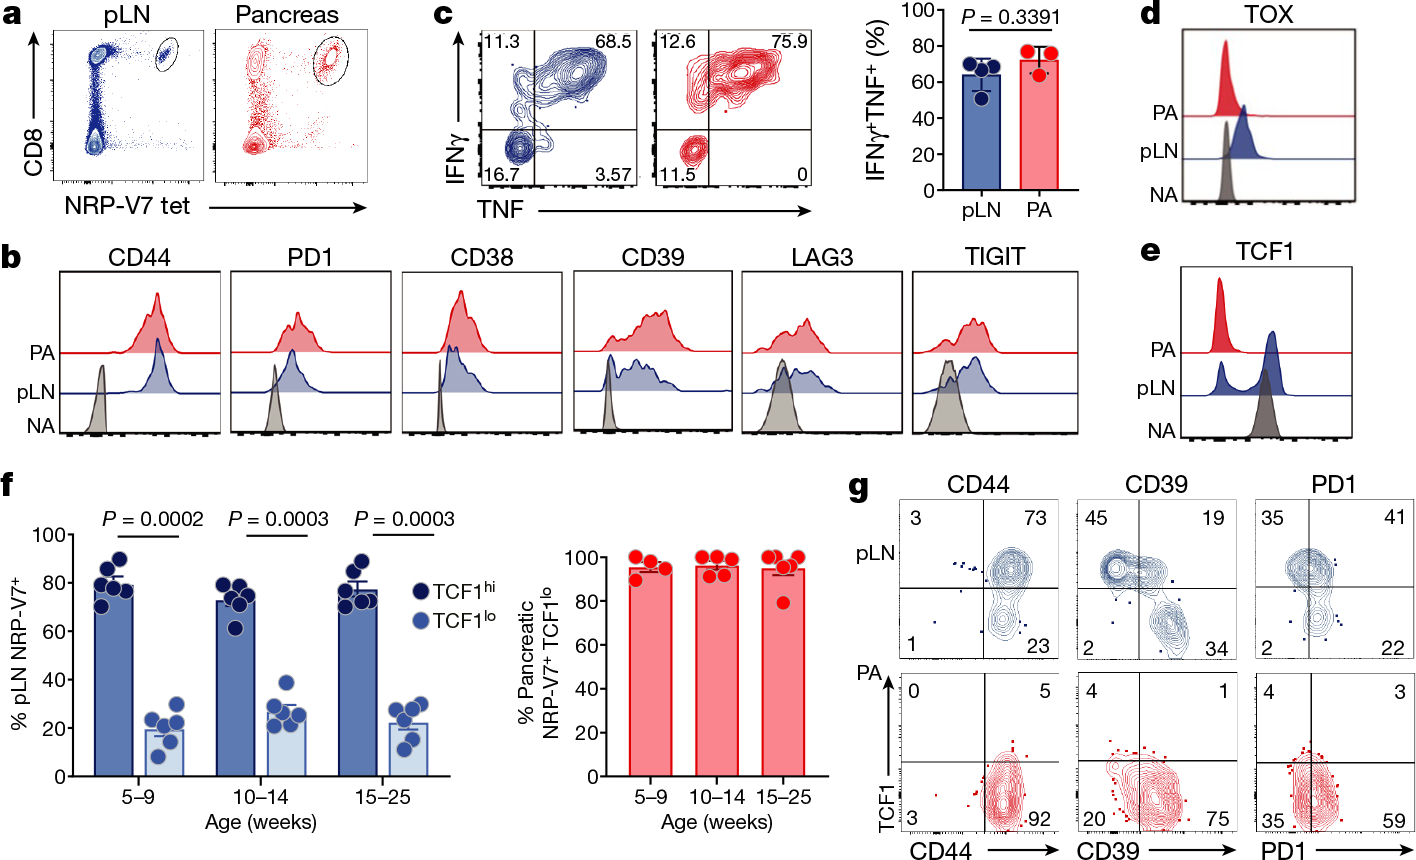
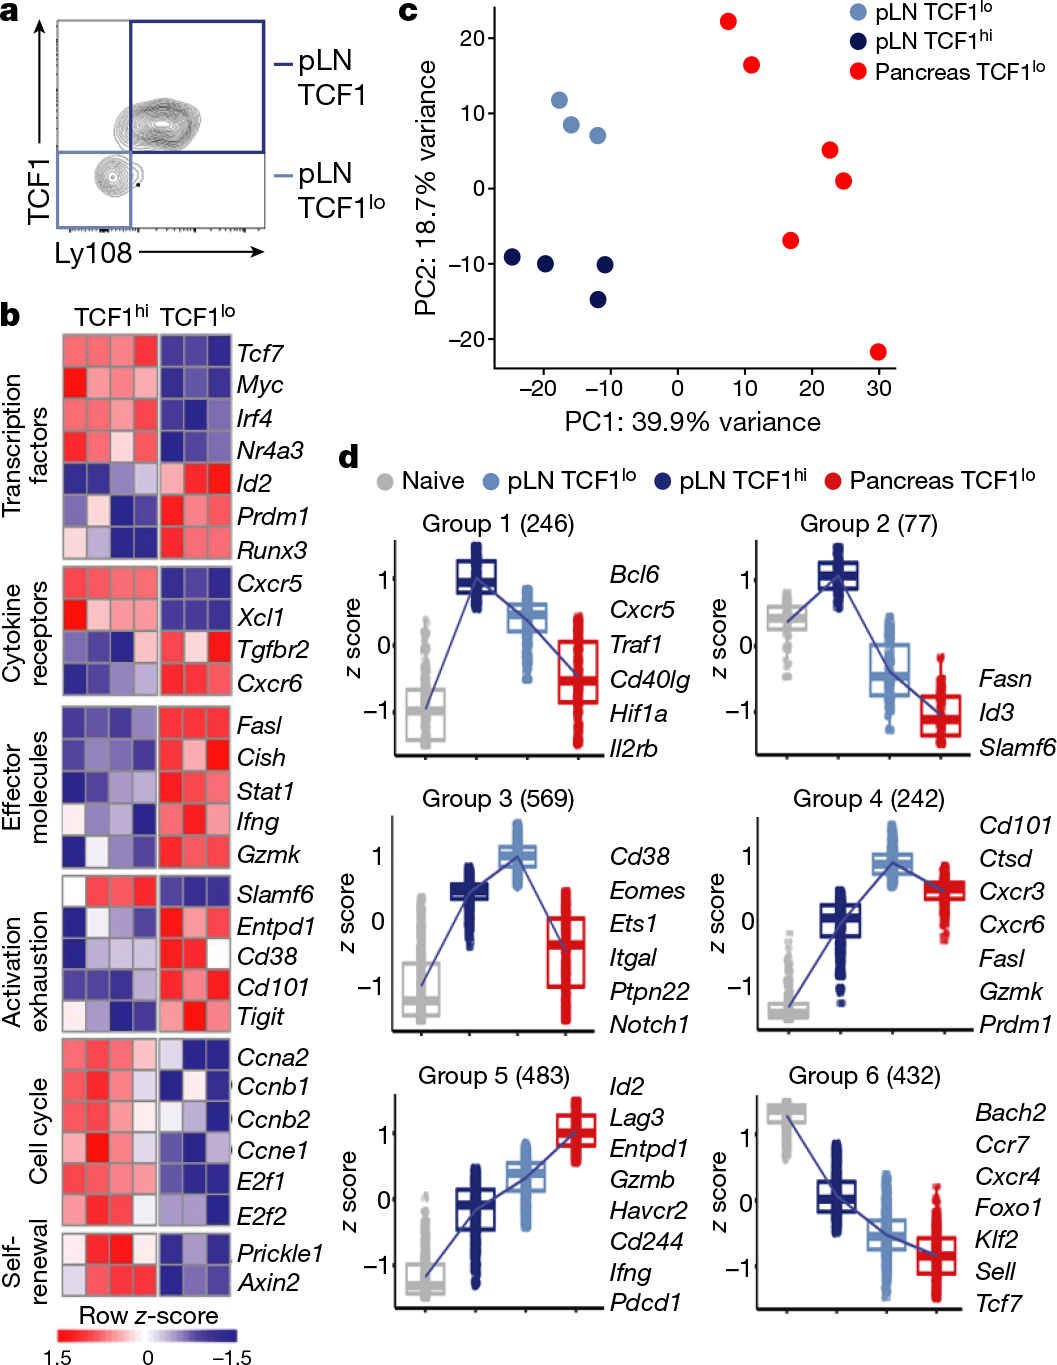
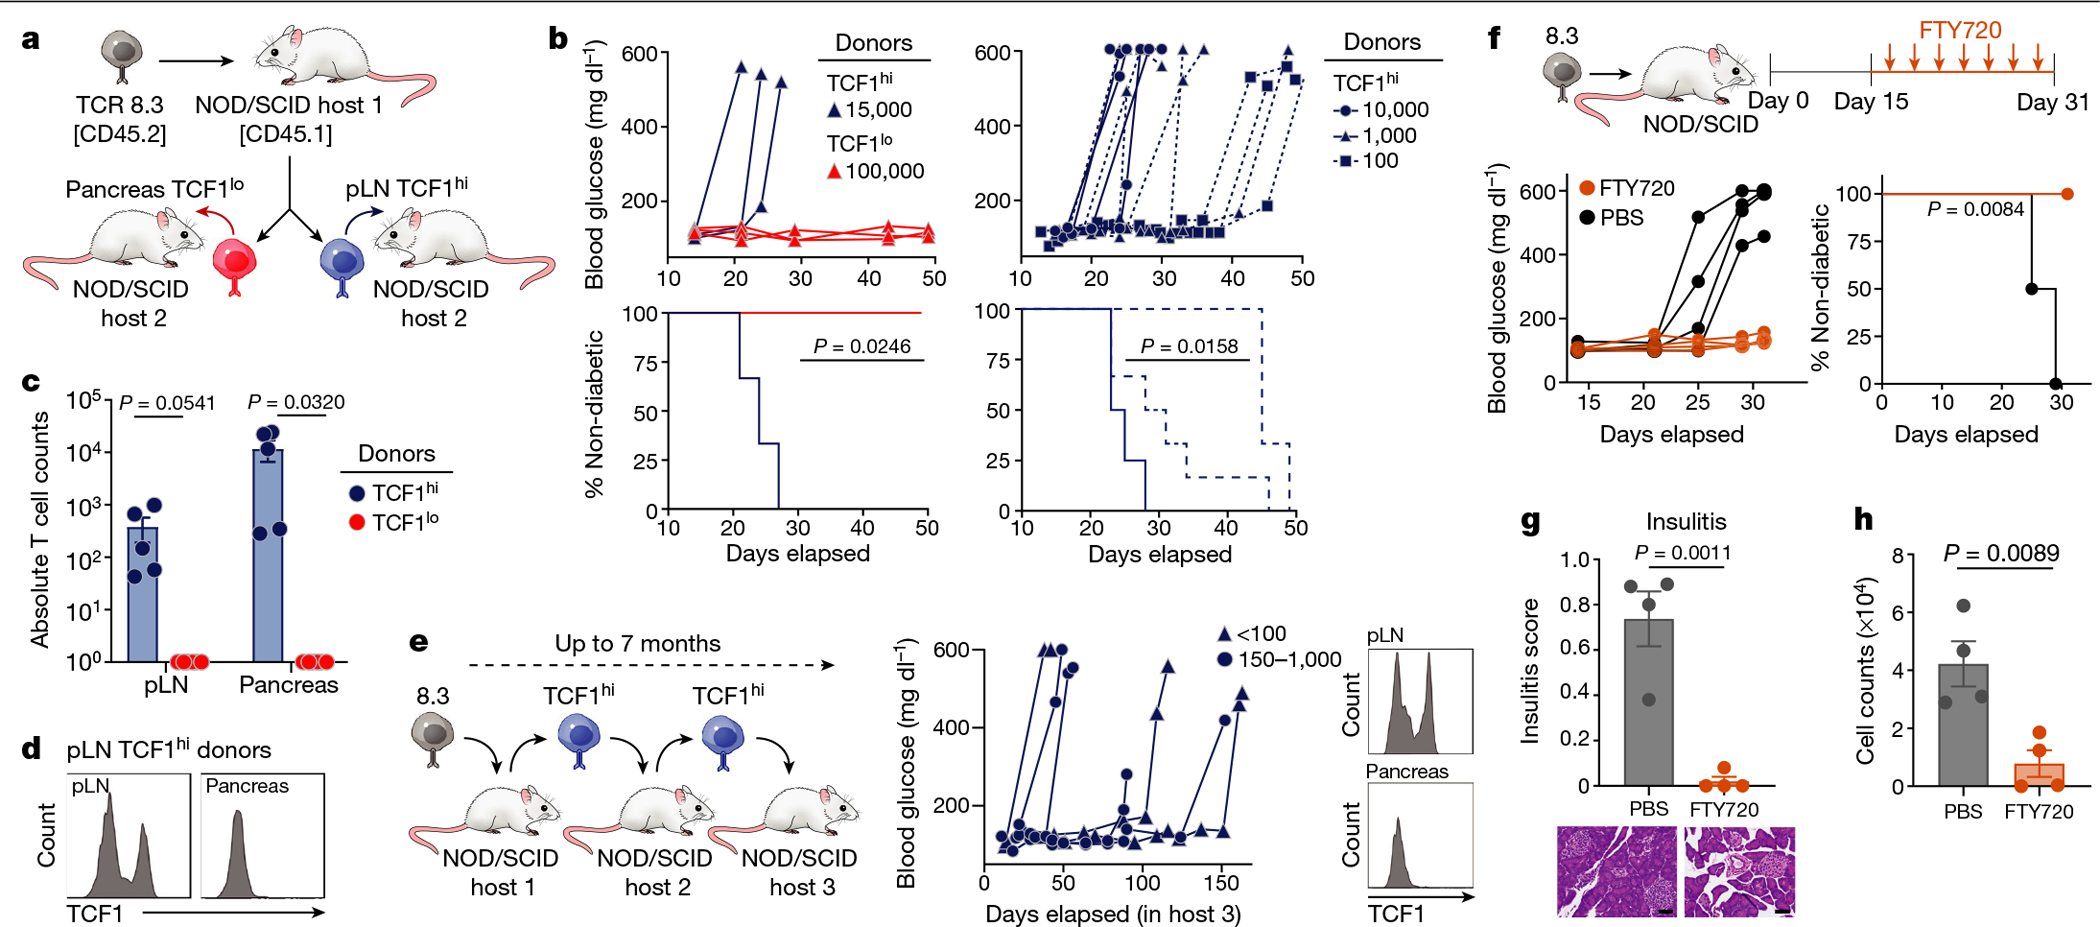
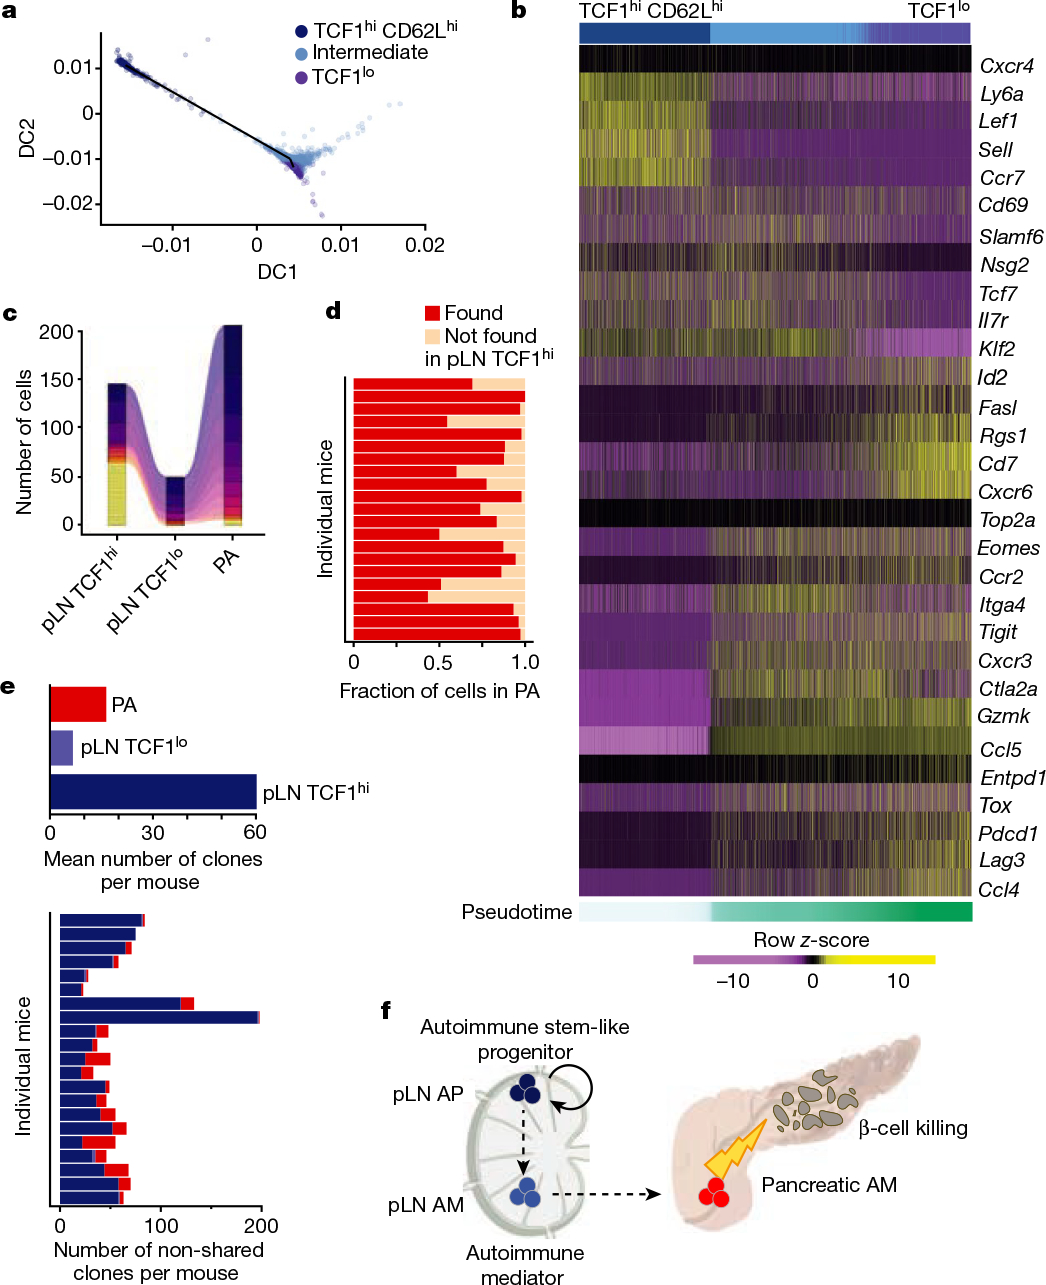
CD8 T cell-mediated autoimmune diseases result from the breakdown of self-tolerance mechanisms in autoreactive CD8 T cells1. How autoimmune T cell populations arise and are sustained, and the molecular programmes defining the autoimmune T cell state, are unknown. In type 1 diabetes, β-cell-specific CD8 T cells destroy insulin-producing β-cells. Here we followed the fate of β-cell-specific CD8 T cells in non-obese diabetic mice throughout the course of type 1 diabetes. We identified a stem-like autoimmune progenitor population in the pancreatic draining lymph node (pLN), which self-renews and gives rise to pLN autoimmune mediators. pLN autoimmune mediators migrate to the pancreas, where they differentiate further and destroy β-cells. Whereas transplantation of as few as 20 autoimmune progenitors induced type 1 diabetes, as many as 100,000 pancreatic autoimmune mediators did not. Pancreatic autoimmune mediators are short-lived, and stem-like autoimmune progenitors must continuously seed the pancreas to sustain β-cell destruction. Single-cell RNA sequencing and clonal analysis revealed that autoimmune CD8 T cells represent unique T cell differentiation states and identified features driving the transition from autoimmune progenitor to autoimmune mediator. Strategies aimed at targeting the stem-like autoimmune progenitor pool could emerge as novel and powerful immunotherapeutic interventions for type 1 diabetes.


Conflict of interest statement

Competing interests The authors declare no competing interests.

Figures

Extended Data Fig. 1 |
Extended Data Fig. 1 |. Phenotypic characterization of IGRP-specific CD8 T cells in NOD mice.
a, Depletion of CD8 T cells prevents T1D. 12-week-old female WT NOD mice were treated with anti-CD8α depleting antibody (clone 53–6.7, 250ug/mouse intraperitoneally (i.p.) twice weekly) for 4 months. Control mice received PBS i.p. n = 4 per group. Statistical testing was conducted via log-rank (Mantel-Cox) test. b, Absolute numbers (top) or frequency (bottom) of IGRP-specific (NRP-V7 tetramer+) CD8+ T cells in pancreatic lymph node (pLN; blue) and pancreas (red) at 5–9, 10–14, 15–20, and 21–30 week-old NOD mice, respectively. For absolute numbers: pLN: n = 6 (5–9wk), n = 4 (10–14wk), n = 4 (15–20wk), n = 3 (21–30wk). pancreas: n = 3 (5–9wk), n = 4 (10–14wk), n = 4 (15–20wk), n = 3 (21–30wk). For frequencies: pLN: n = 10 (5–9wk), n = 8 (10–14wk), n = 17 (15–20wk), n = 16 (21–30wk). Pancreas: n = 5 (5–9wk), n = 7 (10–14wk), n = 15 (15–20wk), n = 15 (21–30wk). Each symbol represents an individual mouse. Data are mean ± SEM. Statistical testing via unpaired two-tailed Student’s t-test. ns, not significant. c, Expression of CD44, PD1, CD38, CD39, LAG3, and TIGIT of IGRP-specific CD8+ T cells from pLN (blue) and pancreas (PA; red). Naïve T cells (NA; NRP-V7-CD44-CD8+ NOD splenocytes from the same mouse) are shown as controls (grey); for CD38: NRP-V7 CD8+ NOD splenocytes. Representative of 2–3 independent experiments, n=4–5. d, Expression of transcription factors EOMES, TBET, BLIMP1 and TOX in IGRP-specific CD8+ (NRP-V7 tet+) T cells isolated from pLN (blue) and pancreas (PA; red); Naïve T cells (NA; NRP-V7 tet− CD44- CD8+ splenocytes) are shown as controls (grey). Data are normalized to NA mean fluorescence intensity (MFI). EOMES and TOX, pooled data from 2 independent experiments, n = 9 (EOMES) and n = 7 (TOX). TBET and BLIMP1, data representative of 2 independent experiments, n=3. Statistical testing via paired two-tailed Student’s t-test. Data are mean ± SEM.
Extended Data Fig. 2 |
Extended Data Fig. 2 |. Phenotypic characterization of IGRP-specific and Insulin B (InsB)-specific CD8+ T cells in various tissues of NOD mice.
a, Expression of TCF1 versus TOX in IGRP-specific CD8+ T cells from pancreatic lymph node (pLN) and pancreas; Naïve (NA) T cells are shown as controls. Inset numbers show percentage of cells per gate. Data is representative of 2–3 independent experiments, n = 3–6. b, Bifurcation of IGRP-specific CD8 T cells into TCF1hi and TCF1lo T cell populations is not found iLN or spleen. Expression profiles of TCF1, CD44, CD39, PD1, and TOX of IGRP-specific CD8 T cells isolated from inguinal LN (iLN; purple) and spleen (green) of NOD mice; naïve T cells are shown as controls (NA). Inset numbers show percentage for each gate. Right panel, percentage of TCF1loCD39+ cells of NRP-V7 tet+ CD44+ CD8+ T cells in iLN and spleen (iLN, n=5; spleen, n = 3). Statistical testing via unpaired two-tailed Student’s t-test. Data are mean ± SEM. Representative of 2 (iLN) and 5 (spleen) independent experiments. c, IGRP-specific and Insulin B (InsB)-specific CD8 T cells bifurcate into phenotypically similar populations in the pancreatic lymph node. Left, NRP-V7+ and InsB+ CD8 T cell populations in pancreas; FACS plot is gated on live CD8+ T cells. Right, expression of TCF1, CD39, PD1, and CD44 in pLN TCF1hi and TCF1lo NRP-V7+ (grey) and InsB+ (blue) CD8 T cells in pancreatic lymph node (top), and NRP-V7+ (grey) and InsB+ (red) CD8 T cells in pancreas (bottom). pLN cells pooled from multiple mice. Representative of 2–3 independent experiments with n = 3–14 (pLN) and n = 6–9 (pancreas). d, Expression levels of CD44, TCF1, CD39, PD1, and CD62L of TCF1hi and TCF1lo IGRP-specific (NRP-V7 tet+) and Insulin B (InsB tet+) CD8 T cells from pLN and pancreas. For pLN, each symbol represents 3 pooled mice; for pancreas, each symbol represents one individual mouse. Data are mean ± SEM. Statistical testing conducted via unpaired two-tailed Student’s t-test. e, TCF1 and PD1 expression profiles of NRP-V7+ and polyclonal CD44+CD39+CD8+ T cells from pLN and pancreas. pLN cells pooled from multiple mice.
Extended Data Fig. 3 |
Extended Data Fig. 3 |. Transcriptome analysis of IGRP-specific CD8 T cells from pancreatic lymph node and pancreas.
a, MA plot of RNA-seq of pLN TCF1hi and pLN TCF1lo IGRP-specific CD8 T cells. Significantly differentially expressed genes are colored in light or dark blue and labeled with *. Selected genes are highlighted. b, Gene ontology (GO) term analysis of differentially expressed genes in pLN RNA-seq data set. GeneRatio>20/X. P-adj<0.01. Statistical testing conducted via hypergeometric test with Benjamini-Hochberg correction. c, GSEA of pLN TCF1hi and pLN TCF1lo cells including Hallmark and KEGG gene sets. d, Over-representation of KEGG and Hallmark pathways and GO terms in groups 1 and 4. P-adj<0.05.
Extended Data Fig. 4 |
Extended Data Fig. 4 |. IGRP-specific autoimmune CD8 T cell populations are phenotypically and transcriptionally distinct from IGRP-specific effector and memory CD8 T cells generated during acute infections.
a, Experimental scheme showing generation of NRP-V7 tet+ effector and memory CD8 T cells during an acute Listeria infection in comparison to NRP-V7 tet+ autoimmune CD8 T cells in NOD mice. A Listeria monocytogenes strain was generated expressing the NRP-V7 mimotope (L.m. NRP-V7); host mice (Balb/c or NOD) were infected with L.m. NRP-V7 and effector and memory T cells from indicated tissues were analyzed at indicated time points using NRP-V7 tetramer. Effector and memory T cells were compared with NRP-V7+ autoimmune T cell populations from NOD mice and tissues as indicated. b, Top, identification of NRP-V7+ CD8 T cells in pancreas (effectors (Eff); black) at day 6–7 post infection of Balb/c mice or autoimmune NRP-V7+ CD8 T cells in pancreas of uninfected NOD mice (AI; red). Right, frequency of NRP-V7+ of CD8 T cells. Expression levels of KLRG1, CD127, TBET, and TCF1 in Eff and AI NRP-V7+ CD8 T cells from pancreas of Balb/c and NOD, respectively, are shown and quantified. Eff, n=4 (%NRP-V7+, %KLRG1+, %CD127+, TCF1 MFI) or n = 6 (TBET MFI); AI, n=3 (%NRP-V7+, %KLRG1+, %CD127+, TBET MFI) or n = 4 (TCF1 MFI). c, Expression of KLRG1 and CD127 of NRP-V7+ effectors from spleens of L.m.-infected Balb/c mice. b, c, Representative of 3 independent experiments. d, Frequency of KLRG1+ of NRP-V7+ CD8 T cells from pancreas (left) and spleen (right) of L.m.-infected Balb/c and NOD mice at day 6 post L.m. NRP-V7 infection compared to autoimmune (AI) NRP-V7+ CD8 T cells from NOD mice. Eff, n=3; NOD Eff, n = 4; NOD, n = 3 (pancreas), n=4 (spleen). Representative of 1 experiment. e, Top, identification of NRP-V7+ CD8 T cells in pancreatic lymph node (pLN) (memory (Mem); black) at day 21–28 post infection and autoimmune (AI) NRP-V7+ CD8 T cells in pLN of uninfected NOD mice (blue). Frequency of NRP-V7+ of CD8 T cells quantified on right. Expression profiles and frequencies of KLRG1, CD127, TCF1, CD62L, CD122, and CXCR3 of Mem and AI NRP-V7+ CD8 T cells from pLN of Balb/c and NOD, respectively. Mem, n = 7 (%NRP-V7+), n=6 (%TCF1+CD44+), n = 9 (%CD62L+), n = 3 (%CD127+, CD122 MFI, CXCR3 MFI); AI, n = 3 (NRP-V7+), n=7 (%TCF1+CD44+), n = 11 (%CD62L+), n=4 (%CD127+, CD122 MFI, CXCR3 MFI), n = 3 (%NRP-V7+). Representative of 3 independent experiments; %CD62L+ shows 3 combined experiments. Statistical testing conducted by Student’s two-tailed unpaired t-test. Data are mean ± SEM. f, Gene set enrichment analysis of RNA-seq data from IGRP-specific pLN TCF1hi CD8 T cells (see Fig. 2) compared to central memory CD8 T cells generated during acute LCMV infection; dataset from Mackay et al, 2016, GSE70813. NES, normalized enrichment score.
Extended Data Fig. 5 |
Extended Data Fig. 5 |. Longitudinal analysis of IGRP-specific 8.3 CD8 T cells post transfer into NOD Scid mice.
a, NRP-V7+ tetramer staining of CD8+ splenocytes from 8.3 TCR transgenic mouse. Representative of at least 3 independent experiments, n = 2. b, Expression of TCF1, CD44, CD39, PD1, and TOX of naïve 8.3 CD8 T cells pre-transfer (Day 0). c, Expression of indicated molecules in pLN and pancreas of NOD Scid hosts at day 2, 5, 12, and 20 post transfer (note: transferred donor T cells were not detected in pancreas before day 12). b, c, Representative of 2 (day 2, day 5, and 12) or 3 (day 20) independent experiments with n=2 (day 2, day 5, and 12) or n = 6 (day 20) replicates. d, Expression of indicated molecules in inguinal lymph nodes (iLN) and spleens of NOD Scid hosts at day 20 post transfer. Representative of 2 independent experiments with n=2 replicates.
Extended Data Fig. 6 |
Extended Data Fig. 6 |. Analysis of transferred TCF1hi or TCF1lo CD8 T cells in 2nd NOD Scid hosts.
a–c, 5,000 pLN TCF1hi or 5,000 pancreatic TCF1lo 8.3 CD45.2+ CD8 T cells (isolated from 1st NOD Scid hosts) were transferred to 2nd NOD Scid hosts. a, Top, blood glucose curve of 2nd NOD Scid hosts receiving 5,000 pLN TCF1hi (blue, n = 5) or pancreatic TCF1lo (red, n = 4) 8.3 CD8 T cells. Each line represents an individual mouse. Bottom, percentage of non-diabetic mice over time in indicated cohorts. Statistical testing conducted via two-sided log-rank (Mantel-Cox) test. Representative of at least three independent experiments with n = 3–6 mice per group; mice were monitored for 50 days post transfer. b, FACS plots show donor TCF1hi or TCF1lo 8.3 found in pLN and pancreas 7 days (TCF1hi, n = 2; TCF1lo, n = 3) and 19–21 days (TCF1hi, n = 5; TCF1lo, n = 6) post transfer into NOD Scid 2nd hosts. c, Absolute numbers of donor T cells recovered in indicated tissues of 2nd NOD Scid hosts 19–21 days post transfer. Top, recovery of 5,000 8.3 TCF1hi (blue) or TCF1lo (red) donor CD8 T cells. Bottom, recovery of 1×10⁶ polyclonal CD4 T cells co-transferred with 5,000 TCF1hi or TCF1lo CD8 T cells. Total donor T cells per spleen, pair of pLN or inguinal LN (iLN), or per 100mg pancreas. Data are mean ± SEM. Statistical testing conducted via unpaired two-tailed Student’s t-test. d, Flow cytometric analysis of active caspases 3 and 7 in IGRP-specific CD8+ T cells isolated from pLN and pancreas. Shown is mean fluorescence intensity (MFI) normalized to MFI of naïve splenocytes. Each symbol represents an individual mouse, lines indicate populations from the same mouse. Pooled data from 2 independent experiments, n = 7 total. Statistical testing conducted by paired Student’s two-tailed t-test. e–g (related to Fig. 3f–h), analysis at day 31 post FTY720 treatment. e, number of 8.3 cells per 100mg pancreas relative to the average number of cells per 100mg pancreas at day 15 (left); flow cytometric analysis of apoptosis using apotracker detection reagent (see Methods) (PBS, n=4; FTY720, n = 3) (right); f, Absolute cell counts per pLN. g, Flow cytometric analysis of apoptosis of 8.3 donor T cells in spleens using apotracker detection reagent. f and g, n = 4 per group. Representative of 1 (e, g) or 2 (f) independent experiments. Each symbol represents an individual mouse. Statistical testing was conducted by unpaired two-tailed Student’s t-tests. Data are mean ± SEM.
Extended Data Fig. 7 |
Extended Data Fig. 7 |. Stem-like functionality of pLN TCF1hi CD8 T cells and generation of differentiated TCF1lo CD8 T cells are independent of lymphopenic conditions.
a, Top, experimental scheme of 8.3 adoptive T cell transfer into NOD Scid (1st host) and wild-type (WT) NOD hosts (2nd host). Bottom, TCF1 and CD39 expression profiles of endogenous NRP-V7 tet+ CD8+ T cells (top) or transferred donor pLN TCF1hi 8.3 CD8+ T cells (bottom) isolated from pLN and pancreas from same WT NOD 2nd hosts 35 days post transfer. Flow plots are representative of n=6 mice. b, Top, experimental scheme of 8.3 adoptive T cell transfer into WT NOD (1st host) and NOD Scid hosts (2nd host). Bottom, Ly108 and CD39 expression profiles of donor 8.3 CD8 T cells in WT NOD 1st hosts isolated from pLN and pancreas 29 days post transfer. Representative of 3 independent experiments with n = 10–15 NOD 1st hosts, n = 5–10 pLN pooled for sort. Right, TCF1 and CD39 expression profiles of donor pLN TCF1hi cells isolated from pLN and pancreas of NOD Scid 2nd hosts 41 days post transfer. Representative of 2 independent experiments with n = 3 mice per group. c, Blood glucose curves of NOD Scid 2nd hosts receiving 200–500 pLN TCF1hi (blue) or 1,000 pancreatic TCF1lo (red) 8.3 CD8 T cells. Each line represents an individual mouse. Representative of 2 independent experiments with n = 3 mice per group.
Extended Data Fig. 8 |
Extended Data Fig. 8 |. Single cell (sc) RNA-seq of pLN IGRP-specific (NRP-V7+) CD8 T cells reveals intermediate cell states during differentiation of pLN TCF1hi to pLN TCF1lo cells.
a, Numbers of T cells in each cluster classified as TCF1hiCD62Lhi, TCF1lo, and intermediate cells in pLN based on scRNA-seq data in individual mice (n=29). b, Smoothed conditional means of expression of selected genes across individual cells ordered by pseudotime; gray shading indicates 95% confidence interval and the bar on top represents the cluster color code. c, Diffusion maps colored by normalized expression values of individual genes. d, Heatmap of pLN scRNA-seq expression (row-based z-score of normalized log counts) for cluster marker genes (false discovery rate (FDR) < 5%). Cells were ordered based on pseudotime. Red bars on top indicate normalized protein expression values as determined by CITE-seq. e, Left, Expression profiles of TCF1, CD62L, and CD39 in pLN IGRP-specific CD8 T cells by flow cytometric analysis; Right, expression of CD62L and CD39 via CITE-seq antibody-derived tags. f, Overrepresented Gene Ontology Biological Process terms based on the marker genes of each cluster.
Extended Data Fig. 9 |
Extended Data Fig. 9 |. scTCR-Seq and genetic barcoding experiments reveal derivation of IGRP-specific pancreatic T cells from pLN TCF1hi population.
a, Alluvial plots tracking the size of non shared (yellow) and shared clonotypes in pLN TCF1hi, pLN TCF1lo, and pancreas (PA) populations from n = 21 mice. Each non-yellow stratum represents a clonotype that is found across multiple populations. b, Number of pancreatic T cells from individual mice that contain clonotypes that were either found in pLN TCF1hi (red) or not found in pLN TCF1hi (orange) population. Each row represents one individual mouse. c, Number of clonotypes across all mice that are shared with at least one other population (blue) or non-shared (yellow) in pLN TCF1hi and pLN TCF1lo populations. d, Fraction of clonotypes in pLN TCF1hi and pLN TCF1lo populations from individual mice that are shared with at least one other population (blue) or non-shared (yellow). Each row represents one mouse. e, Bar plot (top) and Venn diagram (bottom) displaying the different populations from which a given clonotype was recovered. The numbers are based on all clonotypes from all mice for which paired information from pLN and pancreas was available. f, Top, pie charts represent number of cells in each population containing clonotypes from pLN TCF1hi that are shared with at least one other population (n = 127 clonotypes, identified in Extended Data Fig. 9c). Bottom, median number of cells per clonotype in each population split by shared and non shared clonotypes. Each dot represents the cell count from a single mouse. For box plots, center indicates median, lower and upper hinges indicate 25th and 75th percentiles, respectively, and whiskers extend up to 1.5×IQR (interquartile range) from the smallest/highest values; points shown individually fall outside that range. Notches extend 1.58×IQR/sqrt(n), roughly indicating 95% confidence interval for comparing medians. g, Cells from one example shared clonotype are shown within the coordinates of the scRNA-seq based diffusion map. Individual cells are colored according to their cluster membership. h, Left, Alluvial plots from genetic barcoding experiment show barcodes detected in pLN TCF1hi 8.3 and pancreatic 8.3 for n = 2 mice; Right, Venn diagrams show numbers of barcodes detected in pLN TCF1hi 8.3 (to achieve 99% barcode coverage) and expanded in pancreas (>1% of barcodes detected).
Extended Data Fig. 10 |
Extended Data Fig. 10 |. Autoimmune NOD pLN IGRP-specific CD8 T cells in T1D are distinct from CD8 T cells generated during acute and chronic infections.
scRNA-seq datasets from pLN NRP-V7+ CD8 T cells (Fig. 4) were compared to scRNA-seq datasets of memory precursor effector cells (MPEC) and central memory CD8 T cells (TCM) generated during acute LCMV infection (day 7 and day 129 respectively), as well as to progenitor exhausted CD8 T cells (TPEX) from day 7 during chronic (clone 13) LCMV infection. a, Principal component analysis (PCA) of pseudo-bulk RNA-seq samples representing TCF1hiCD62Lhi, TCF1hiCD62Llo (intermediate), and TCF1loCD62Llo NOD pLN NRP-V7+ CD8 T cells from 3 technical replicates from Gearty et al (Fig. 4; T1D), TCM cells from Schauder et al (PNAS 2021; GSE130130; acute LCMV, day 129) and MPEC as well as TPEX as defined by Yao et al (Nat. Immunology, 2019; GSE119943; acute and chronic LCMV, day 7). The bar charts to the left and on the bottom of the PCA plot represent the genes that are most strongly (anti)correlated with a given principal component (PC). b, Dendrogram representing the results of hierarchical clustering based on the pseudo-bulk RNA-seq samples. c, Heatmap displaying row-normalized expression values of individual cells for genes identified as marker genes when comparing the single cells of the different populations (TCF1hiCD62Lhi, intermediate, and TCF1lo, MPEC, TPEX, TCM) to each other. d, Top, GO terms (biological processes) that are enriched based on genes that are specifically overexpressed in the different populations compared to all others. Bottom, the network-like representations display the genes (small circles) that belong to the respective GO terms (large circles), highlighting genes shared among individual GO terms and upregulated in indicated cell populations.
Fig. 1 |
Fig. 1 |. Phenotype, function and heterogeneity of IGRP-specific CD8 T cells.
a, Flow cytometric analysis of IGRP-specific CD8+ T cells from pLN (blue) and pancreas (red) using Kd/NRP-V7 tetramer (gated on live CD45+ cells) (Kd, H2-Kd). Results are representative of at least five independent experiments. b, Expression of CD44, PD1, CD38, CD39, LAG3 and TIGIT in IGRP-specific CD8+ T cells from pLN (blue) and pancreas (PA) (red). Naive T cells (NA) (NRP-V7CD44CD8+ NOD splenocytes) are shown as controls (grey). Representative of 2 or 3 independent experiments; n = 4 or 5. MFI, mean fluorescence intensity. c, IFNγ and TNF production by IGRP-specific CD8+ T cells ex vivo. pLN, n = 4; pancreas, n = 3. Representative of five independent experiments. d, e, TOX (d) and TCF1 (e) expression in IGRP-specific CD8+ T cells from pLN and pancreas. f, Frequency of TCF1hi and/or TCF1lo IGRP-specific CD8+ cells from pLN and pancreas in NOD mice at indicated ages. pLN, n = 6 per time point; pancreas, n = 4 (5–9 weeks); n = 5 (10–14 weeks); n = 6 (15–25 weeks); data pooled from 6 representative experiments. g, Expression of TCF1 versus CD44, CD39 and PD1 in IGRP-specific CD8+ T cells from pLN and pancreas. Data are representative of 2 or 3 independent experiments; n = 3–6. In c, f, each symbol represents an individual mouse. Data are mean ± s.e.m. Paired two-tailed Student’s t-test (c, f).
Fig. 2 |
Fig. 2 |. Genome-wide transcriptome analysis of IGRP-specific CD8 T cell populations from pancreatic lymph node and pancreas.
a, TCF1 and Ly108 expression profiles of IGRP-specific CD8+ T cells from pLN. Boxed quadrants indicate TCF1hiLy108+ and TCF1loLy108 populations sorted for RNA-seq. Representative of at least 5 independent experiments. b, Heat map of DEGs in pLN (row-normalized log2(counts per million); false discovery rate (FDR) < 0.10). c, Principal component analysis of pLN and pancreas RNA-seq data. pLN TCF1hi cells, n = 4; pLN TCF1lo cells, n = 3; pancreatic TCF1lo cells, n = 6. d, Cluster analysis identifying groups of DEGs with shared expression patterns between polyclonal naive CD8 T cells (grey), pLN TCF1hi (dark blue), pLN TCF1lo (light blue) and pancreatic (red) TCF1lo IGRP-specific CD8 T cells. In box plots, centre indicates median, lower and upper hinges indicate 25th and 75th percentiles, respectively, and whiskers extend up to 1.5×interquartile range from the smallest or highest values.
Fig. 3 |
Fig. 3 |. IGRP-specific pLN TCF1hi CD8 T cells represent a stem-like progenitor population that self-renews and gives rise to short-lived AM in the pancreas.
a, Experimental scheme of 8.3–NOD/SCID adoptive transfer model. b, Blood glucose curves (top) and percentage of non-diabetic mice (bottom) of second hosts receiving indicated numbers of pLN TCF1hi or pancreatic TCF1lo 8.3 T cells. n = 3–6 mice per group. c, Donor T cells found in pLN or per 100 mg pancreas of second hosts (19–21 days after transfer of 5,000 cells). Data pooled from two independent experiments; n = 5 (TCF1hi) or n = 6 (TCF1lo). d, TCF1 expression in donor TCF1hi T cells isolated from pLN and pancreas (21 days after transfer). Representative of five independent experiments; n = 5. e, Left, experimental scheme for serial transplantation studies. Middle, blood glucose curves for third hosts receiving 150–1,000 TCF1hi (n = 4) and 20–100 TCF1hi (n = 3) cells. Right, TCF1 expression in TCF1hi cells isolated from third hosts 90 days after transfer. fh, FTY720 treatment studies. f, Top, experimental scheme. Blood glucose curves (left) and percentage of non-diabetic mice (right) among hosts (FTY720, n = 4; PBS, n = 4). g, Insulitis score (with representative images) of pancreatic islets (scale bar, 50 μm). h, Donor 8.3 cell count per 100 mg pancreas. b, e, f, Each line or symbol represents an individual mouse. c, g, h, Data are mean ± s.e.m.; unpaired two-tailed Student’s t-test. b, f, Two-sided log-rank (Mantel–Cox) test.
Fig. 4 |
Fig. 4 |. Single-cell transcriptomic and T cell receptor analyses of IGRP-specific CD8 T cell populations.
a, b, scRNA-seq of pLN NRP-V7+ CD8 T cells. a, Diffusion map based on gene-expression data coloured by clusters. DC, diffusion component. b, Heat map of pLN scRNA-seq expression (row-based z-score of normalized log counts) for selected cluster marker genes (FDR < 5%). Cells are ordered on the basis of pseudotime. ce, scTCR-seq of pLN and pancreatic NRP-V7+ CD8 T cells. c, Representative alluvial plot tracking the size of non-shared (yellow) and shared clones in pLN TCF1hi, pLN TCF1lo and pancreas (PA) populations (n = 21). Every non-yellow stratum represents a clone found across multiple populations. d, Fraction of clones in pancreas (PA) found or not found in pLN TCF1hi cells. e, Top, mean number of total clones per mouse in pLN TCF1hi, pLN TCF1lo and pancreas. Bottom, number of clones in each population that are not shared with other populations in individual mice. Each row represents data from one mouse. f, Proposed model. Autoimmune stem-like TCF1hi T cells in the pLN (pLN AP) self-renew and give rise to short-lived pLN TCF1lo AM (pLN AM), which migrate to the pancreas (pancreatic AM) and kill β-cells; pLN AP must continuously seed the pancreas with new AM for sustained β-cell destruction and induction of T1D.

Comment in

References

    1. Bluestone JA, Bour-Jordan H, Cheng M & Anderson M T cells in the control of organ-specific autoimmunity. J. Clin. Invest. 125, 2250–2260 (2015). - PMC - PubMed
    1. Kaech SM & Cui W Transcriptional control of effector and memory CD8+ T cell differentiation. Nat. Rev. Immunol. 12, 749–761 (2012). - PMC - PubMed
    1. Philip M & Schietinger A CD8+ T cell differentiation and dysfunction in cancer. Nat. Rev. Immunol. 10.1038/s41577-021-00574-3 (2021). - DOI - PMC - PubMed
    1. Bluestone JA, Herold K & Eisenbarth G Genetics, pathogenesis and clinical interventions in type 1 diabetes. Nature 464, 1293–1300 (2010). - PMC - PubMed
    1. Herold KC, Vignali DA, Cooke A & Bluestone JA Type 1 diabetes: translating mechanistic observations into effective clinical outcomes. Nat. Rev. Immunol. 13, 243–256 (2013). - PMC - PubMed

Publication types

MeSH terms