Randomized Controlled Trial
. 2021 Nov 30;9(1):236.
doi: 10.1186/s40168-021-01188-6.

Cognitive behavioral therapy for irritable bowel syndrome induces bidirectional alterations in the brain-gut-microbiome axis associated with gastrointestinal symptom improvement

Affiliations
Randomized Controlled Trial

Cognitive behavioral therapy for irritable bowel syndrome induces bidirectional alterations in the brain-gut-microbiome axis associated with gastrointestinal symptom improvement

Jonathan P Jacobs et al. Microbiome. .

Abstract

Background: There is growing recognition that bidirectional signaling between the digestive tract and the brain contributes to irritable bowel syndrome (IBS). We recently showed in a large randomized controlled trial that cognitive behavioral therapy (CBT) reduces IBS symptom severity. This study investigated whether baseline brain and gut microbiome parameters predict CBT response and whether response is associated with changes in the brain-gut-microbiome (BGM) axis.

Methods: Eighty-four Rome III-diagnosed IBS patients receiving CBT were drawn from the Irritable Bowel Syndrome Outcome Study (IBSOS; ClinicalTrials.gov NCT00738920) for multimodal brain imaging and psychological assessments at baseline and after study completion. Fecal samples were collected at baseline and post-treatment from 34 CBT recipients for 16S rRNA gene sequencing, untargeted metabolomics, and measurement of short-chain fatty acids. Clinical measures, brain functional connectivity and microstructure, and microbiome features associated with CBT response were identified by multivariate linear and negative binomial models.

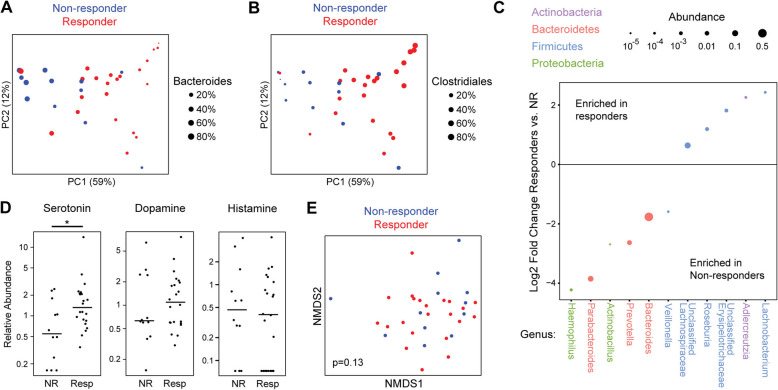
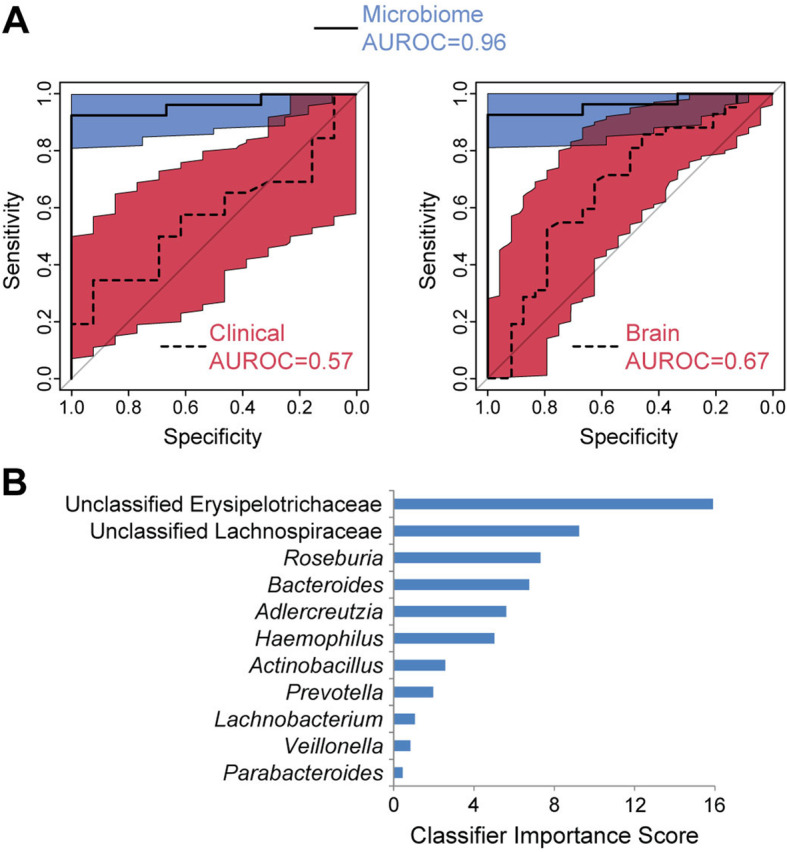
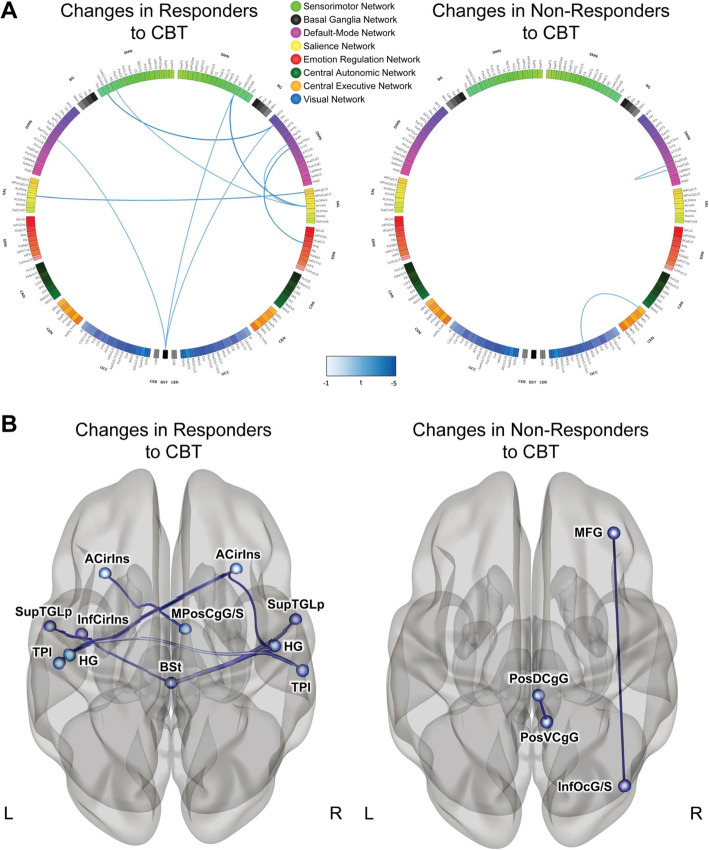
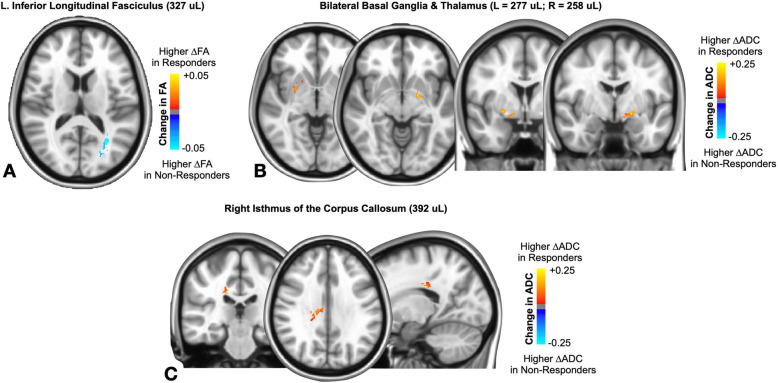
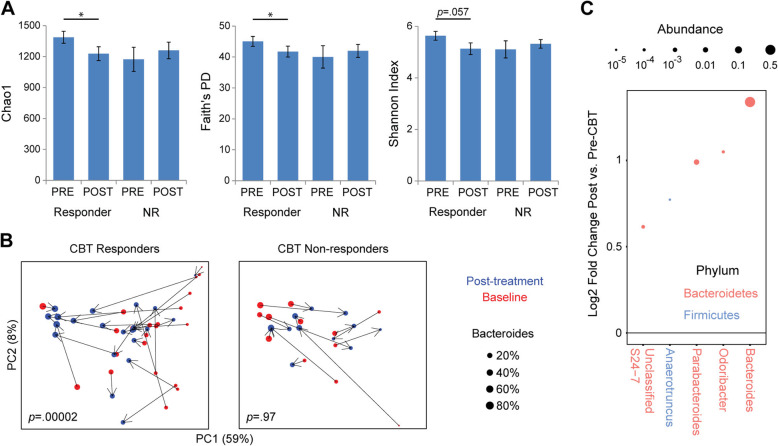
Results: At baseline, CBT responders had increased fecal serotonin levels, and increased Clostridiales and decreased Bacteroides compared to non-responders. A random forests classifier containing 11 microbial genera predicted CBT response with high accuracy (AUROC 0.96). Following treatment, CBT responders demonstrated reduced functional connectivity in regions of the sensorimotor, brainstem, salience, and default mode networks and changes in white matter in the basal ganglia and other structures. Brain changes correlated with microbiome shifts including Bacteroides expansion in responders.

Conclusions: Pre-treatment intestinal microbiota and serotonin levels were associated with CBT response, suggesting that peripheral signals from the microbiota can modulate central processes affected by CBT that generate abdominal symptoms in IBS. CBT response is characterized by co-correlated shifts in brain networks and gut microbiome that may reflect top-down effects of the brain on the microbiome during CBT. Video abstract.

Keywords: Biomarkers; Brain-gut-microbiome axis; Cognitive behavioral therapy; Irritable bowel syndrome; Neuroimaging; Outcome prediction.


Conflict of interest statement

EAM is a scientific advisory board member of Danone, Axial Biotherapeutics, Viome, Amare, Mahana Therapeutics, Pendulum, Bloom Biosciences, APC Microbiome Ireland. BME is an advisor for Hoffman La-Roche; Siemens; Nativis; Medicenna; MedQIA; Bristol Meyers Squibb; Imaging Endpoints; VBL; and Agios Pharmaceuticals. BME is a Paid Consultant for Nativis; MedQIA; Siemens; Hoffman La-Roche; Imaging Endpoints; Medicenna; and Agios. BME received grant funding from Siemens, Agios, and Janssen. JPJ, AG, RRB, JB, KG, KT, VL, RF, GG, JSL, BDN, and JML do not have any disclosures.

Figures

Fig. 1
Fig. 1
Baseline fecal microbiota and serotonin are associated with CBT response. A, B Principal coordinates (PC) analysis of 16S rRNA sequence data. Each dot represents the baseline microbiome composition of one IBS participant. Color denotes CBT responder status and dots are sized by the fraction of the microbiome comprised of the Bacteroides genus (A) or Clostridiales order (B). C Microbial genera with statistically significant association with CBT responder status (q<.05) are shown. The y axis shows the log2 of the fold change between responders vs. non-responders (NR). Dot size is proportional to mean relative abundance across all samples. D Baseline relative abundances (median scaled) in feces of the neurotransmitters serotonin, dopamine, and histamine. Lines indicate medians. * p<.05 by Mann–Whitney U test. e Non-metric multidimensional scaling analysis (NMDS) (stress=0.20) of global metabolomics profiles. Color denotes CBT responder status. P value calculated by Adonis, adjusting for sex and bowel habit subtype
Fig. 2
Fig. 2
Classifiers derived from baseline fecal microbiota profiles outperformed those based on clinical/demographic and neuroimaging data to predict CBT response. A Receiver operating characteristic curves of random forest classifiers for CBT response constructed from differentially abundant microbial genera, baseline clinical/demographic data (left panel), or brain data (right panel). The 95% confidence intervals are represented as colored regions surrounding these curves (blue=microbiome, red=clinical/demographics or brain). B Importance scores for the 11 microbial genera in the random forests classifier
Fig. 3
Fig. 3
Changes in functional connectivity in responders and non-responders to CBT. A Connectograms demonstrating pair-wise connectivity differences in responders and non-responders to CBT. Significant decreases in connectivity between brain regions are denoted by blue lines connecting the regions (color intensity indicates magnitude of effect). There were no significant increases in connectivity. SMN: sensorimotor network, BG: basal ganglia, DMN: default mode network, SAL: salience network, ERN: emotion regulation network, CAN: central autonomic network, CEN: central executive Network, OCC: occipital/visual network. B Regions that significantly differed between responders and non-responders to CBT. Responders to CBT: ACirIns (anterior insula/anterior segment of the circular sulcus of the insula), MPosCgG/S (anterior mid-cingulate cortex), InfCirIns (anterior insula/inferior segment of the circular sulcus of the insula), SupTGLp (lateral aspect of the superior temporal gyrus), HG (Heschl’s gyrus), TPI (planum temporale), BSt (brainstem). Non-responders to CBT: MFG (middle frontal gyrus), PosDCgG (dorsal posterior cingulate cortex), PosVCgG (ventral posterior cingulate cortex), InfOcG/S (inferior occipital gyrus and sulcus)
Fig. 4
Fig. 4
CBT responders had distinct changes in white matter integrity compared to non-responders. A Colored areas indicate regions within the left inferior longitudinal fasciculus that had a significant change in FA after CBT. Color corresponds to relative difference in FA change between CBT responders and non-responders. B, C Colored areas indicate regions of the bilateral basal ganglia and anterior thalamus (B) and isthmus of the corpus callosum (C) that had a significant change in ADC after CBT. Color corresponds to relative difference in ADC change between CBT responders and non-responders
Fig. 5
Fig. 5
CBT responders have altered intestinal microbiome composition after CBT characterized by Bacteroides expansion. A Fecal microbial alpha diversity is shown for CBT responders and non-responders (NR) at baseline (PRE) and after CBT (POST). Three metrics are used: Chao1 index (richness), Faith’s phylogenetic diversity (PD), and Shannon index (richness and evenness). * p<.05. B Principal coordinates analysis of 16S rRNA sequence data before and after CBT, stratified by CBT response status. Each dot represents a sample, colored by time point (red=baseline, blue=post-CBT) and sized by Bacteroides abundance. Arrows connect samples from the same participants, with post-treatment indicated by the arrowhead. P values calculated by Adonis, adjusting for participant. C Microbial genera with statistically significant association with CBT responder status (q<.05) are shown. The y axis shows the log2 of the fold change between responders vs. non-responders. Dot size is proportional to mean relative abundance across all samples

References

    1. Hellstrom PM, Benno P. The Rome IV: irritable bowel syndrome - a functional disorder. Best Pract Res Clin Gastroenterol. 2019;40-41:101634. doi: 10.1016/j.bpg.2019.101634. - DOI - PubMed
    1. Palsson OS, Whitehead WE, van Tilburg MA, Chang L, Chey W, Crowell MD, Keefer L, Lembo AJ, Parkman HP, Rao SS, et al. Rome IV diagnostic questionnaires and tables for investigators and clinicians. Gastroenterology. 2016;150(6):1481–1491. doi: 10.1053/j.gastro.2016.02.014. - DOI - PubMed
    1. American College of Gastroenterology Task Force on Irritable Bowel S, Brandt LJ, Chey WD, Foxx-Orenstein AE, Schiller LR, Schoenfeld PS, Spiegel BM, Talley NJ, Quigley EM: An evidence-based position statement on the management of irritable bowel syndrome. Am J Gastroenterol 2009, 104 Suppl 1:S1-35. - PubMed
    1. Francis CY, Morris J, Whorwell PJ. The irritable bowel severity scoring system: a simple method of monitoring irritable bowel syndrome and its progress. Aliment Pharmacol Ther. 1997;11(2):395–402. doi: 10.1046/j.1365-2036.1997.142318000.x. - DOI - PubMed
    1. Spiegel B, Camilleri M, Bolus R, Andresen V, Chey WD, Fehnel S, Mangel A, Talley NJ, Whitehead WE: Psychometric evaluation of patient-reported outcomes in irritable bowel syndrome randomized controlled trials: a Rome Foundation report. Gastroenterology 2009, 137(6):1944-1953 e1941-1943. - PMC - PubMed

Publication types

Substances

Associated data