. 2021 Nov 30;5(2):e202101270.
doi: 10.26508/lsa.202101270. Print 2022 Feb.

Microfluidic characterisation reveals broad range of SARS-CoV-2 antibody affinity in human plasma

Affiliations

Microfluidic characterisation reveals broad range of SARS-CoV-2 antibody affinity in human plasma

Matthias M Schneider et al. Life Sci Alliance. .

Abstract

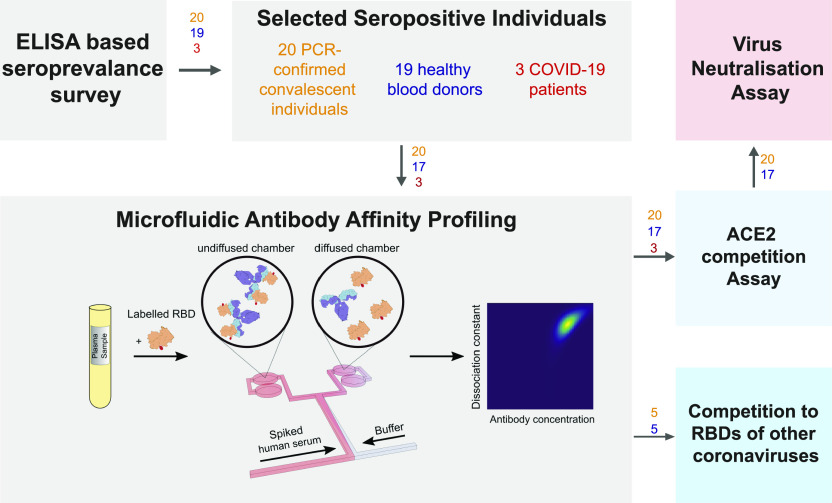
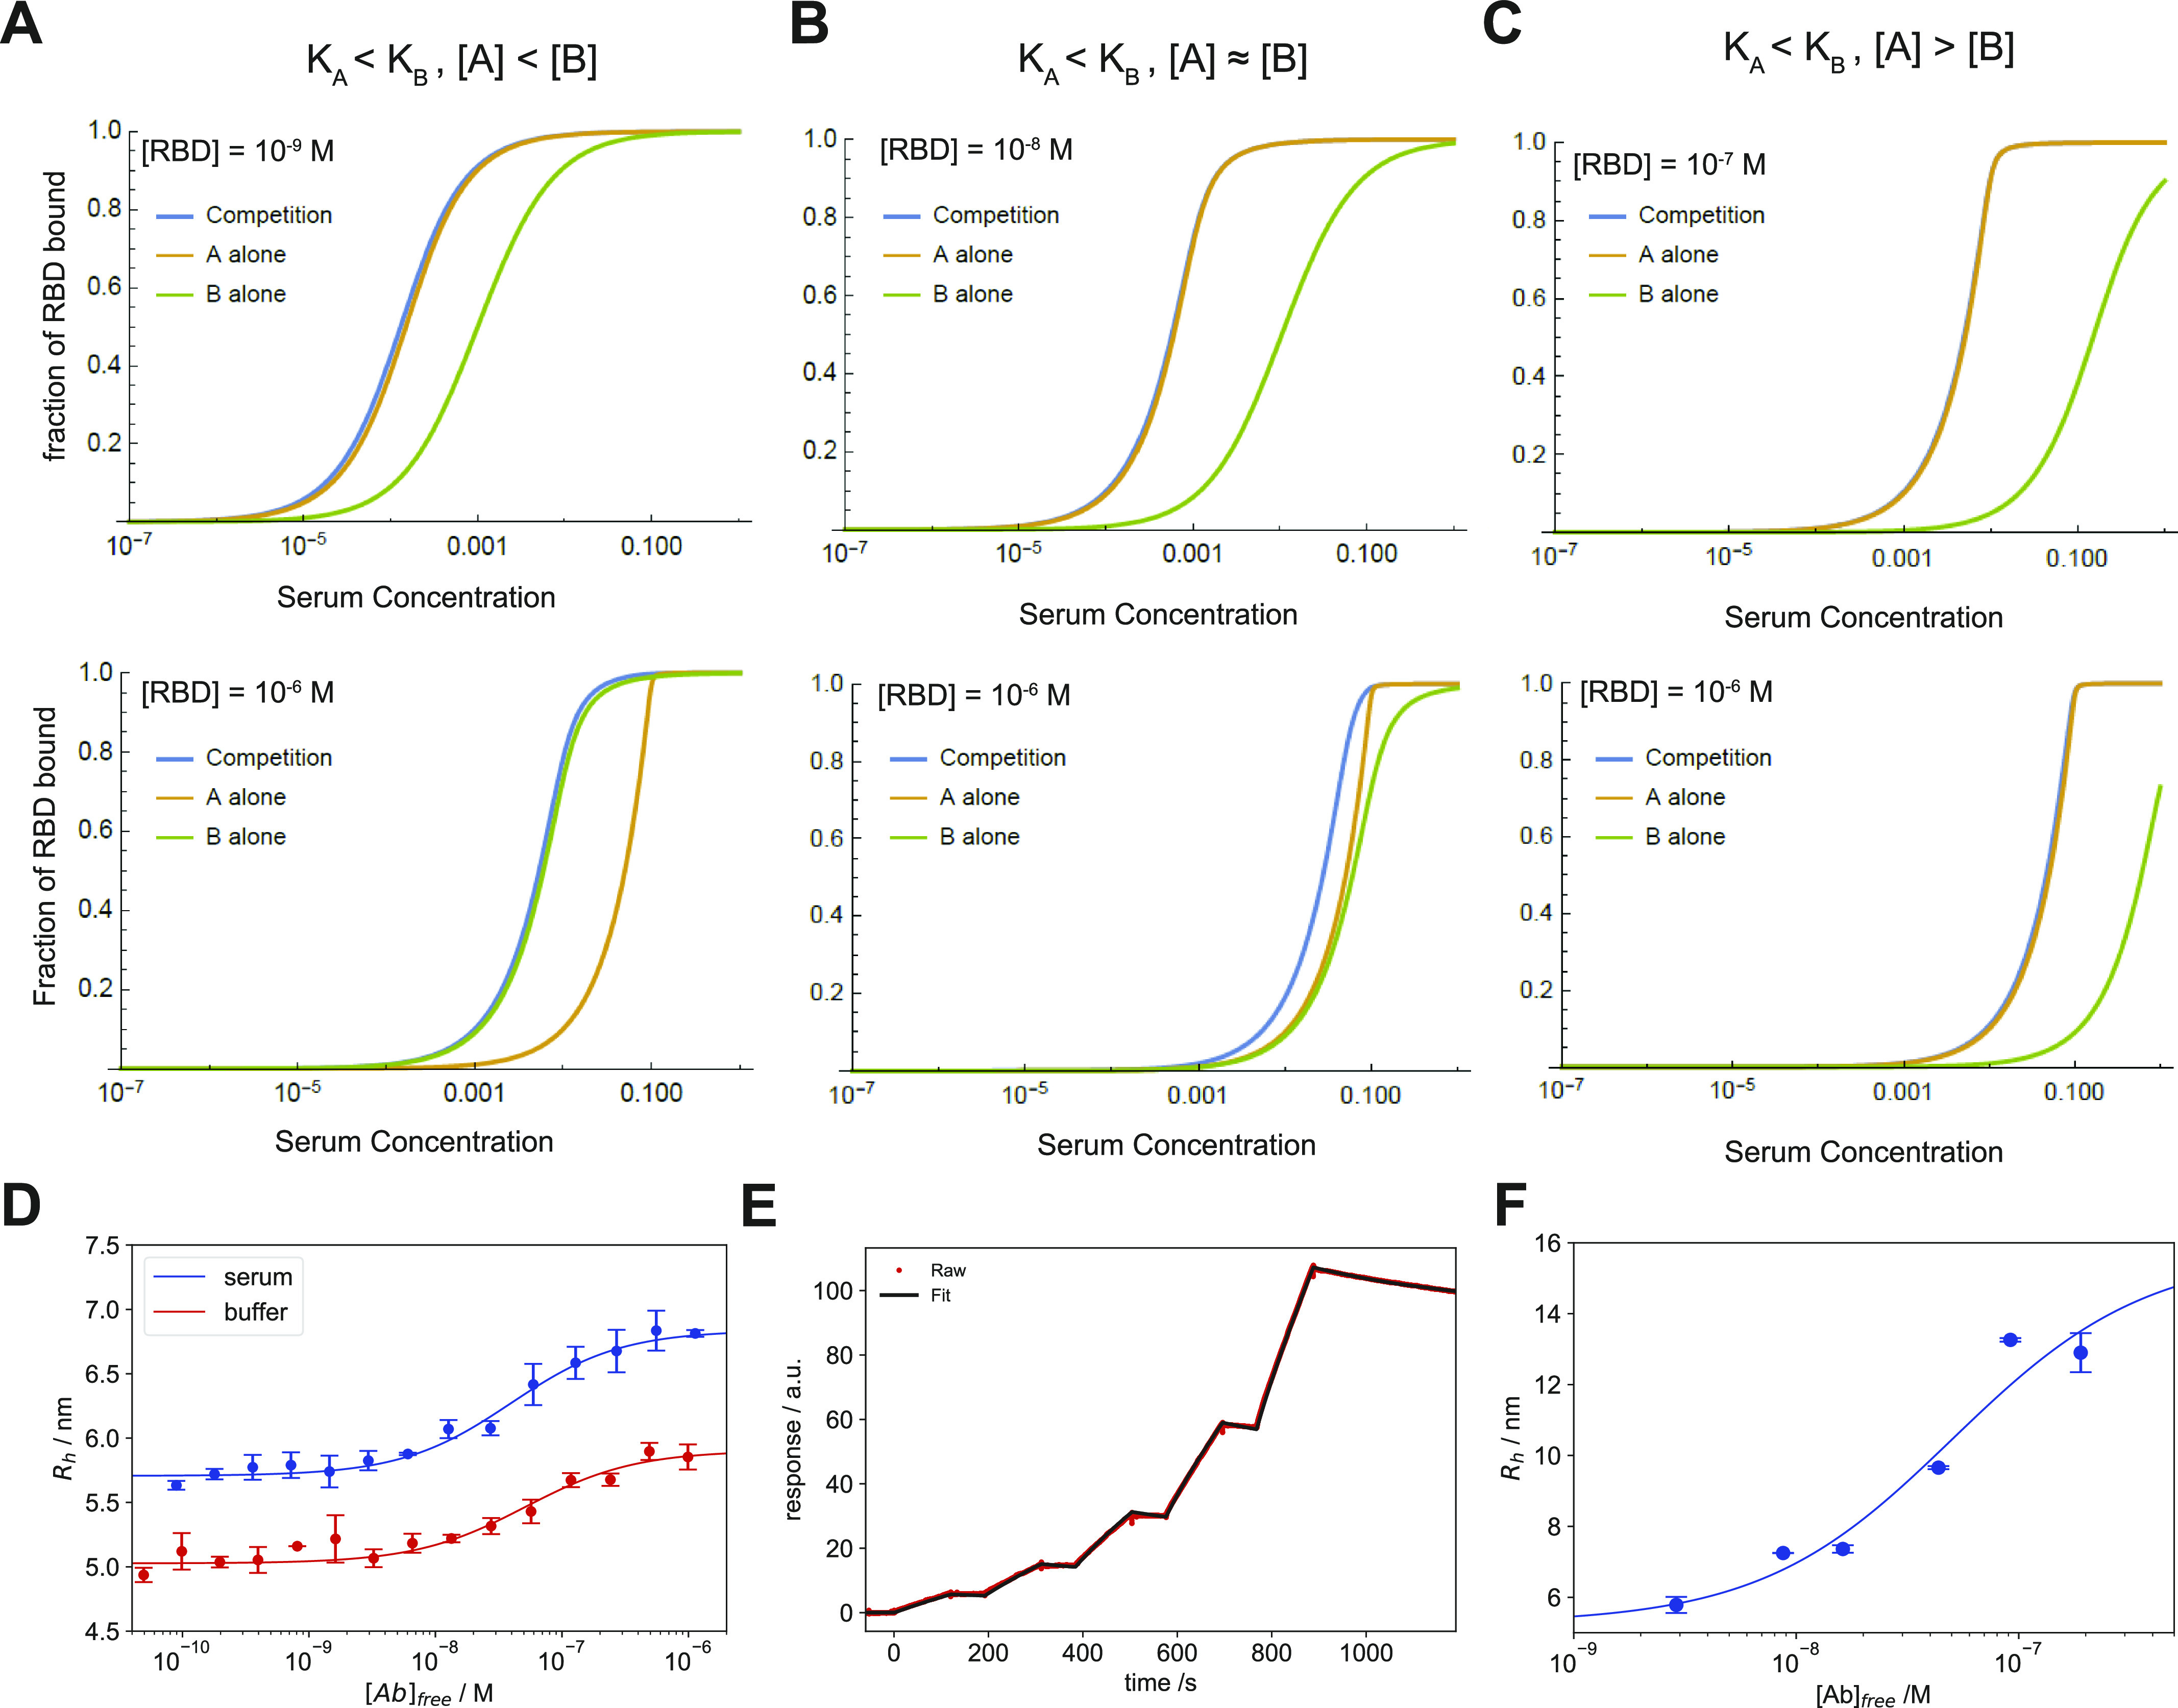
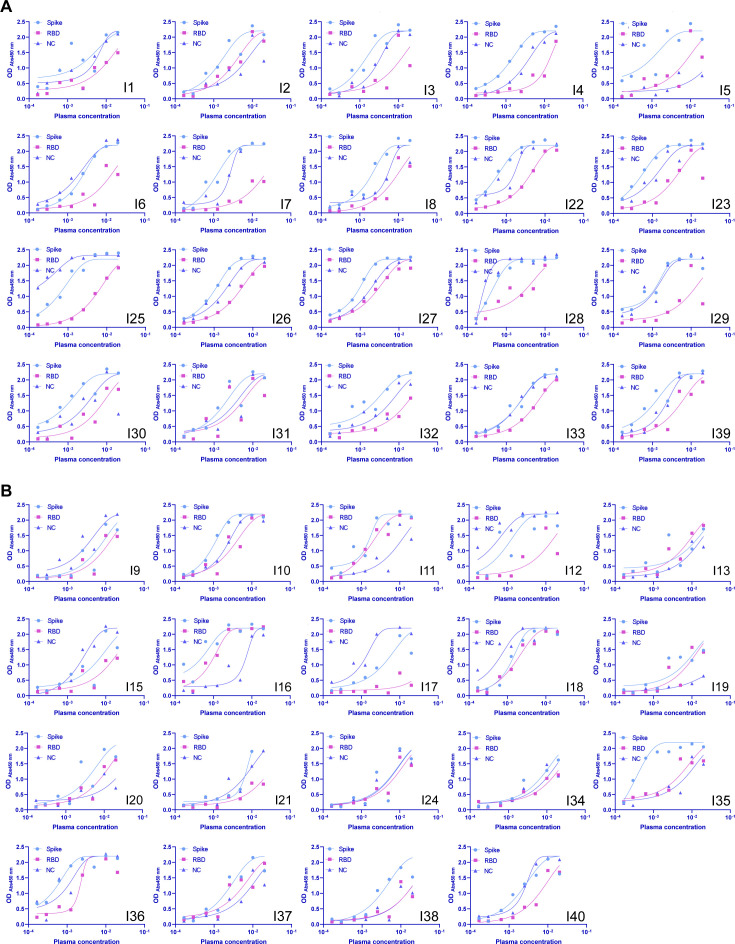
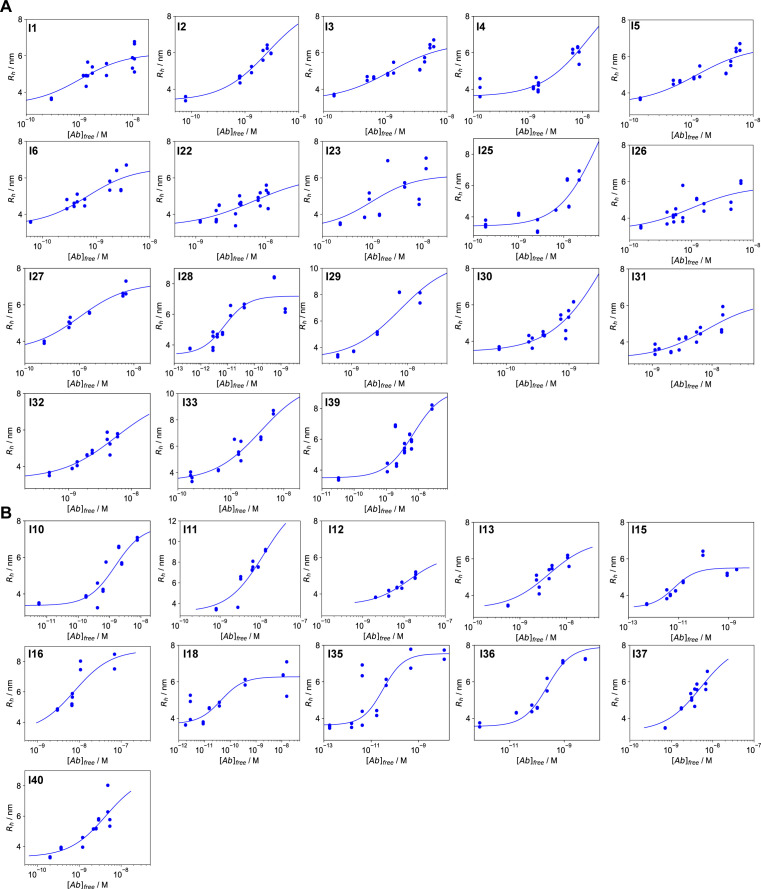
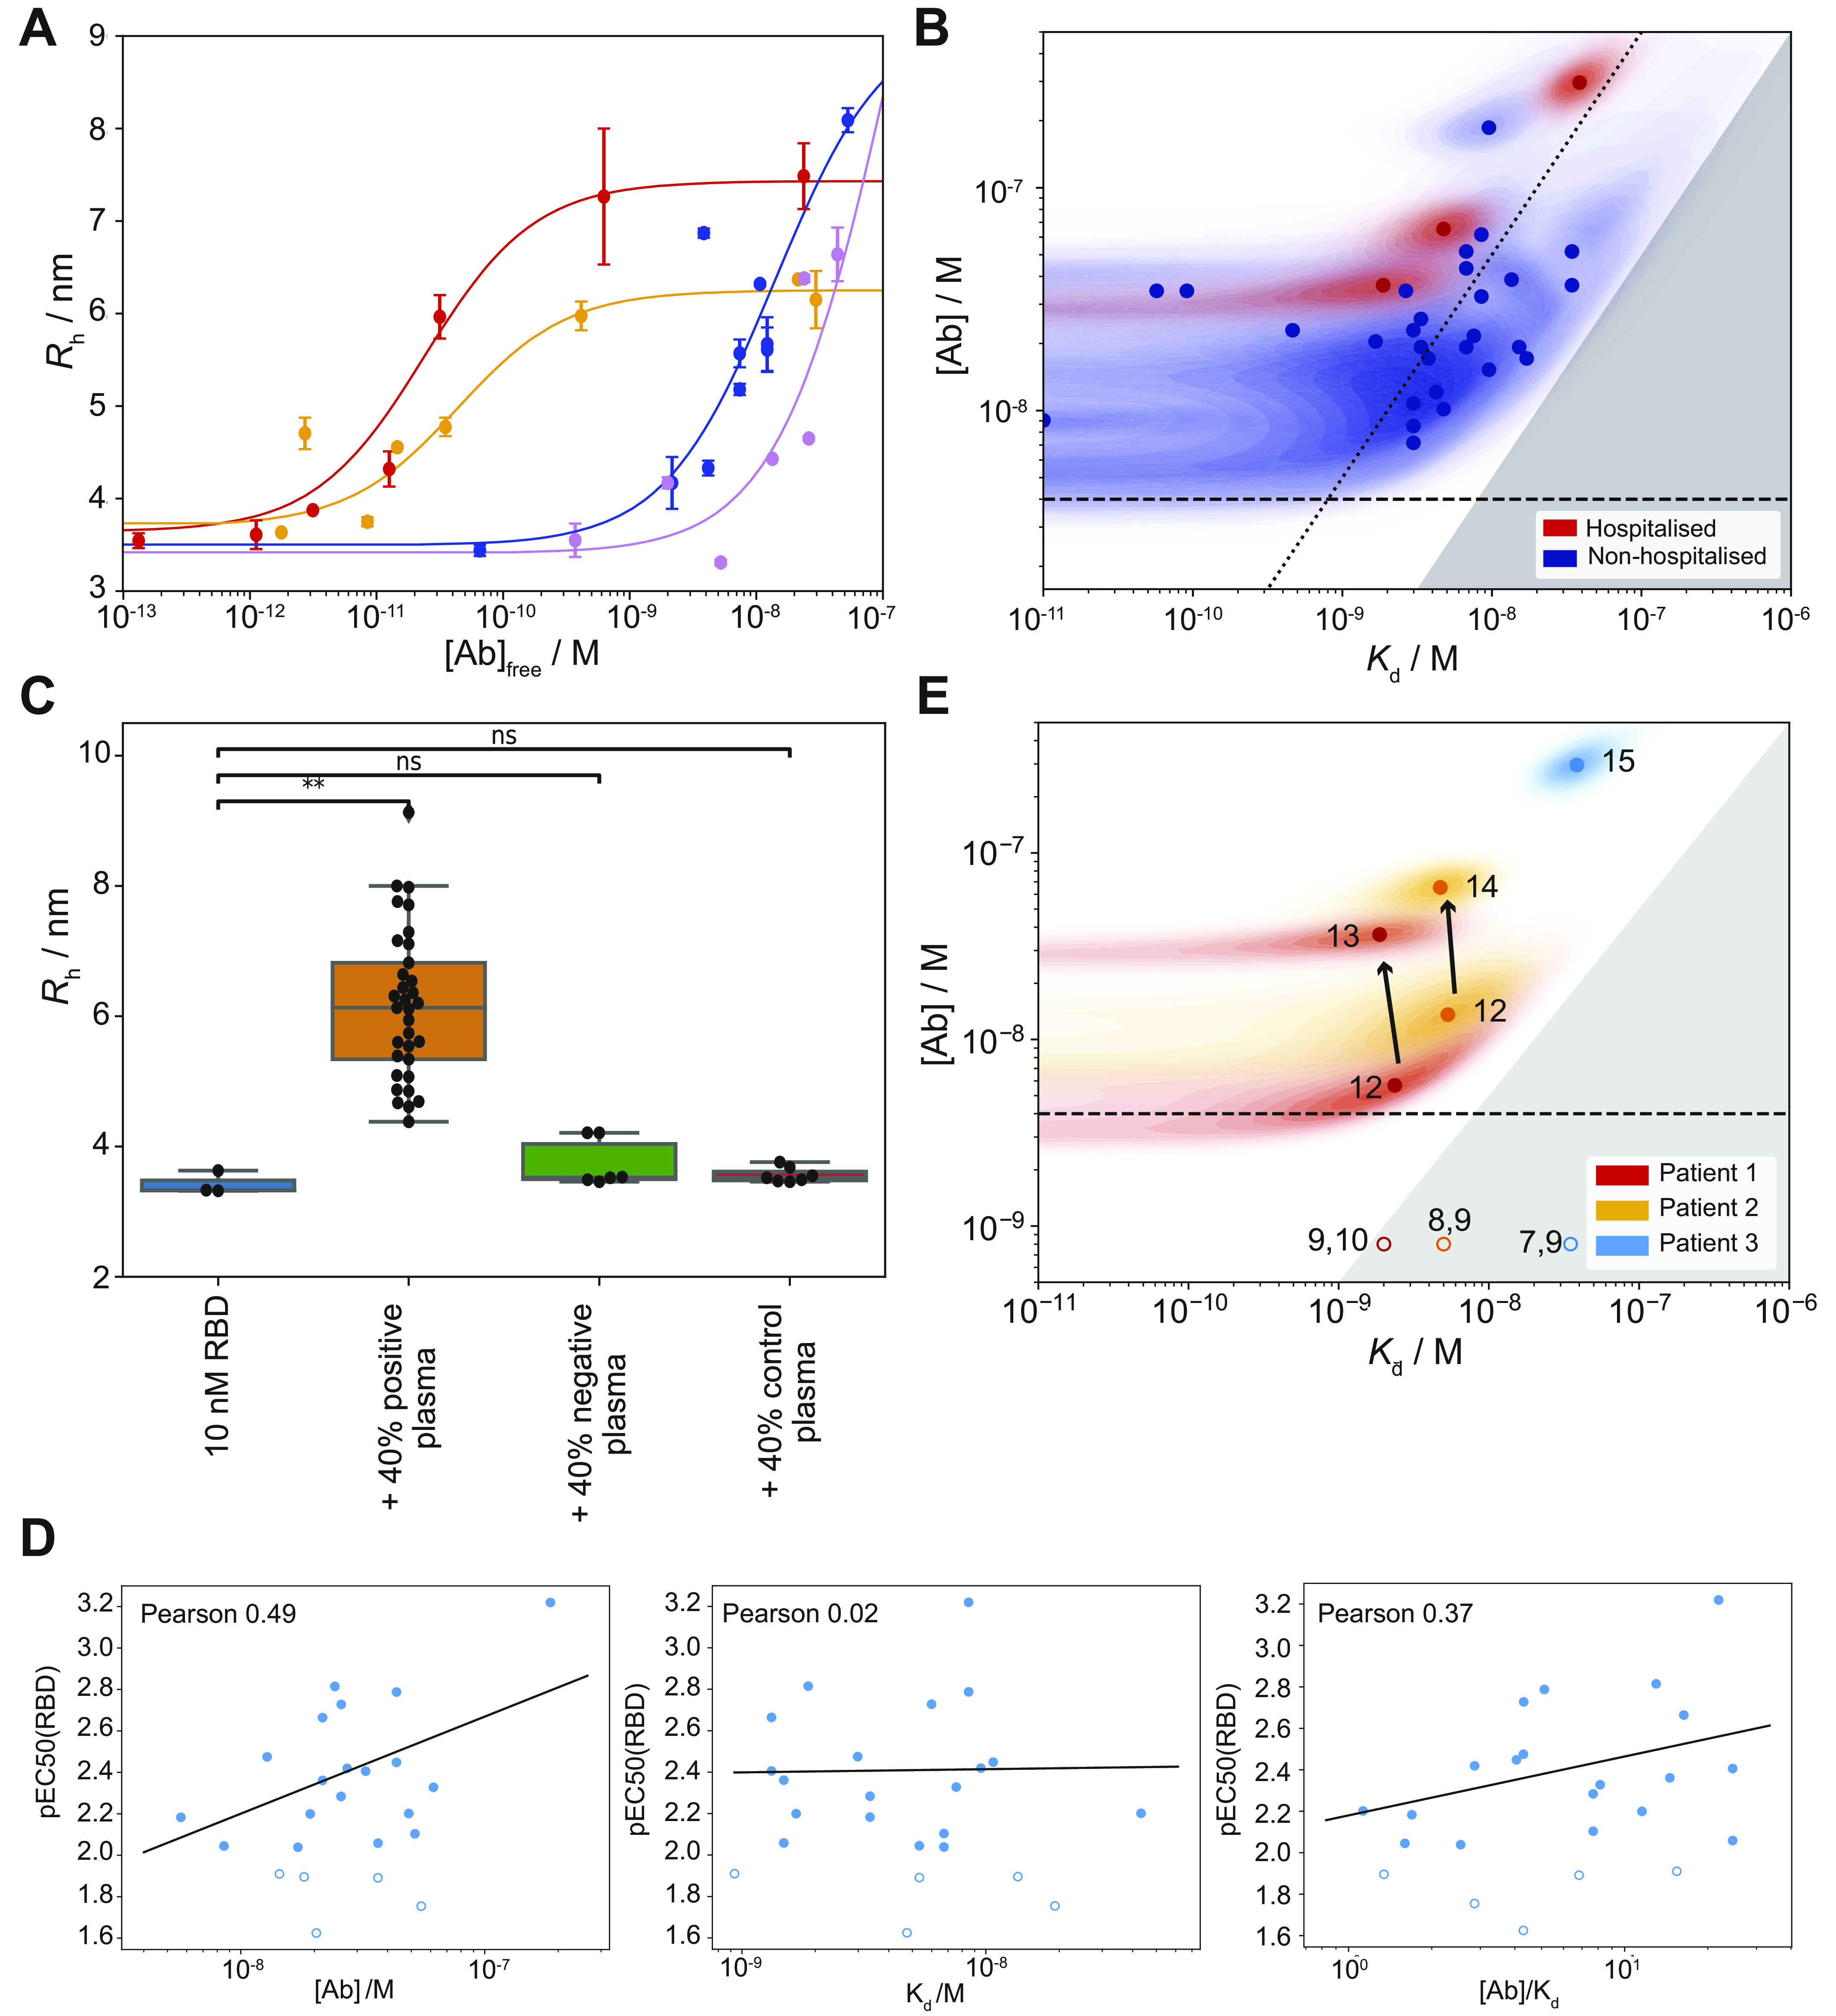
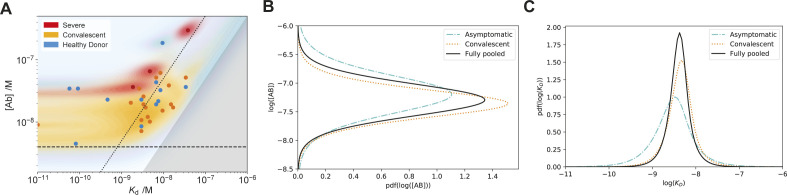
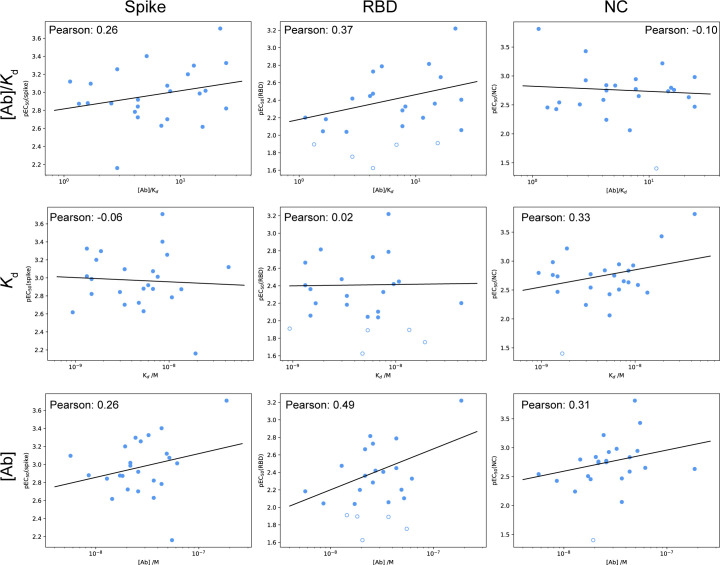
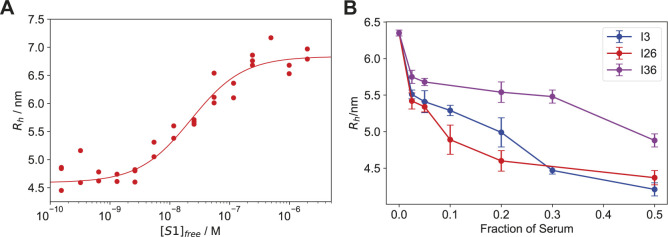
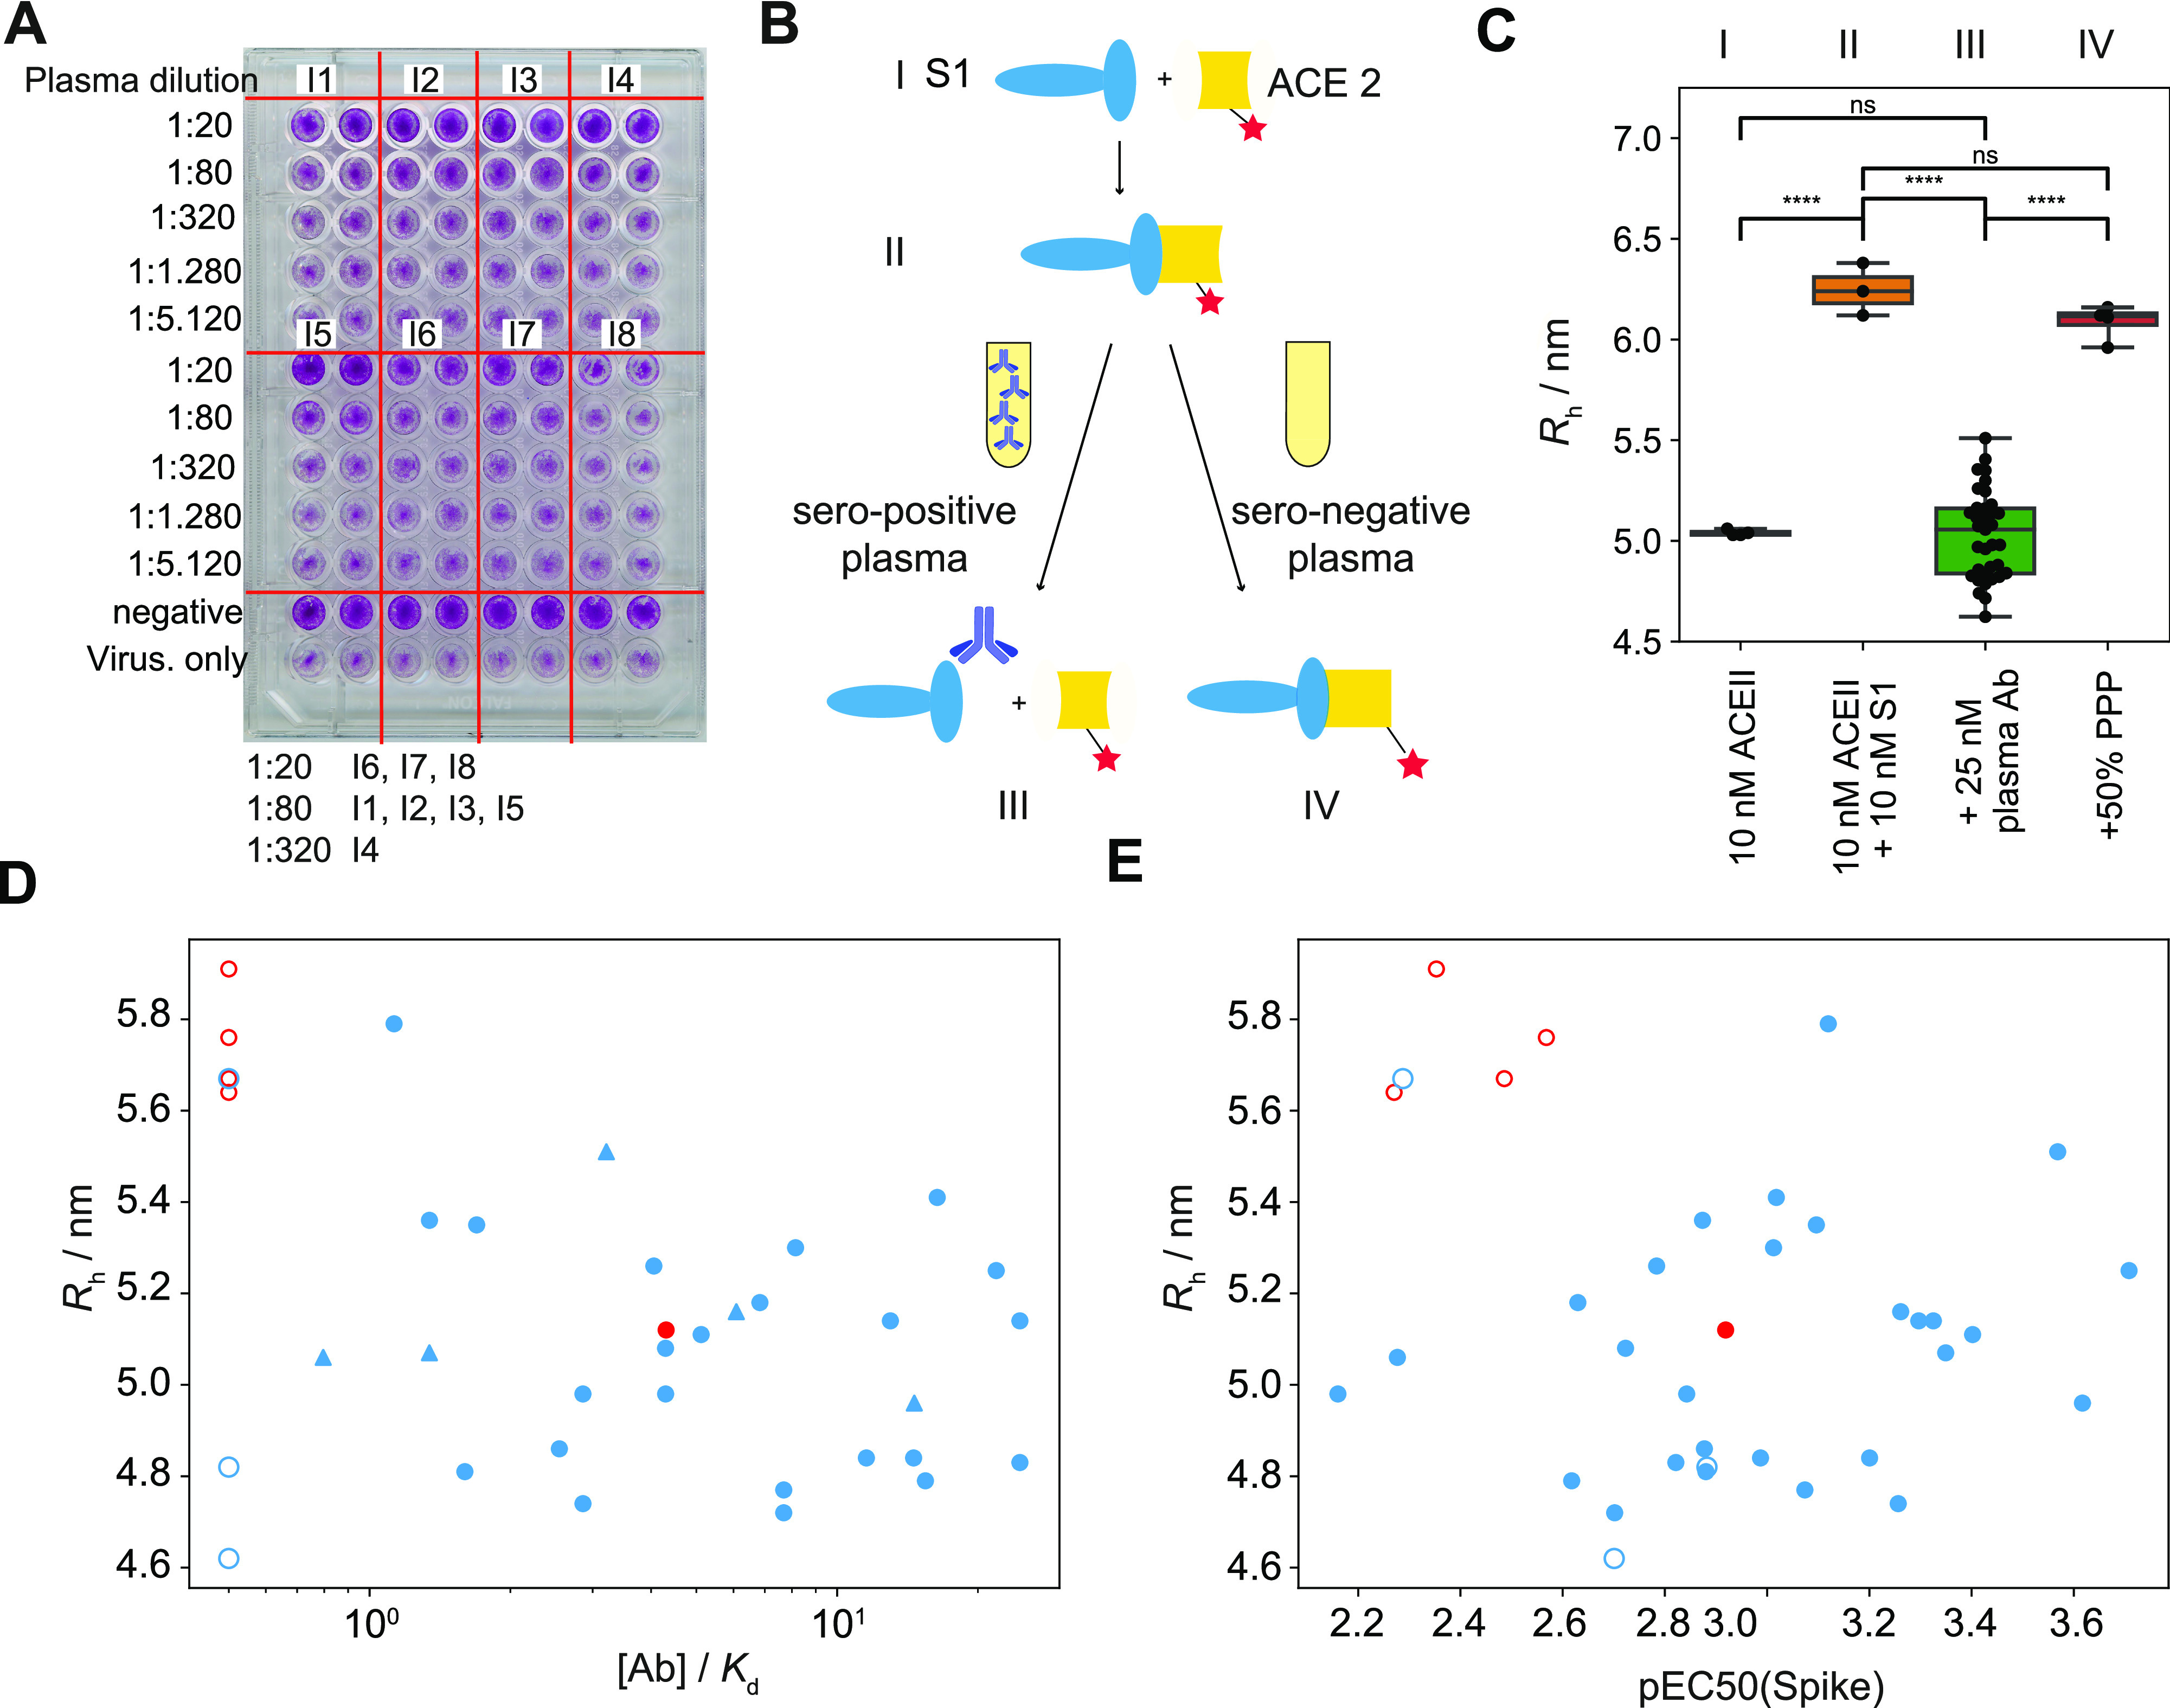
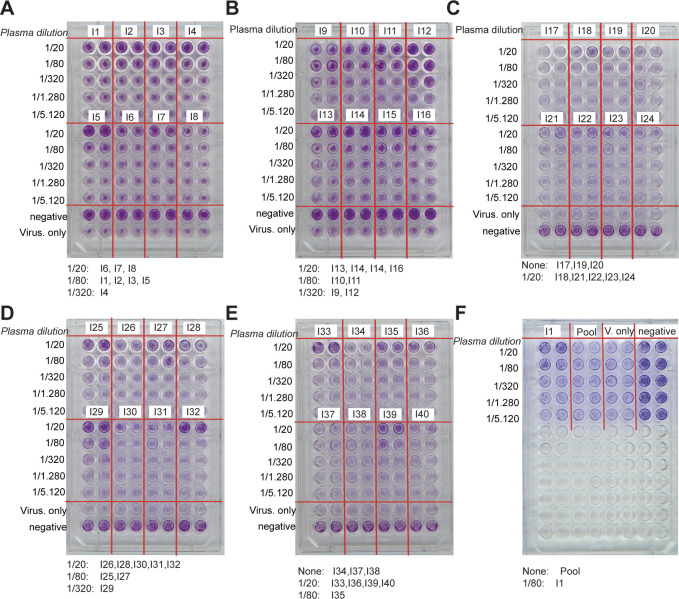
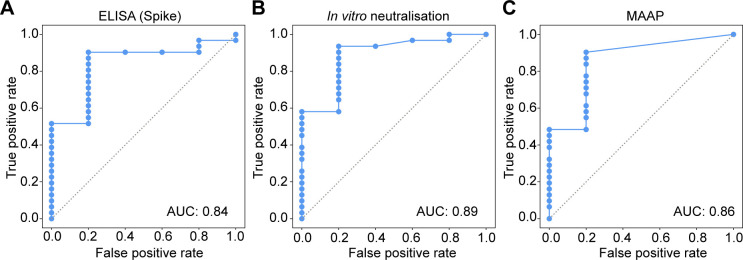
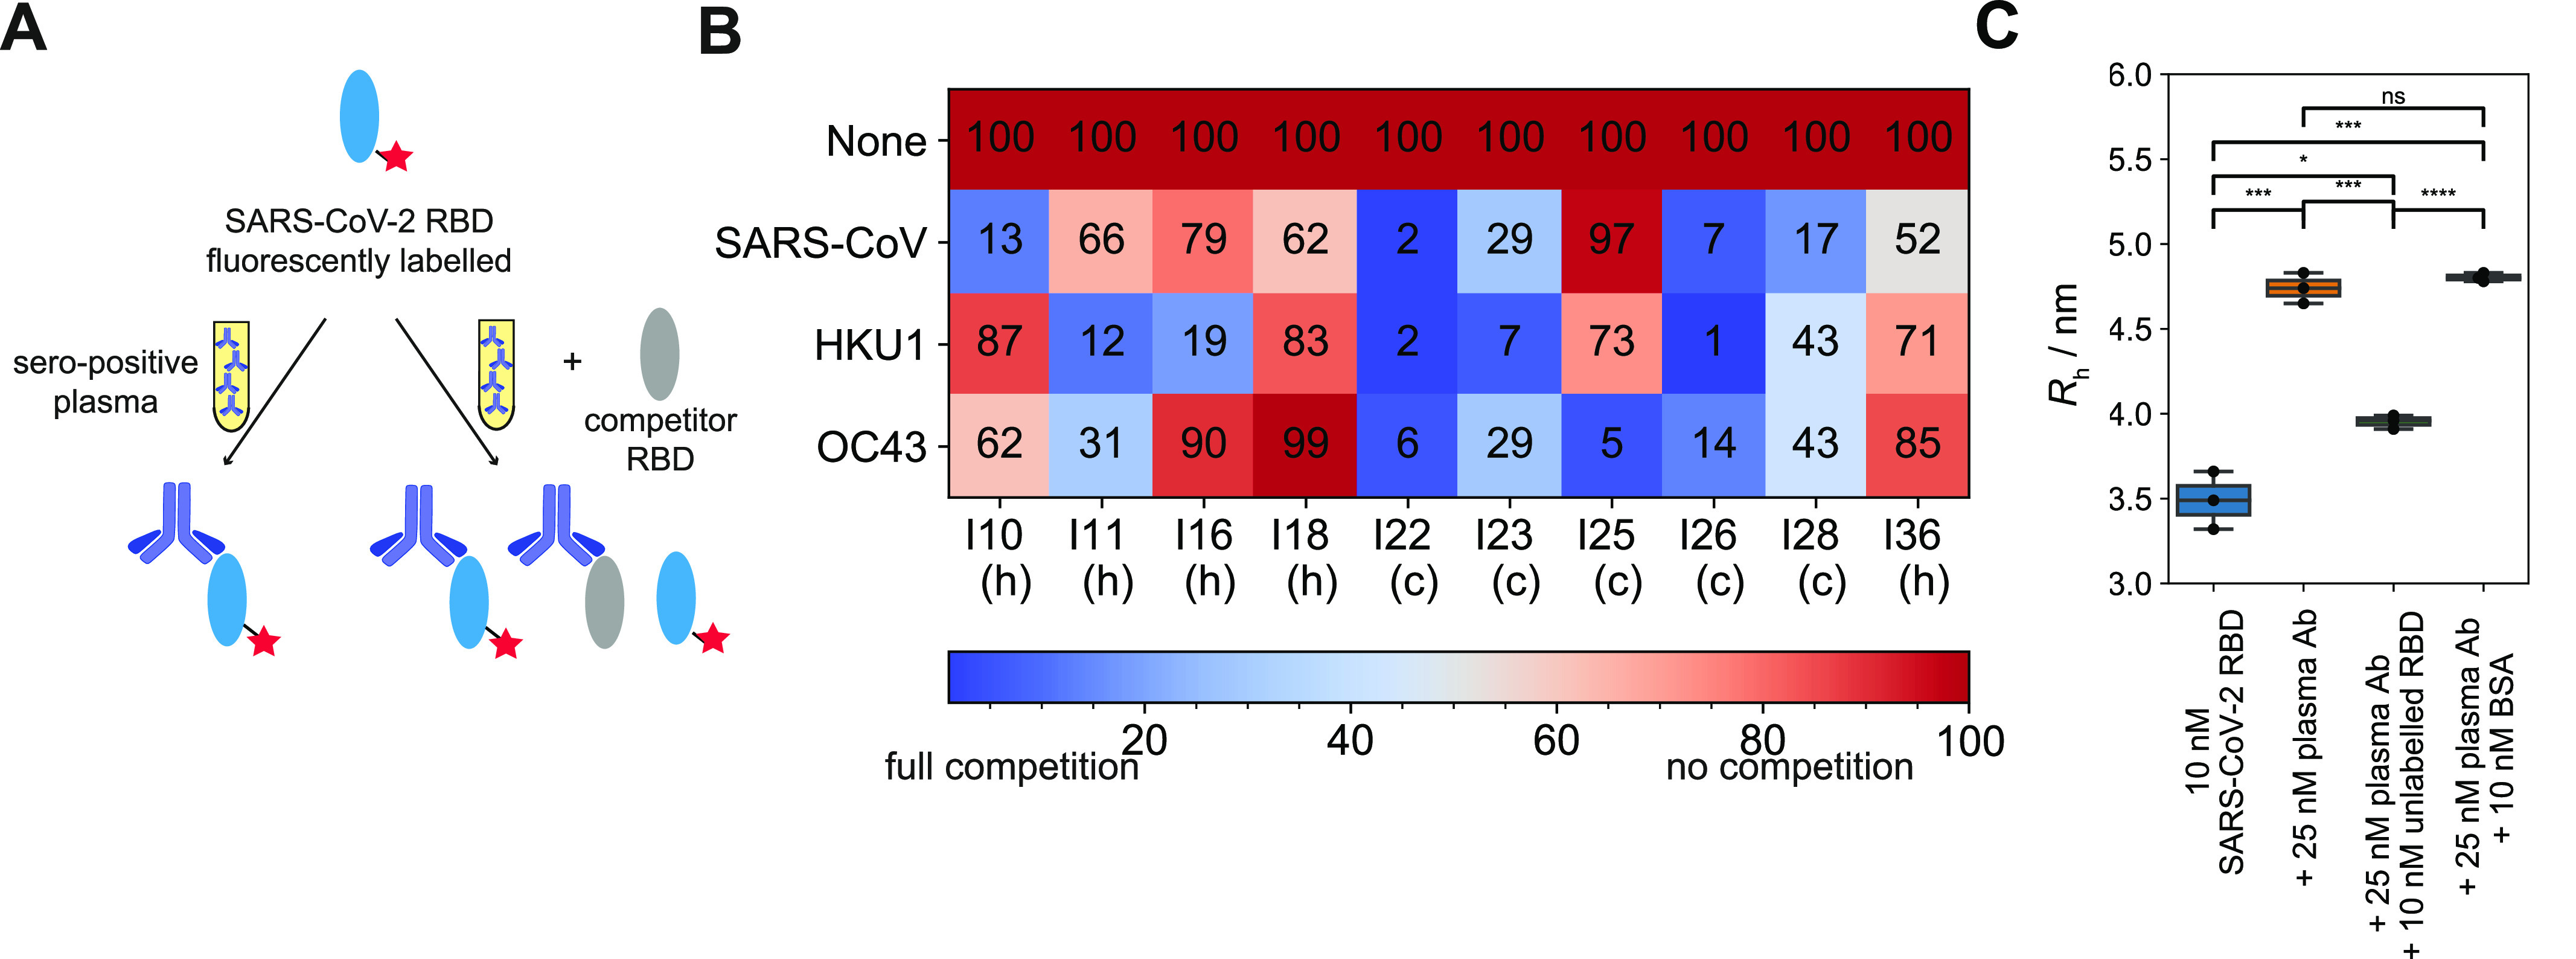
The clinical outcome of SARS-CoV-2 infections, which can range from asymptomatic to lethal, is crucially shaped by the concentration of antiviral antibodies and by their affinity to their targets. However, the affinity of polyclonal antibody responses in plasma is difficult to measure. Here we used microfluidic antibody affinity profiling (MAAP) to determine the aggregate affinities and concentrations of anti-SARS-CoV-2 antibodies in plasma samples of 42 seropositive individuals, 19 of which were healthy donors, 20 displayed mild symptoms, and 3 were critically ill. We found that dissociation constants, K d, of anti-receptor-binding domain antibodies spanned 2.5 orders of magnitude from sub-nanomolar to 43 nM. Using MAAP we found that antibodies of seropositive individuals induced the dissociation of pre-formed spike-ACE2 receptor complexes, which indicates that MAAP can be adapted as a complementary receptor competition assay. By comparison with cytopathic effect-based neutralisation assays, we show that MAAP can reliably predict the cellular neutralisation ability of sera, which may be an important consideration when selecting the most effective samples for therapeutic plasmapheresis and tracking the success of vaccinations.


Conflict of interest statement

TPJ Knowles is a member of the board of directors of Fluidic Analytics. A Aguzzi is a member of the board of directors of Mabylon AG which has funded antibody-related work in the Aguzzi lab in the past. V Denninger, S Fiedler, H Fiegler are employees of Fluidic Analytics, MM Schneider, CK Xu, G Meisl and V Kosmoliaptsis are consultants. All other authors declare no competing interests.

Figures

Figure 1.
Figure 1.. Principle of the study.
First, we selected seropositive individuals based on a large-scale seroprevalence survey ( Preprint) and performed four assays: microfluidic antibody affinity profiling, a cytopathic effect–based neutralisation assay, an angiotensin-converting enzyme 2 competition assay and a receptor-binding domain (RBD) cross-reactivity assay. For microfluidic antibody affinity profiling, blood was taken from 42 individuals who underwent an infection with SARS-CoV-2 as confirmed by ELISA. The blood cells were removed by centrifugation and fluorescently labelled RBD protein was added to the plasma, leading to complex formation between the antibodies in the plasma and the extrinsically added fluorescently labelled protein. The average size of fluorescent particles can be inferred from their diffusion rates, providing a readout of the degree of binding. The angiotensin-converting enzyme 2 competition assay and RBD cross-reactivity assay both rely on co-incubation of viral proteins with antibodies and a competitor molecule. The numbers above the arrows represent the number of samples for PCR-confirmed COVID-19–positive individuals (orange), healthy donors who did not undergo PCR testing (blue), and hospitalised COVID-19 patients (red).
Figure 2.
Figure 2.. Proof of concept.
(A, B, C) Simulation of the competition of two receptor-binding domain (RBD)–reactive antibodies, A and B, with KA = 10−9 M and KB = 10−7 M, respectively. (A) For the case in which [A] < [B], there are two sub-regimes: if the RBD concentration is approximately equal to or lower than KA, the combined behaviour resembles that of the stronger binding species A (top). If RBD is present around or above the higher equilibrium constant, KB, then the behaviour resembles that of the weaker binding species (bottom). In between, the behaviour is intermediate. (A, B) For the situation where [A] ≈ [B], the combined response is dominated by the tighter binder (A) in both high and low RBD concentration. (A, C) For [A] > [B], the signal measured is also determined by the tightly binding antibody (A), regardless of the RBD concentration. (D) Binding curve of commercial antibody CR3022 IgG (ab273073, Abcam) in PBS-T (containing 5% HSA [wt/vol]) with RBD yielding a dissociation constant Kd = 35 [5, 98] nM, and Kd = 46 [10,117] nM in human serum. This is in good agreement with literature values (24). (E, F) Binding curve of human-derived anti-SARS-CoV-2 S2 antibody B4 with (E) spike ectodomain using surface-plasmon resonance (Kd = 1.46 ± 0.01 nM) and (F) spike ectodomain with microfluidic antibody affinity profiling, yielding a Kd = 27 [12,46] nM. The anti-SARS-CoV-2 S2 domain antibody B4 was labelled with Alexa 647 for the Microfluidic Antibody Affinity Profiling experiment. Data in d and f are represented as mean ± SD of replicate measurements.
Figure S1.
Figure S1.. ELISA data for the different donors. [1]
In light blue, the binding to the spike protein, in pink to the receptor-binding domain and in blue triangles to NC is shown. (A, B) Convalescent individuals, (B) healthy donors.
Figure S2.
Figure S2.. Binding curves for all non-hospitalised patients in Fig 3B
(A, B) Convalescent donors and (B) healthy donors.
Figure 3.
Figure 3.. Affinity and concentration determination in patient plasma.
(A, B) Binding curves for the two samples with the highest and the lowest Kd from panel (B). Tight binders (red curve [Kd < 4.1 × 10⁻¹⁰ M] and yellow curve [Kd < 6.7 × 10⁻¹⁰ M]) are visibly distinguishable from weaker binders (blue curve [Kd = 8.5 × 10⁻⁹ M] and purple curve [Kd = 3.4 × 10⁻⁸ M]), as they reach the binding transition at lower antibody concentrations. Because a mixture of differently glycosylated antibodies is likely to be present (10), different radii at saturation level are observed for different individuals. The binding curves for all samples are shown in Fig S3. Data are represented as mean ± SD of replicate measurements. (B) Probability distributions of dissociation constants, Kd, and antibody concentrations, assuming two receptor-binding domain (RBD) binding sites per antibody, for seropositive individuals (blue) and hospitalised COVID-19 patients (red), where significant binding to the RBD was detected. Points correspond to the maximum probability values in the two-dimensional probability distributions (shaded areas). In line with physical principles of binding, binding is not observed for samples with 2[Ab] < Kd (grey region). Notably, some individuals express RBD-reactive antibody such that 2[Ab] ≥ 10Kd (to the right of the dotted line). (C) Increase in hydrodynamic radius compared to pure fluorescently labelled RBD (blue) with positive plasma samples (orange), six samples which did not show a size increase (green), and six pre-pandemic control plasma samples (red). Unpaired t test: P < 0.01 (**), non-significant (ns). The whiskers show the minimum and maximum values from the distribution. (D) Comparison between ELISA (RBD) and microfluidic antibody affinity profiling (MAAP) results for RBD binding, for samples which gave rise both to a peaked probability distribution in both [Ab] and Kd by MAAP, and to a pEC50 value greater than two in ELISA. Plots of the pEC50 value are shown in comparison to the MAAP-determined ratio of antibody concentration to Kd (left), Kd (middle), and antibody concentration (right). Pearson correlation coefficients are given for each plot. (E) Time evolution of Kd and [Ab] probability distributions in patients who required hospitalization; binding was observed by MAAP for three out of four patients investigated. In both patients monitored during the infection (red and orange, filled circles), the antibody concentration increased over time, with no change in binding affinity. Numbered labels indicate the number of days post disease onset (DPO), whereas the grey area represents the region of parameter space in which binding is too low to be measurable by MAAP (2[Ab] < Kd). Open circles correspond to earlier time points for which binding was not detectable and their position is for illustration purposes only.
Figure S3.
Figure S3.. Correlation of MAAP data with symptoms.
(A) Probability distributions of dissociation constants, Kd, and antibody concentrations in Fig 2B (assuming two receptor-binding domain binding sites per antibody). Healthy donors (blue), PCR-confirmed convalescent (orange), and severely afflicted (red) patients. Points correspond to the maximum probability values in the two-dimensional probability distribution, and coloured regions to the probability density. We do not observe significant difference in either Kd or concentration between different symptom severities. (A, B, C) To address the question whether either log(Kd) and/or log([AB]) differ significantly between asymptomatic and convalescent patients, we analysed the likelihoods from (A) with a partially pooled (grouped by symptoms) and fully pooled hierarchical model (2), as described in the Materials and Methods section. (B, C) displays the posterior distribution for θ = log([AB]) and (C) for θ = log(Kd). The observation that the posterior distributions for asymptomatic (dashed) and convalescent (dotted) patients in the partially pooled model are largely overlapping with one another and the posterior distribution for the fully pooled model (solid) suggests that there are no significant differences between log(Kd) and log([AB]) based on the symptoms experienced.
Figure S4.
Figure S4.. Comparison between ELISA (spike: left column, receptor-binding domain: middle column, and nucleocapsid: right column antigens) and microfluidic antibody affinity profiling results for receptor-binding domain binding.
Plots of the pEC50 value are shown in comparison to the microfluidic antibody affinity profiling–determined ratio of antibody concentration to Kd (top row), Kd (middle row), and antibody concentration (bottom row). Only samples which yielded a peaked posterior distribution in both Kd and antibody concentration are shown, of which only those with pEC50 > 2 (filled) were used for the linear regression. Remaining data are shown as open circles. Pearson correlation coefficients are given for each plot.
Figure S5.
Figure S5.. Angiotensin-converting enzyme 2 competition.
(A) Binding curve of 10 nM angiotensin-converting enzyme 2 against fluorescently labelled S1 protein, showing a Kd of 18 [11, 29] nM. Triplicates are shown as individual points. (B) Dilution series showing concentration-dependent decrease of hydrodynamic radii in three COVID-19–infected individuals in the competition assay outlined in Fig 5. Error bars are the SD of triplicate measurements.
Figure 4.
Figure 4.. Angiotensin-converting enzyme 2 (ACE2) competition and cytopathic effect–based neutralisation.
(A) Example plate from a neutralisation assay based on cytopathic effects. We observe neutralisation at a dilution of 1:20 for blood samples from individuals 6, 7, and 8, 1:80 for individuals 1, 2, 3, and 5, and 1:320 for individual 4. All images are shown in Fig S6. (B) Schematic of the ACE2 competition assay. We incubated the spike protein with the ACE2 receptor, leading to the formation of the spik–ACE2 complex. Upon the addition of neutralising plasma, this complex is disassembled. (C) Hydrodynamic radii of ACE2 in the presence of spike protein in plasma samples of seropositive individuals. When seropositive samples are used, no binding to ACE2 is detected, demonstrating the capability of the antibodies present in plasma to inhibit the interaction relevant for cellular uptake of the virus. By contrast, pre-pandemic plasma samples do not inhibit the spike–ACE2 interaction. Unpaired t test: P < 0.0001 (****), non-significant (ns). The whiskers show the minimum and maximum values from the distribution. (D, E) Apparent radius in the ACE2 competition assay compared to the [Ab]/Kd ratio obtained from microfluidic antibody affinity profiling (MAAP) (D) or to ELISA pEC50 (spike) (E) for samples which gave rise to a peaked posterior probability distribution in both [Ab] and Kd (filled circles) and samples for which no binding was observed by MAAP (open circles). The [Ab]/Kd ratio of non-binding samples is assumed to be 0.5, the limit of detection by MAAP, whereas triangles represent the lower bound on [Ab]/Kd for samples which yielded a constrained posterior probability distribution in [Ab], but only an upper bound on Kd by MAAP. Samples which were able to neutralise in the cytopathic effect–based assay are shown in blue, and those incapable of neutralisation at the titres tested are shown in red.
Figure S6.
Figure S6.. Cytopathic effect–based neutralisation assay.
(A, B, C, D, E, F) Overview over all plates with the respective interpretation of the critical titre below the images for (A) Individuals I1-I8, (B) I9-I16, (C) I17-I24, (D) I25-I32, (E) I33-I40, and (F) controls for individual I1, pooled samples, virus only, and negative control plasmas.
Figure S7.
Figure S7.. Comparison of MAAP with cell neutralisation assay.
(A, B, C) Receiver-operating characteristic curves demonstrating the ability of the ELISA EC50(spike) (A), in vitro angiotensin-converting enzyme 2 competition assay (B), and microfluidic antibody affinity profiling assay (C) to predict the ability of the serum to neutralise in the cytopathic effect–based neutralisation assay, regardless of titre.
Figure 5.
Figure 5.. Cross-reactivity between different receptor-binding domains (RBD)s.
(A) Assay principle. Labelled SARS-CoV-2 RBD was incubated against antibodies from plasma of seropositive individuals. In the absence of any competing RBDs, the binding saturates. In the presence of unlabelled competitor RBD, the antibodies can bind to both the labelled SARS-CoV-2 RBD and the unlabelled competitor RBD, which in turn leads to the presence of unbound labelled SARS-CoV-2 RBD, causing a decrease in the apparent hydrodynamic radius of the mixture of the labelled SARS-CoV-2 RBD. (B) Relative decreases in hydrodynamic radii, expressed as percentages, for 10 individuals with different competitor RBDs from SARS-CoV, HKU1, and OC43. 0% indicates that there is no size increase as compared to pure SARS-CoV-2 RBD, meaning that binding of the antibodies to the SARS-CoV-2 RBD is fully inhibited, whereas 100% means that the SARS-CoV-2 RBD-antibody binding was unaffected because there was no competition from the unlabelled RBD. Five samples are from healthy (denoted h) and five from convalescent (denoted c) donors. (C) Control experiments for competition assay. 10 nM labelled RBD SARS-CoV-2 was incubated with 25 nM antibodies of plasma samples from seropositive individuals. When incubated in additional presence of 10 nM unlabelled RBD SARS-CoV-2, the radius decreased significantly, whereas the radius remained the same upon addition of BSA. The whiskers show the minimum and maximum values from the distribution. Unpaired t test: P < 0.0001 (****), P < 0.001 (***), P < 0.001 (**), P < 0.05 (*), non-significant (ns).

Similar articles

Cited by

References

    1. Karlinsky A, Kobak D (2021) Tracking excess mortality across countries during the COVID-19 pandemic with the World Mortality Dataset. Elife 10: e69336. 10.7554/eLife.69336 - DOI - PMC - PubMed
    1. Beutler B (2004) Innate immunity: An overview. Mol Immunol 40: 845–859. 10.1016/j.molimm.2003.10.005 - DOI - PubMed
    1. Du Z, Zhu F, Guo F, Yang B, Wang T (2020) Detection of antibodies against SARS-CoV-2 in patients with COVID-19. J Med Virol 92: 1735–1738. 10.1002/jmv.25820 - DOI - PMC - PubMed
    1. Guo L, Ren L, Yang S, Xiao M, Chang D, Yang F, Dela Cruz CS, Wang Y, Wu C, Xiao Y, et al. (2020) Profiling early humoral response to diagnose novel coronavirus disease (COVID-19). Clin Infect Dis 71: 778–785. 10.1093/cid/ciaa310 - DOI - PMC - PubMed
    1. Long QX, Liu BZ, Deng HJ, Wu GC, Deng K, Chen YK, Liao P, Qiu JF, Lin Y, Cai XF, et al. (2020) Antibody responses to SARS-CoV-2 in patients with COVID-19. Nat Med 26: 845–848. 10.1038/s41591-020-0897-1 - DOI - PubMed

MeSH terms

Substances