. 2022 Mar 1;12(3):812-835.
doi: 10.1158/2159-8290.CD-21-1077.

Mutant IDH Inhibits IFNγ-TET2 Signaling to Promote Immunoevasion and Tumor Maintenance in Cholangiocarcinoma

Affiliations

Mutant IDH Inhibits IFNγ-TET2 Signaling to Promote Immunoevasion and Tumor Maintenance in Cholangiocarcinoma

Meng-Ju Wu et al. Cancer Discov. .

Abstract

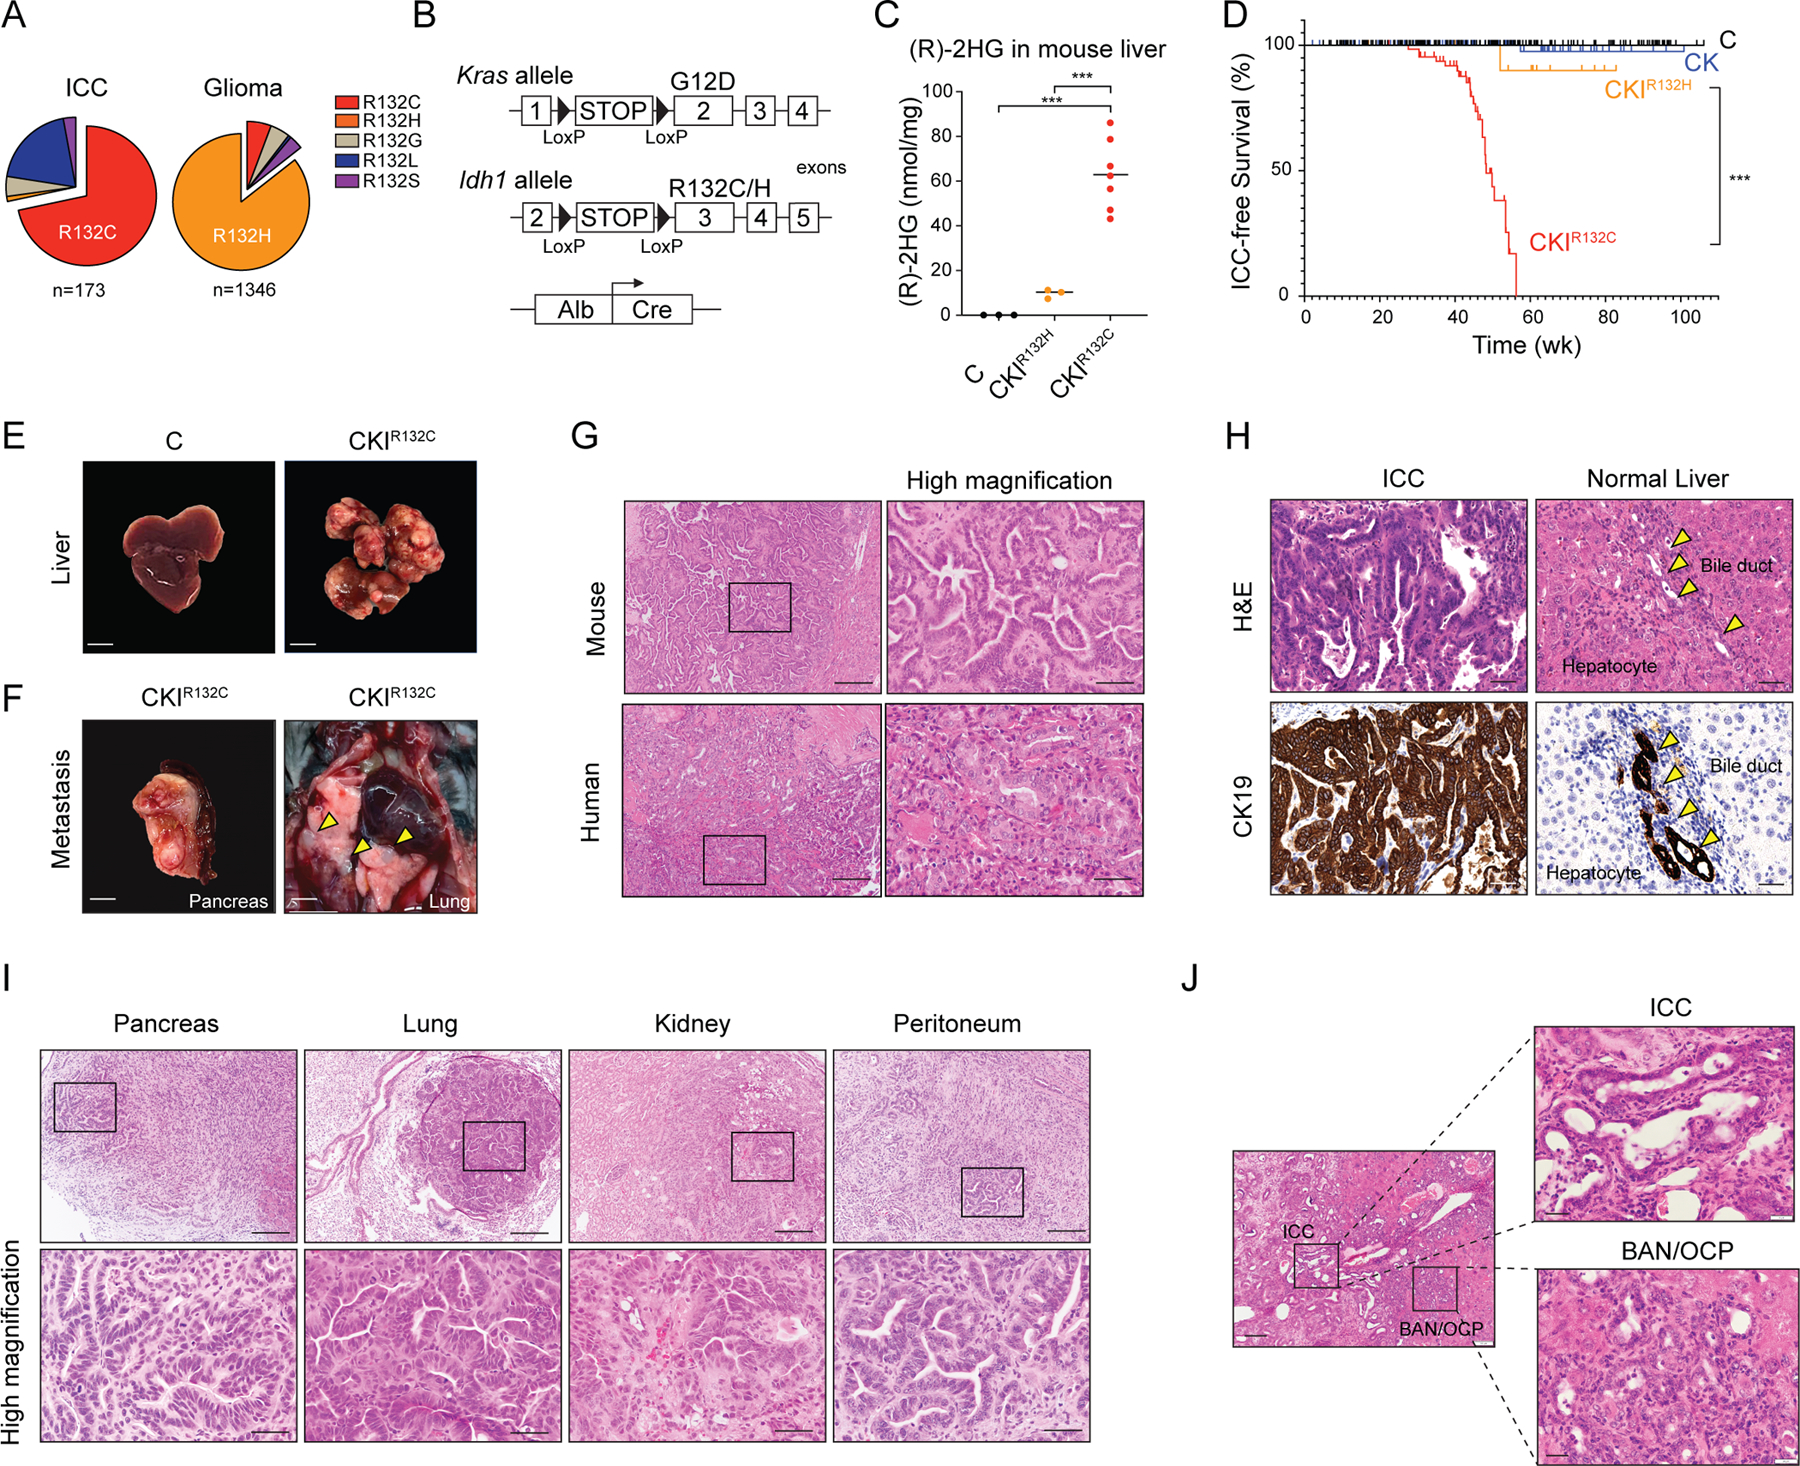
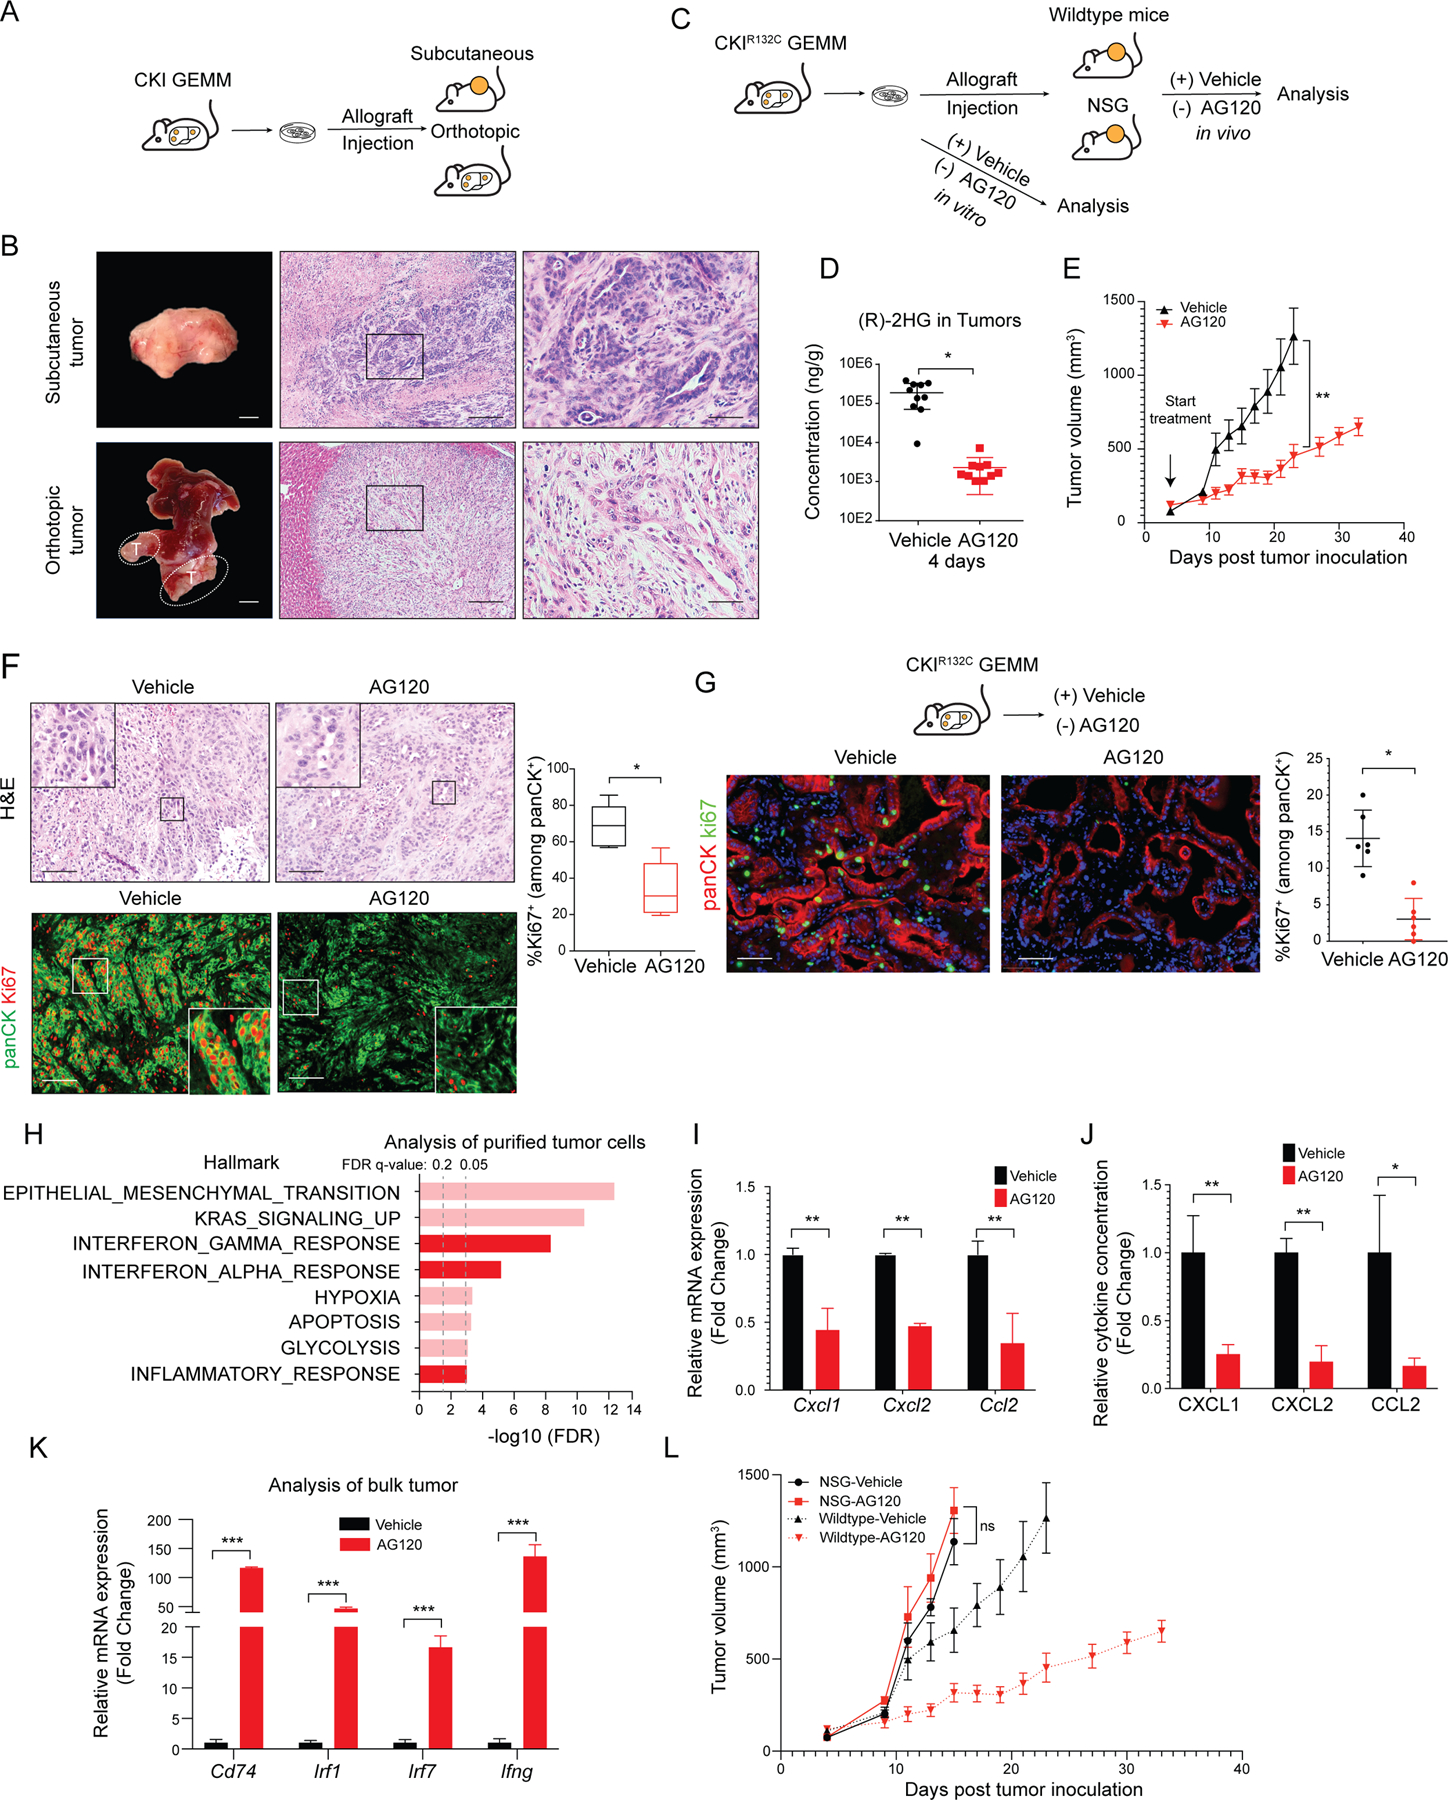
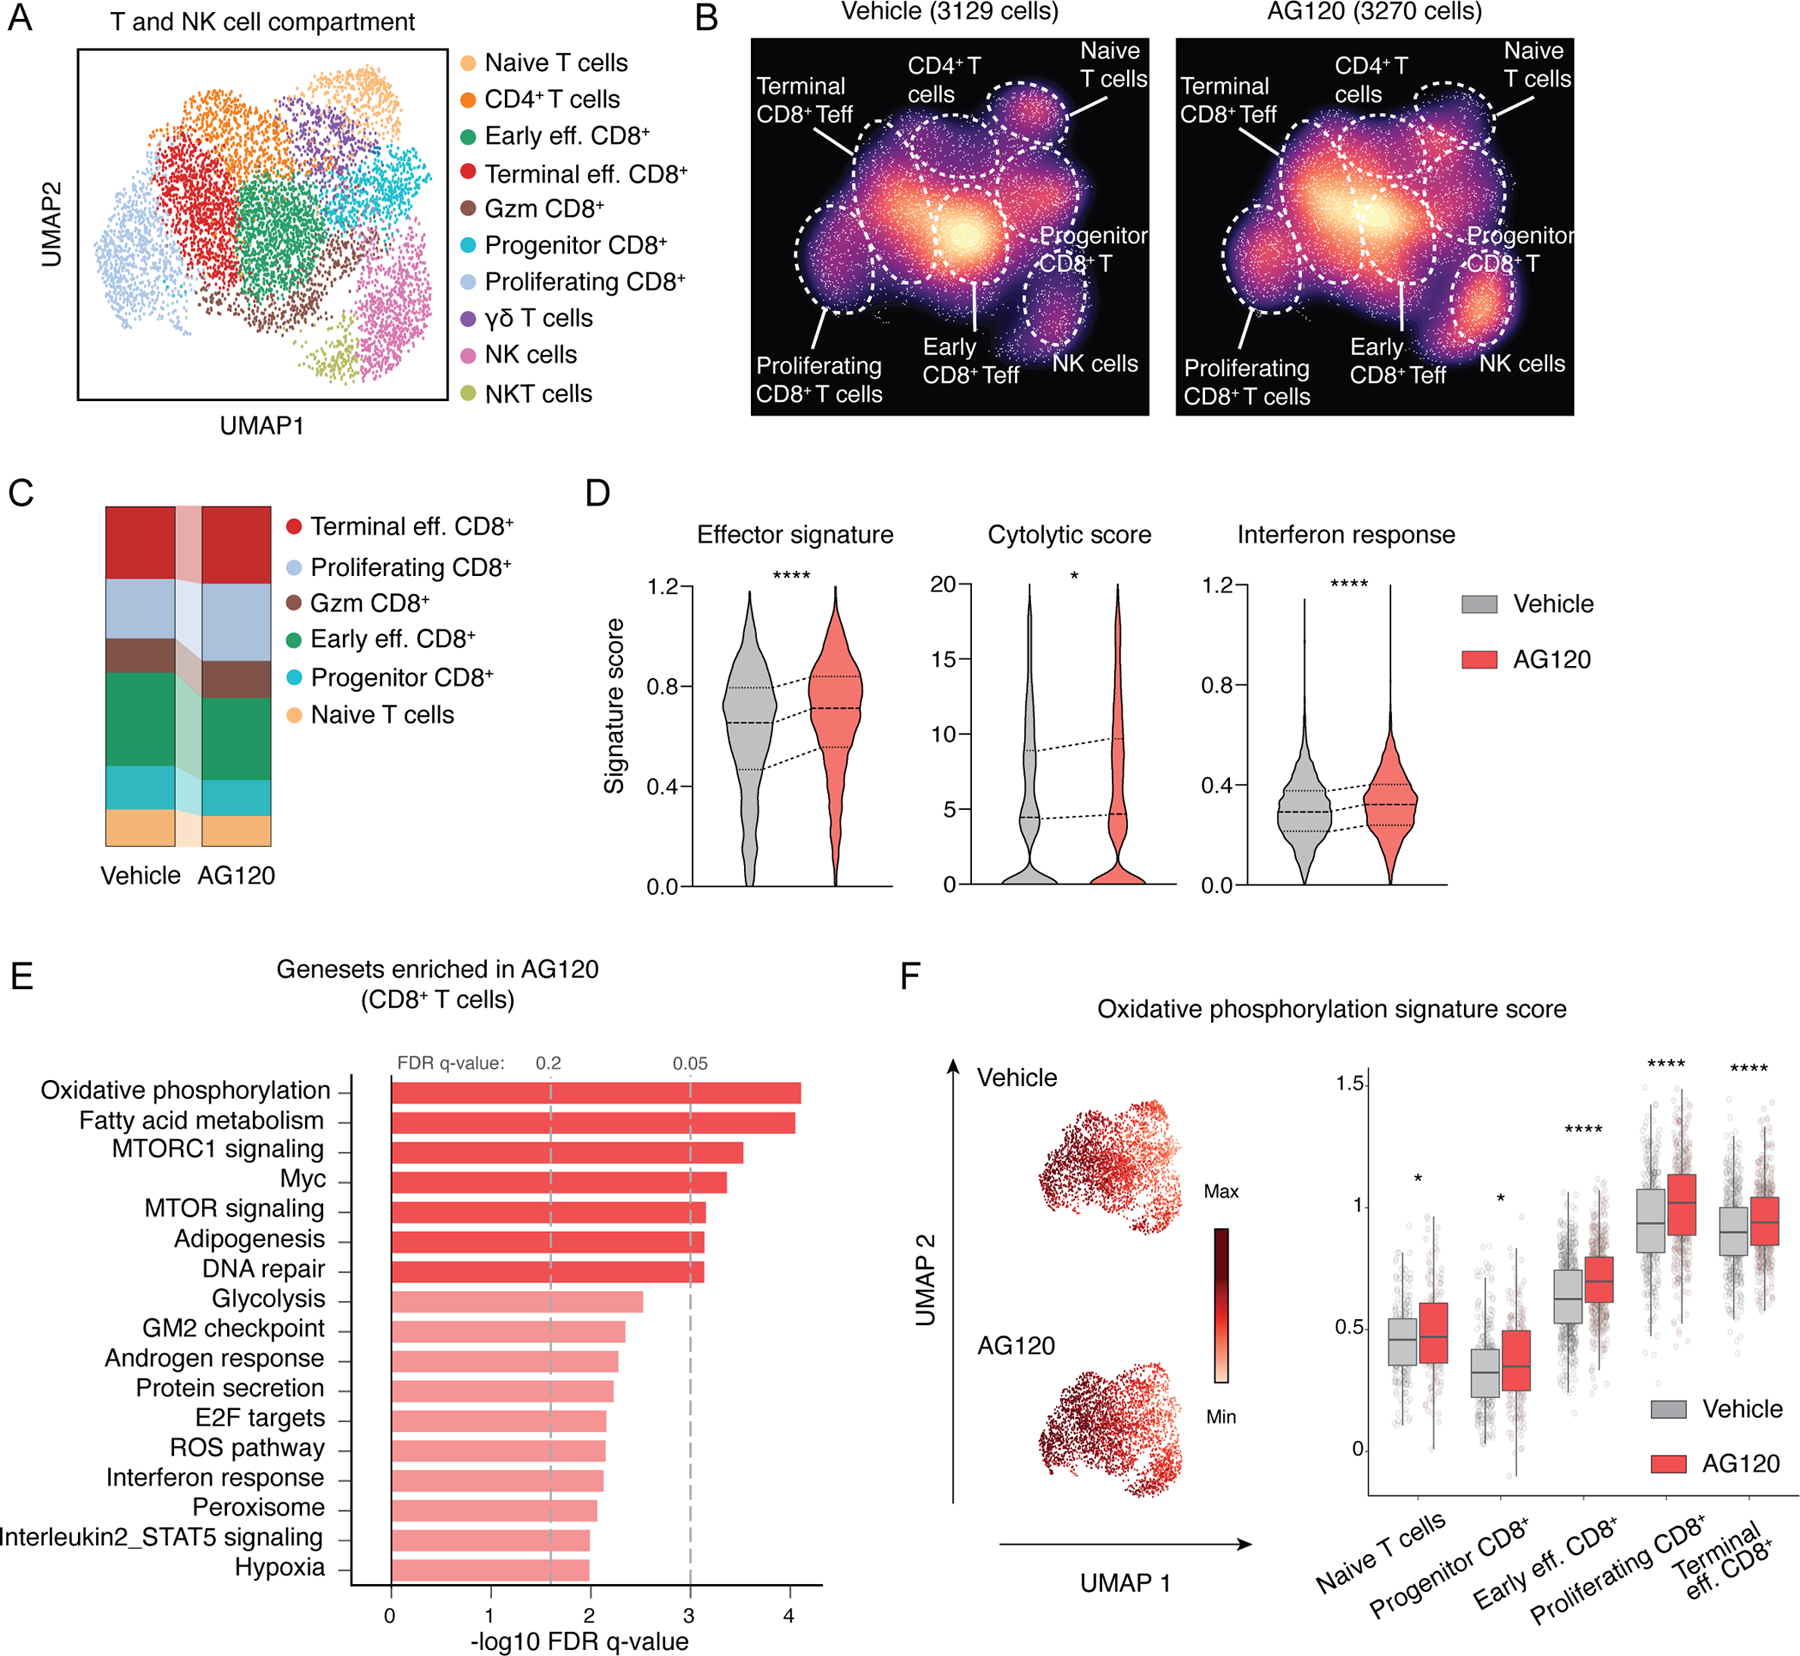
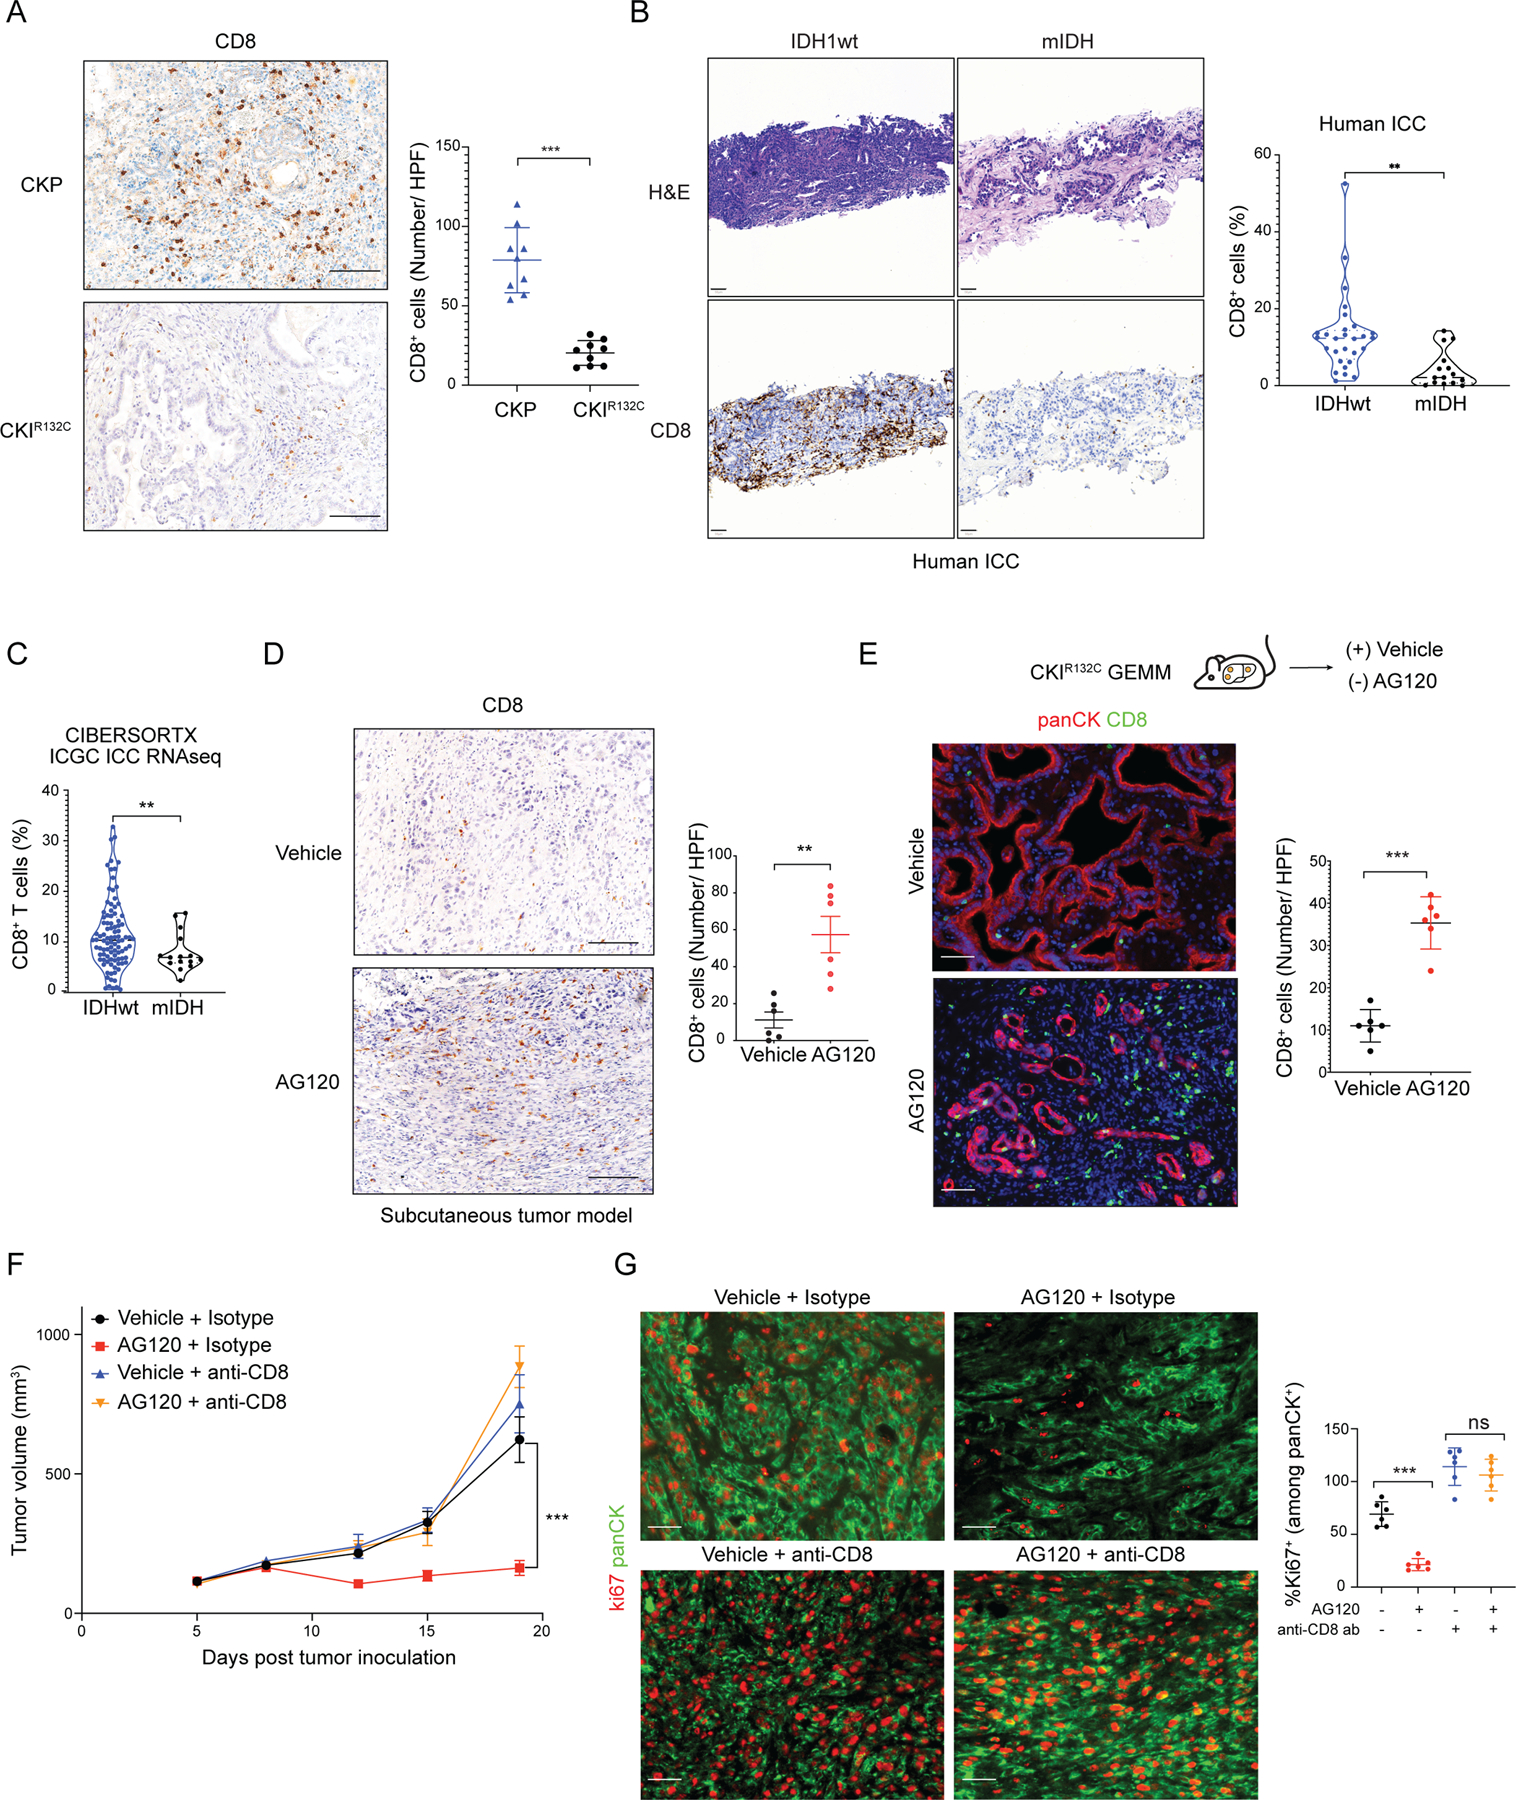
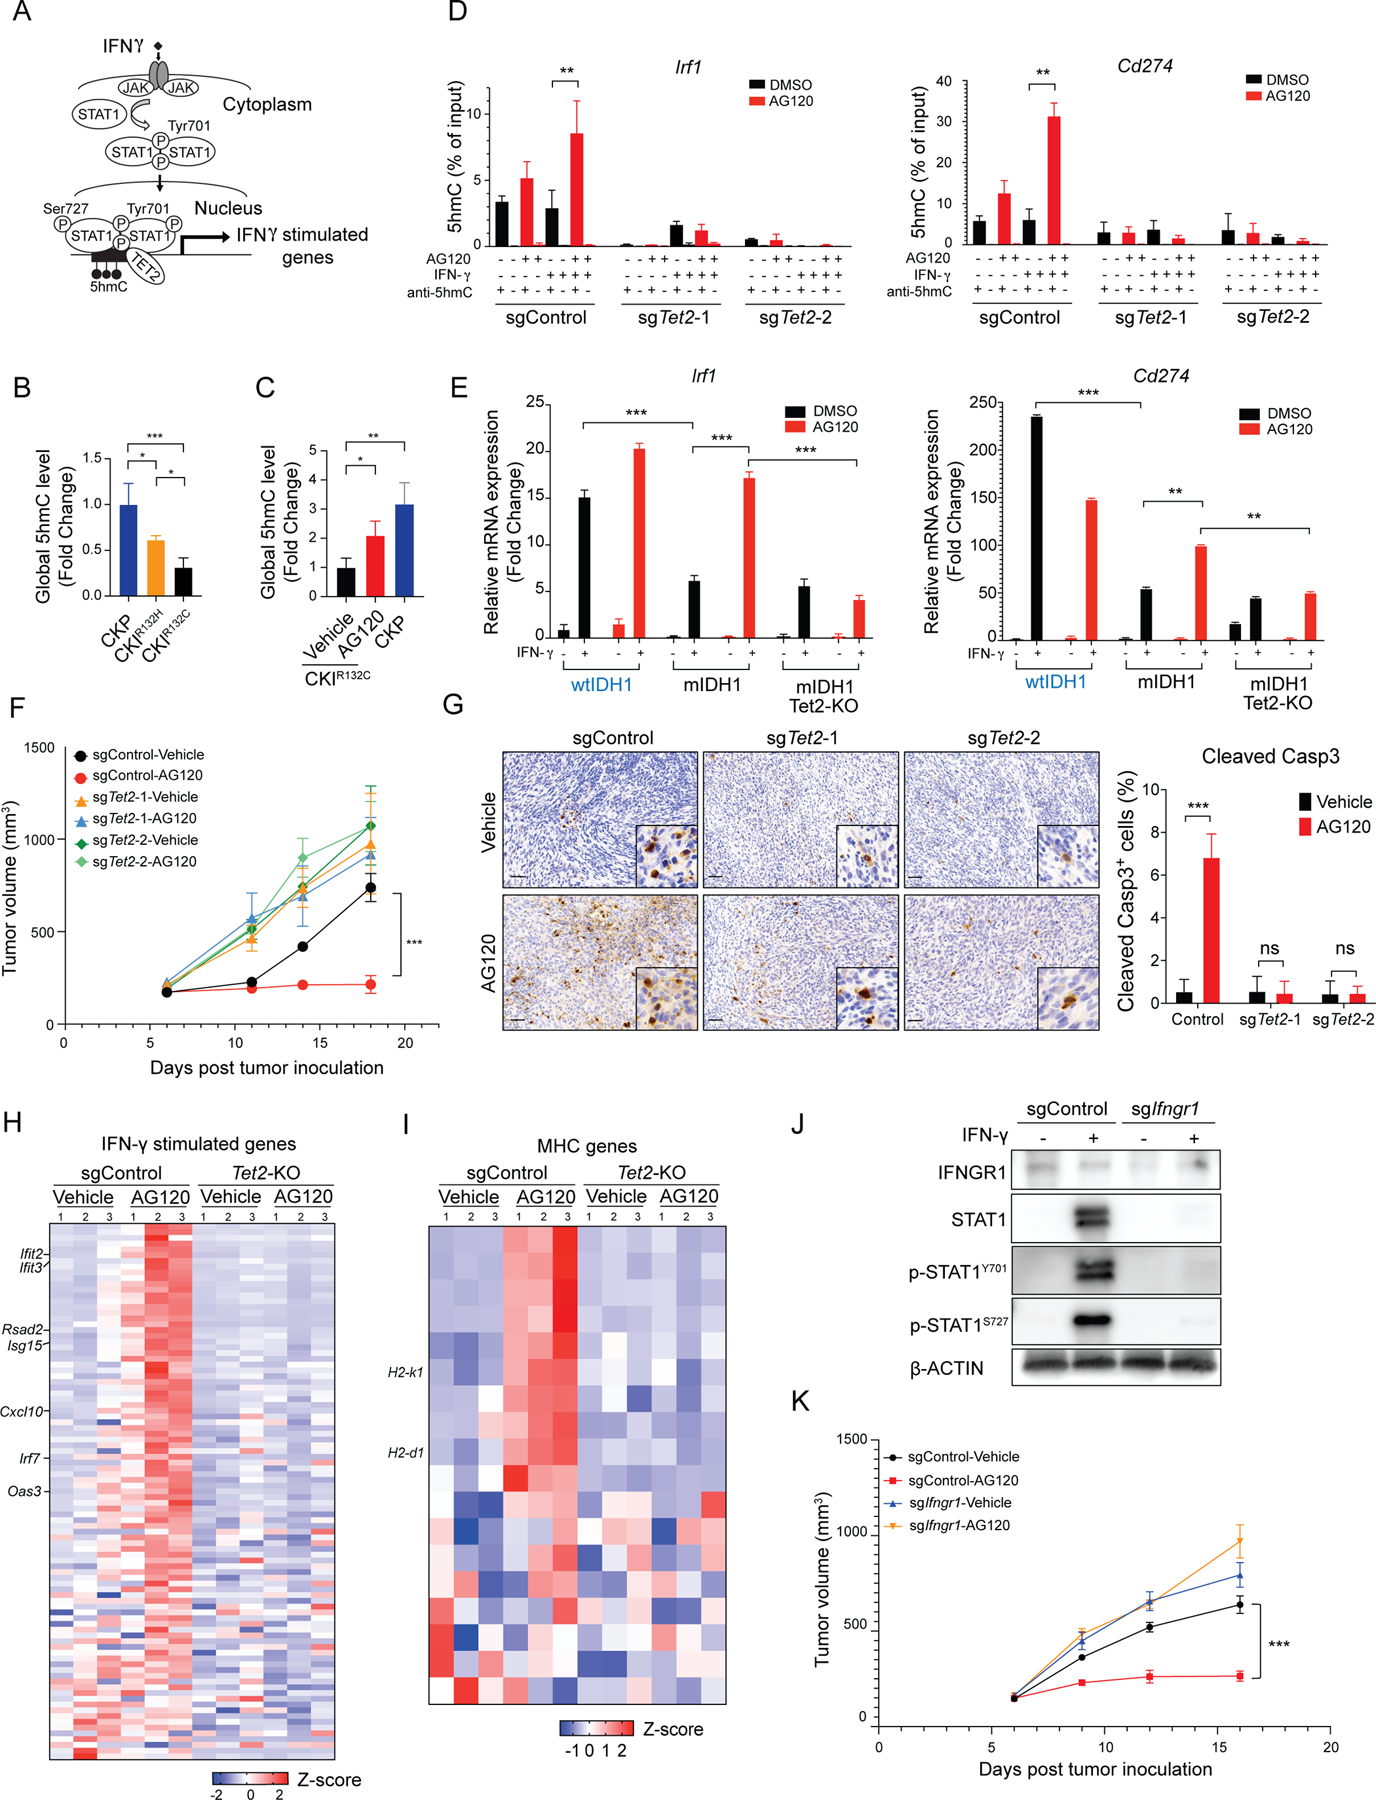
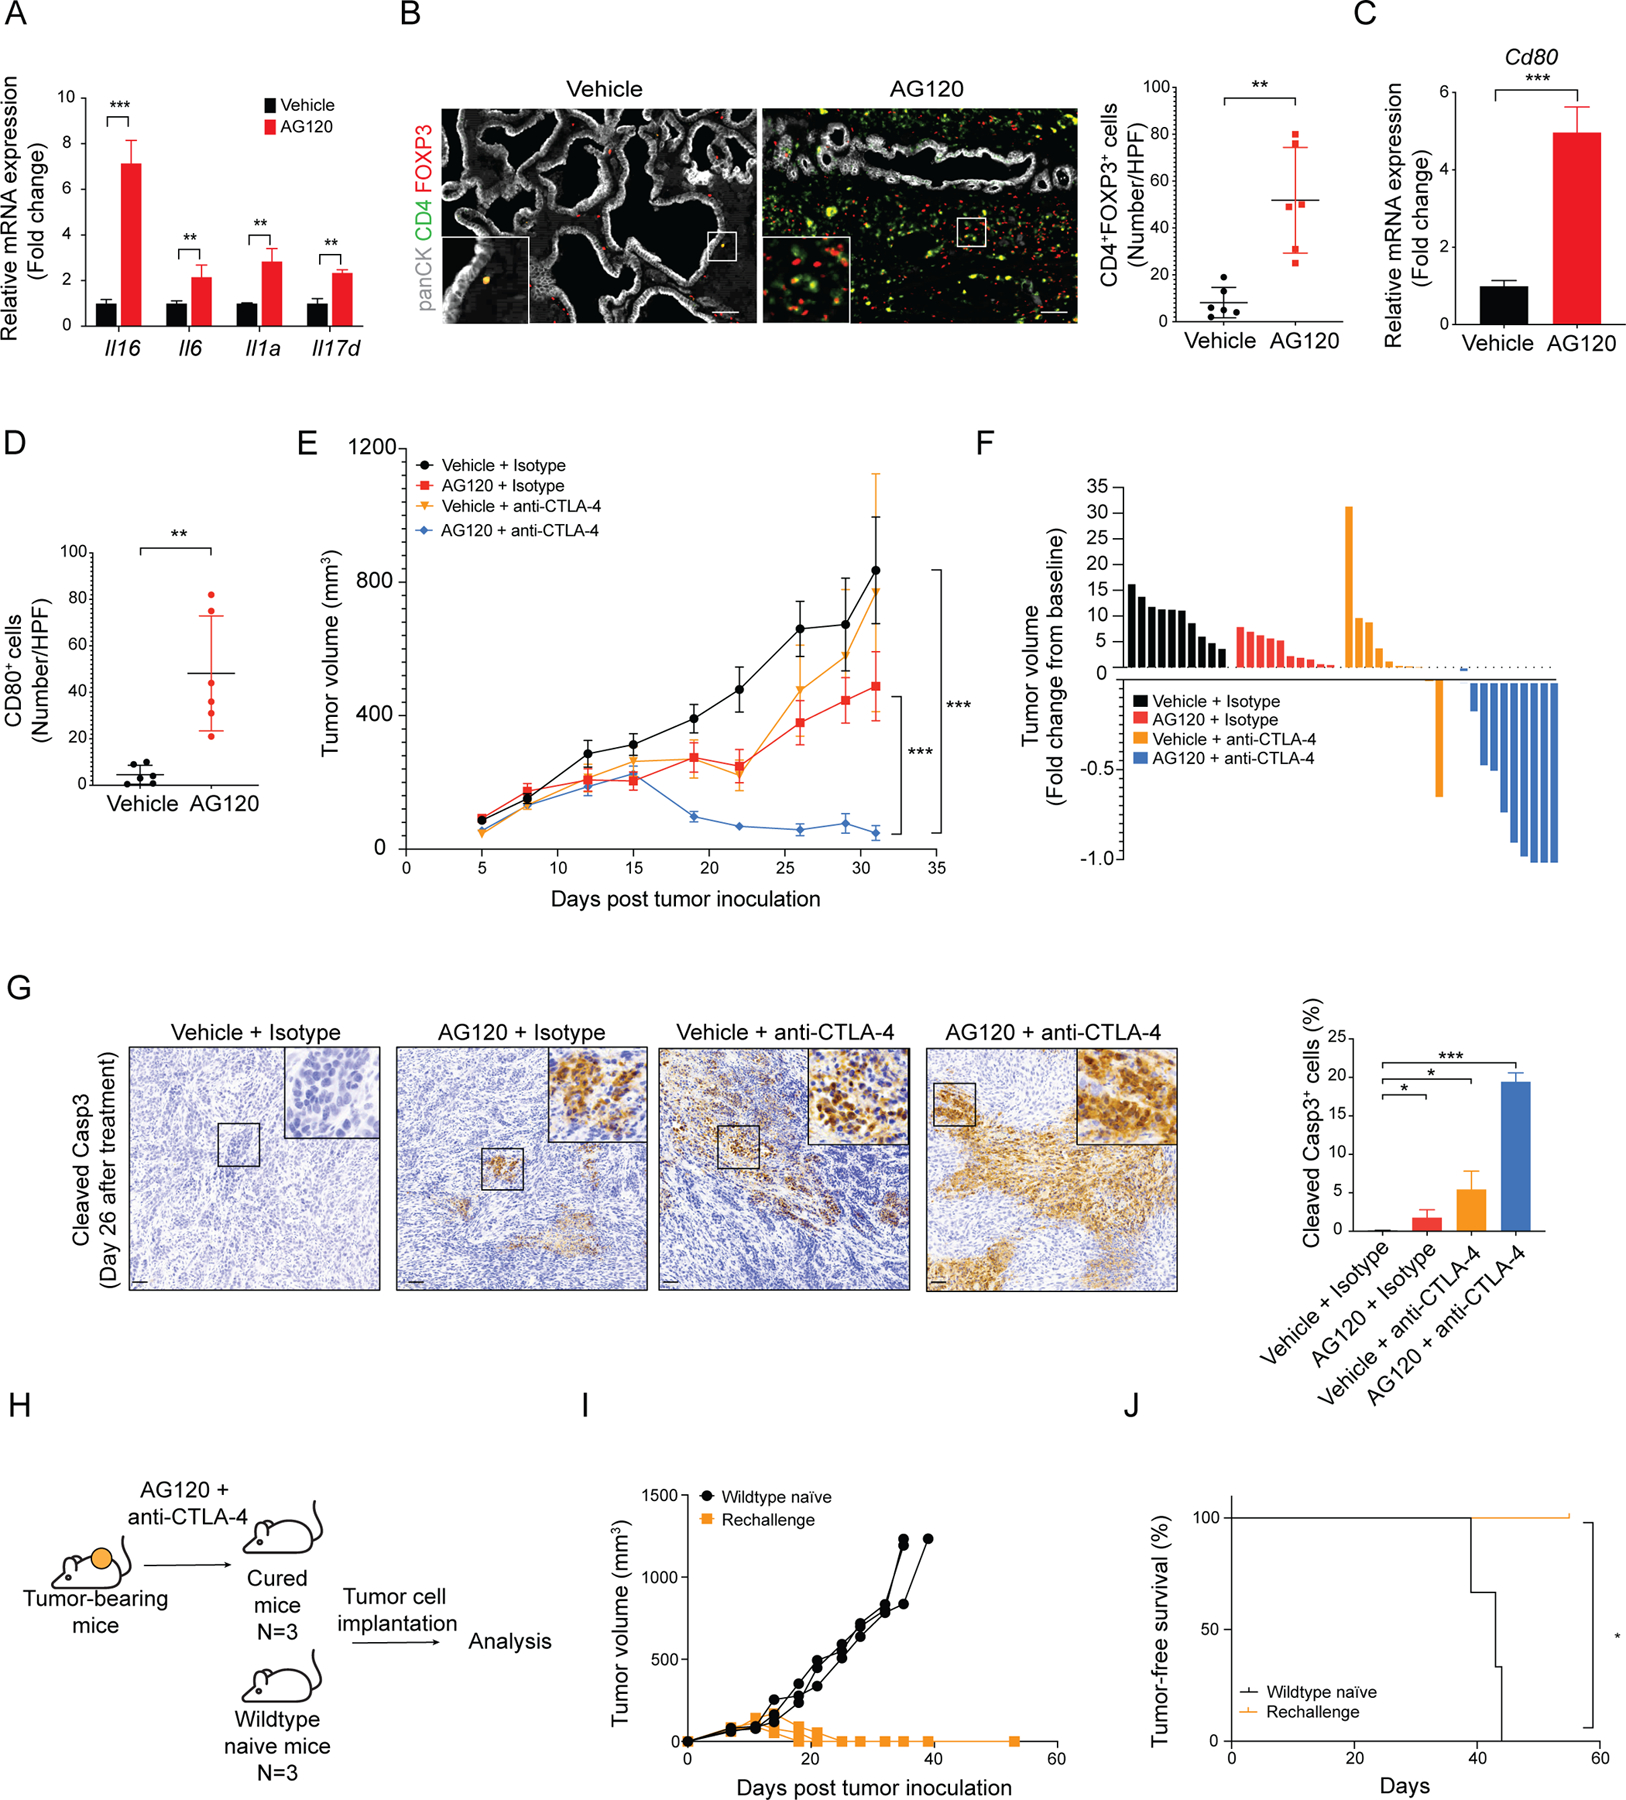
Isocitrate dehydrogenase 1 mutations (mIDH1) are common in cholangiocarcinoma. (R)-2-hydroxyglutarate generated by the mIDH1 enzyme inhibits multiple α-ketoglutarate-dependent enzymes, altering epigenetics and metabolism. Here, by developing mIDH1-driven genetically engineered mouse models, we show that mIDH1 supports cholangiocarcinoma tumor maintenance through an immunoevasion program centered on dual (R)-2-hydroxyglutarate-mediated mechanisms: suppression of CD8+ T-cell activity and tumor cell-autonomous inactivation of TET2 DNA demethylase. Pharmacologic mIDH1 inhibition stimulates CD8+ T-cell recruitment and interferon γ (IFNγ) expression and promotes TET2-dependent induction of IFNγ response genes in tumor cells. CD8+ T-cell depletion or tumor cell-specific ablation of TET2 or IFNγ receptor 1 causes treatment resistance. Whereas immune-checkpoint activation limits mIDH1 inhibitor efficacy, CTLA4 blockade overcomes immunosuppression, providing therapeutic synergy. The findings in this mouse model of cholangiocarcinoma demonstrate that immune function and the IFNγ-TET2 axis are essential for response to mIDH1 inhibition and suggest a novel strategy for potentiating efficacy.

Significance: Mutant IDH1 inhibition stimulates cytotoxic T-cell function and derepression of the DNA demethylating enzyme TET2, which is required for tumor cells to respond to IFNγ. The discovery of mechanisms of treatment efficacy and the identification of synergy by combined CTLA4 blockade provide the foundation for new therapeutic strategies. See related commentary by Zhu and Kwong, p. 604. This article is highlighted in the In This Issue feature, p. 587.


Figures

Figure 1.
Figure 1.. Development of an IDH1-R132C-driven GEMM of ICC
(A) Relative frequency of IDH1 mutant variants in human ICC and glioma (data obtained from AACR Project GENIE). (B) Schematic of mouse strains. (C) Concentration of (R)-2HG in livers from mice with the indicated genotypes at 11 weeks of age detected by colorimetric (R)-2HG assay kit. C: N=3; CKIR132H: N = 3; CKIR132C: N = 7 (N represents mouse numbers). (D) Kaplan-Meier analysis for time until ICC tumor progression necessitated euthanasia. C: N = 263; CK: N = 125; CKIR132H: N = 18; CKIR132C: N = 108 (N represents mouse numbers). Kaplan-Meier curves were analyzed by log-rank test. ***P < 0.001 was considered statistically significant. (E) Representative photographs depicting livers from 43-week-old mice of the indicated genotypes. (F) Representative gross photographs of metastatic tumors from CKIR132C mice. (G) Representative H&E-stained section of ICC from a CKIR132C mouse (top panels) and a human mIDH1 ICC shown for comparison (lower panels). (H) Tissue sections of ICC and adjacent normal liver from a representative CKIR132C mouse subjected to H&E staining (top panels) and IHC staining against CK19 (lower panels). (I) H&E-stained sections from CKIR132C mice revealing metastatic spread of ICC to the indicated tissues. Lower panels show higher magnification. (J) H&E-stained sections of precursor biliary adenomatous neoplasia (BAN) and oval cell proliferation (OCP) from CKIR132C mice at 35 weeks. The boxed regions in left panel are shown in higher magnification in the right panels. Scale bars: 1 cm (E), 2mm (F), 200 μm (I, upper panels), 100 μm (J, left panel), 50 μm (H; I, bottom panels, 20 μm (J, right panel).
Figure 2.
Figure 2.. mIDH1 inhibition in ICC activates IFN-γ signaling and requires intact immune function for therapeutic efficacy
(A) Schematic of development of CKIR132C allograft tumor model. (B) Representative images of subcutaneous (upper panels) and orthotopic ICC allografts (lower panels). Left: gross photographs; middle: H&E staining. The boxed area is showed at higher magnification at the right. (C) Approach to studying the response to mIDH1 inhibition in vitro and in vivo. (D) LC-MS/MS measurement of relative level of (R)-2HG in ICCs collected 12 hours after the last dose of the 4-day treatment. Data represents mean ± SD. *P < 0.05; unpaired t-test. (E) Immunocompetent wildtype mice were injected subcutaneously with a CKIR132C primary cell line (2205). When tumors reached ~100 mm3 in volume, animals were randomized to receive AG120 or vehicle and then analyzed for serial changes in tumor volume. N = 10 mice per group. Data represent means ± SEM. ***P < 0.001; unpaired t-test. (F) Representative sections of tumors from mice treated with vehicle or AG120 for 7 days. Top panels: H&E staining. Bottom panels: Immunofluorescence for panCK (green), Ki67 (red). IF data are quantified in graph at the right and represent mean ± SD. *P < 0.05. (G) Upper: Schematic of treatment study against autochthonous ICCs arising in the CKIR132C GEM model. Bottom: Immunofluorescence staining for Ki67 (green), panCK (red), and DAPI (blue) in ICCs from CKIR132C mice after 6 days treatment with vehicle or AG120. Data are quantified at the right and represent mean ± SD. *P < 0.05; unpaired t-test. (H) GSEA comparing RNA-sequencing profiles of malignant cells (isolated by magnetic bead-mediated depletion of stromal populations) from subcutaneous allograft tumors from immunocompetent mice treated with AG120 and vehicle for 6 days. The vertical axis represents 8 top ranked pathways in the Hallmark database based on FDR q-values. Interferon and inflammatory pathways are highlighted in dark red. The horizontal axis represents -log10FDR of differentially expressed genes (DEGs) in each Hallmark term. (I) Cxcl1, Cxcl2 and Ccl2 mRNA levels in purified malignant cells from AG120-treated and vehicle-treated tumors. Transcript levels were measured as FPKM values by RNA-seq analysis. Data represents mean ± SD. **P < 0.01; unpaired t-test. (J) Bar graphs showing CXCL1, CXCL2 and CCL2 cytokine levels in the medium from tumor spheroids freshly prepared from CKIR132C allografts and cultured for 3 days in the presence of 1 μM AG120 or vehicle. The cytokine concentrations were measured by Luminex-based multiplex assays. Data represents mean ± SD; **P<0.01, *P<0.05; unpaired t-test. (K) Relative mRNA expression of the indicated genes in vehicle- and AG120-treated bulk (unsorted) tumors. mRNA expression was analyzed by two-step real-time RT-PCR. All data were normalized to Actb then to the geometric mean of vehicle-treated tumors. Data represents mean ± SD; ***P<0.001; unpaired t-test. (L) Immunodeficient mice (NSG mice) were injected subcutaneously with CKIR132C primary cell line. When tumors reached ~100 mm3 in volume, animals were randomized into AG120 (solid red line) and vehicle (solid black line) conditions and analyzed for serial changes in tumor volume. N = 10 mice per group. Data represent mean ± SEM; ns: not significant. Dashed lines are data from (E, above) depicting comparable studies using wildtype mice and shown for comparison. Scale bars: 1 cm (B, bottom left), 2 mm (B, upper left), 200 μm (B, middle panels), 100 μm (F), 50 μm (B, right panels; G).
Figure 3.
Figure 3.. mIDH1 inhibition in ICC promotes CD8+ T cell effector function
(A and B) Identification of tumor-infiltrating T/NK cell populations. Uniform manifold approximation and projection (UMAP) embeddings of single-cell RNA-seq profiles CD45+ leukocyte cells from ICC allografts. Representative of one experiment, N = 4 pooled vehicle-treated mice and N = 4 pooled AG120-treated mice. (C) Proportion of different clusters of CD8+ T cells. (D) Violin plot indicating effector signatures, cytolytic score and interferon response signatures. ****P<0.0001; * P<0.05. (E) GSEA of differentially expressed genes in CD8+ T cells within tumors from mice treated with AG120 and vehicle for 6 days. The vertical axis represents the 17 top ranked pathways in the Hallmark database with the smallest FDR q-values, and the horizontal axis represents -log10FDR q-value of significantly DEGs in each Hallmark terms. (F) Oxidative phosphorylation signature score in different CD8+ T cells populations. ****P<0.0001; * P<0.05.
Figure 4.
Figure 4.. Therapeutic efficacy of mIDH1 inhibition in ICC requires recruitment of tumor-infiltrating CD8+ T cells.
(A) IHC staining for CD8 in ICC from the CKP and CKIR132C GEM models; right: quantification. N = 9 mice/group. Data represents mean ± SD; ***P<0.001; unpaired t-test. (B) H&E staining (upper panels) and IHC staining for CD8 (bottom panels) of primary human ICCs with either IDH wildtype (IDHwt) or IDH mutant genotypes; right: quantification. Data represents mean ± SD; **P<0.01; unpaired t-test). (C) CIBERSORTX analysis of CD8+ T cells in IDHwt (N = 95) and mIDH (N = 15) ICC in the ICGC expression data set. Total N = 110 biologically independent samples. **P<0.01; unpaired t-test. (D) IHC staining for CD8 in CKIR132C subcutaneous allograft ICCs after 6 days treatment with vehicle or AG120; right: quantification. Data represents mean ± SD; **P<0.01; unpaired t-test. (E) Study of CD8+ T cell infiltrate in ICCs arising autochthonously in the CKIR132C GEM model after 6 days treatment with vehicle or AG120. Lower: fluorescence-stained sections; green: CD8, red: panCK, blue: DAPI; right: quantification. Data represents mean ± SD; ***P<0.001; unpaired t-test. (F, G) Immunocompetent wildtype mice were injected subcutaneously with a CKIR132C primary ICC cell line. Mice were randomized into two groups and injected with anti-CD8 antibody or isotype control three days before tumor cell inoculation. When tumors reached ~100 mm3 in volume, animals in each group were randomized into AG120 and vehicle conditions. (F) Analysis of serial changes in tumor volume. N = 6 mice per group. Data represent means ± SEM; ***P<0.001; unpaired t-test. (G) Representative fluorescence-stained sections of tumors following 14 days treatment with vehicle or AG120; green: panCK, red: Ki67; right: quantification. Data represents mean ± SD. ***P < 0.001, ns: not significant; unpaired t-test. Scale bars: 100 μm (A; D), 50 μm (B; D; E; G).
Figure 5.
Figure 5.. Restoration of the TET2-mediated anti-tumor immunity is required for mIDH inhibitor efficacy
(A) Schematic of IFN-γ- TET2 signaling. (B and C) Global levels of 5hmC (measured by ELISA) relative to total input DNA in ICCs from (B) the CKP, CKIR132H and CKIR132C models, and (C) CKIR132C ICC allografts treated with vehicle or AG120 versus CKP control. Data represent mean ± SD. N=3 tumor per group. *P < 0.05, **P<0.01, ***P<0.001; unpaired t-test. (D) hMeDIP assays with anti-5hmC or IgG antibody were performed in the indicated CRISPR-engineered derivatives of CKIR132C ICC cells grown ± IFN-γ and ± AG120 in vitro. 5hmC levels on the Irf1and Cd274 promoters were determined by two-step real-time RT-PCR. Data represent mean ± SD for triplicate experiments. (E) Relative mRNA expression of Irf1 and Cd274 in the indicated CRISPR-engineered derivatives (wtIDH1 and mIDH1-sgControl and mIDH1-sgTet2–2) of CKIR132C ICC cells grown ± IFN-γ and ± AG120 in vitro. mRNA expression was analyzed by two-step real-time RT-PCR. All data were normalized to Actb then to geometric mean of the vehicle-treated condition. Data represents mean ± SD. In the in vitro experiments above, AG120 treatment was for three days and IFN-γ treatment was for 24 hours. (F-I) Immunocompetent wildtype mice were injected subcutaneously with the indicated derivatives of CKIR132C ICC cells. When tumors reached ~100 mm3 in volume, animals were randomized into vehicle and AG120 groups. (F) Analysis of serial changes in tumor volume. N = 6 mice per group. Data represent means ± SEM. ***P < 0.001; unpaired t-test. (G) IHC staining for cleaved Caspase 3 at 15 days of treatment; right: quantification. Data represents mean ± SD; ***P<0.001; *P<0.05; unpaired t-test. Heatmap of relative expression of an annotated panel of (H) IFN-γ-stimulated genes (I) murine MHC genes in magnetic bead-sorted tumor cells from the indicated allograft models treated with AG120 or vehicle for 5 days. The analysis used the nCounter PanCancer Mouse Immune Profiling gene expression platform (NanoString Technologies). (J and K) CKIR132C ICC cells were CRISPR-engineered with control sgRNA and sgIfngr1. (J) Detection of IFNGR1, STAT1, p-STAT1Y701, p-STAT1S727 protein by immunoblot. β-ACTIN serves as an internal loading control. (K) Immunocompetent wildtype mice were injected subcutaneously with the indicated derivatives of CKIR132C ICC cells. When tumors reached ~100 mm3 in volume, animals were randomized into vehicle and AG120 groups. Analysis of serial changes in tumor volume. N = 6 mice per group. Data represent means ± SEM. ***P < 0.001; unpaired t-test. Scale bar: 100 μm (G).
Figure 6
Figure 6. mIDH inhibition stimulates immune checkpoints and Treg recruitment and synergizes with anti-CTLA4 antibody treatment
(A) Levels of Il16, Il6, Il1a and Il17d mRNA in purified ICC cells from AG120-treated and vehicle-treated CKIR132C allograft tumors. Transcript levels were measured as FPKM values by RNA-seq analysis. Data represents mean ± SD. **P < 0.01, ***P<0.001; unpaired t-test. (B) Representative fluorescence-stained sections of ICCs arising in the CKIR132C GEM model upon treatment with vehicle or AG120 for 6 days; green: panCK, red: FOXP3, magenta: CD4; right: quantification. Data represents mean ± SD. *P < 0.05; unpaired t-test. (C) Relative mRNA expression of Cd80 in vehicle- and AG120-treated bulk tumors by two-step real-time RT-PCR. All data were normalized to Actb then to geometric mean of vehicle-treated tumors. Data represents mean ± SD; ***P<0.001; unpaired t-test. (D) Quantification of IHC stained sections for CD80 in tumors from vehicle-treated mice and AG120-treated mice. Data represents mean ± SD; **P<0.01; unpaired t-test. (E, F) Immunocompetent wildtype mice were injected subcutaneously with CKIR132C ICC cells. When tumors reached ~100 mm3 in volume, animals were randomized into vehicle + isotype antibody, AG120 + isotype, vehicle + anti-CTLA-4 antibody, and AG120 + anti-CTLA-4 antibody groups. (E) Analysis of serial changes in tumor volume. N = 10 mice per group. Data represent means ± SEM. ***P < 0.001; unpaired t-test. (F) Waterfall plot of the maximum percentage change in tumor volume from baseline at day 32 after tumor inoculation (26 days treatment) in each group. (G) IHC staining for cleaved Caspase 3 in ICC allografts from mice in the indicated treatment groups; right: quantification. Data represents mean ± SD; ***P<0.001; *P<0.05; unpaired t-test. (H) Approach to studying whether combination treatment elicited durable immune memory. (I) Tumor-naïve immunocompetent wildtype mice and mice cured by the AG120 + anti-CTLA4 therapy 125 days after primary challenge were injected subcutaneously with CKIR132C primary ICC cells and analyzed for serial changes in tumor volume. N = 3 mice per group. (J) Kaplan-Meier analysis for time until tumor progression necessitated euthanasia (N=3; N represents mouse numbers). Kaplan-Meier curves were analyzed by log-rank test. *P < 0.05 was considered statistically significant. Scale bars: 100 μm (B), 50 μm (G).

Comment in

Similar articles

Cited by

References

    1. Borger DR, Tanabe KK, Fan KC, Lopez HU, Fantin VR, Straley KS, et al. Frequent Mutation of Isocitrate Dehydrogenase (IDH)1 and IDH2 in Cholangiocarcinoma Identified Through Broad-Based Tumor Genotyping. Oncol. 2012;17:72–9. - PMC - PubMed
    1. Waitkus MS, Diplas BH, Yan H. Biological Role and Therapeutic Potential of IDH Mutations in Cancer. Cancer Cell. 2018;34:186–95. - PMC - PubMed
    1. Ye D, Guan K-L, Xiong Y. Metabolism, Activity, and Targeting of D- and L-2-Hydroxyglutarates. Trends in Cancer. 2018;4(2):151–165. - PMC - PubMed
    1. Lowery MA, Ptashkin RN, Jordan EJ, Berger MF, Zehir A, Capanu M, et al. Comprehensive molecular profiling of intra- and extrahepatic cholangiocarcinomas: potential targets for intervention. Clin Cancer Res. 2018;24:clincanres.0078.2018. - PMC - PubMed
    1. Ward PS, Patel J, Wise DR, Abdel-Wahab O, Bennett BD, Coller HA, et al. The Common Feature of Leukemia-Associated IDH1 and IDH2 Mutations Is a Neomorphic Enzyme Activity Converting α-Ketoglutarate to 2-Hydroxyglutarate. Cancer Cell. 2010;17:225–34. - PMC - PubMed

Publication types