. 2021 Dec 1;6(1):401.
doi: 10.1038/s41392-021-00790-2.

Fis1 phosphorylation by Met promotes mitochondrial fission and hepatocellular carcinoma metastasis

Affiliations

Fis1 phosphorylation by Met promotes mitochondrial fission and hepatocellular carcinoma metastasis

Yan Yu et al. Signal Transduct Target Ther. .

Abstract

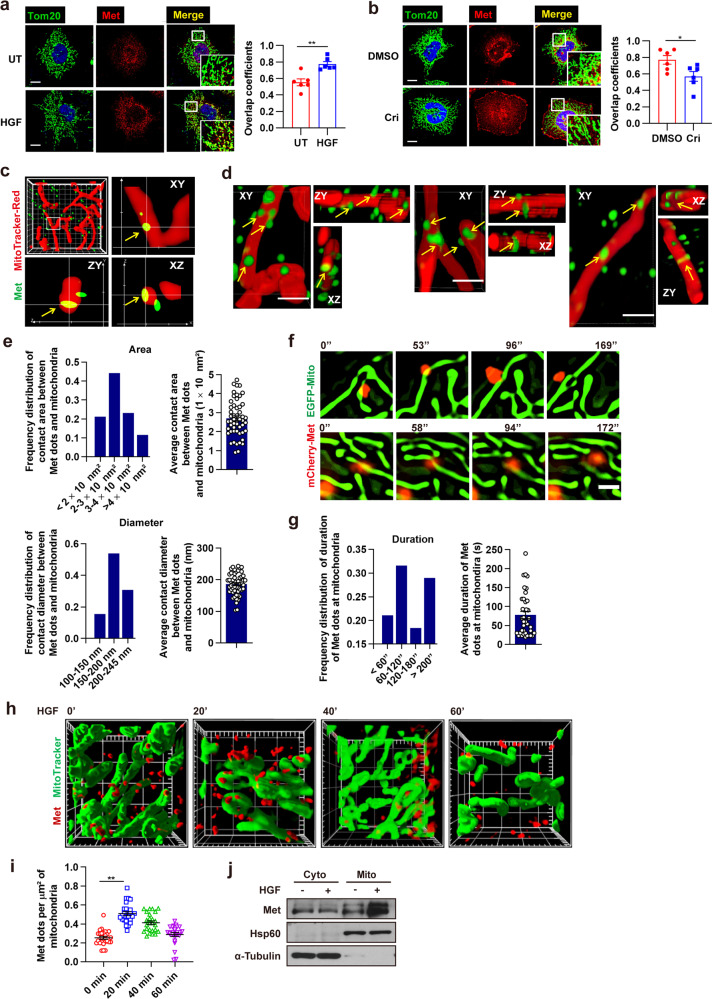
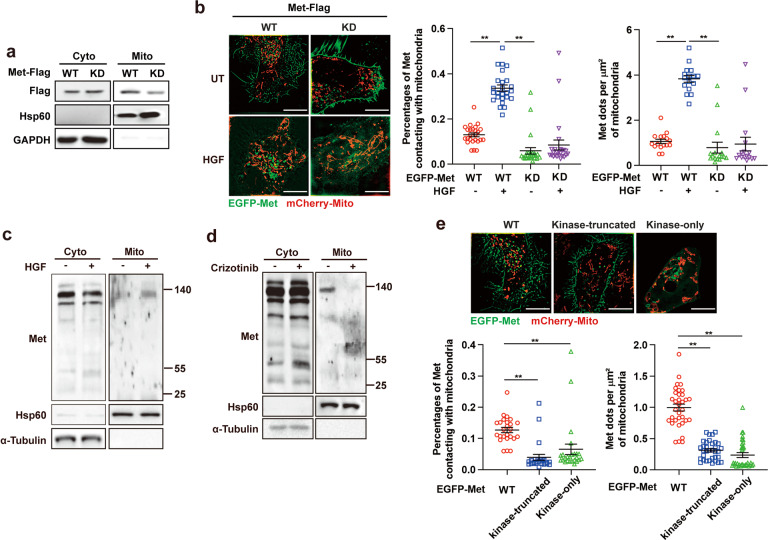
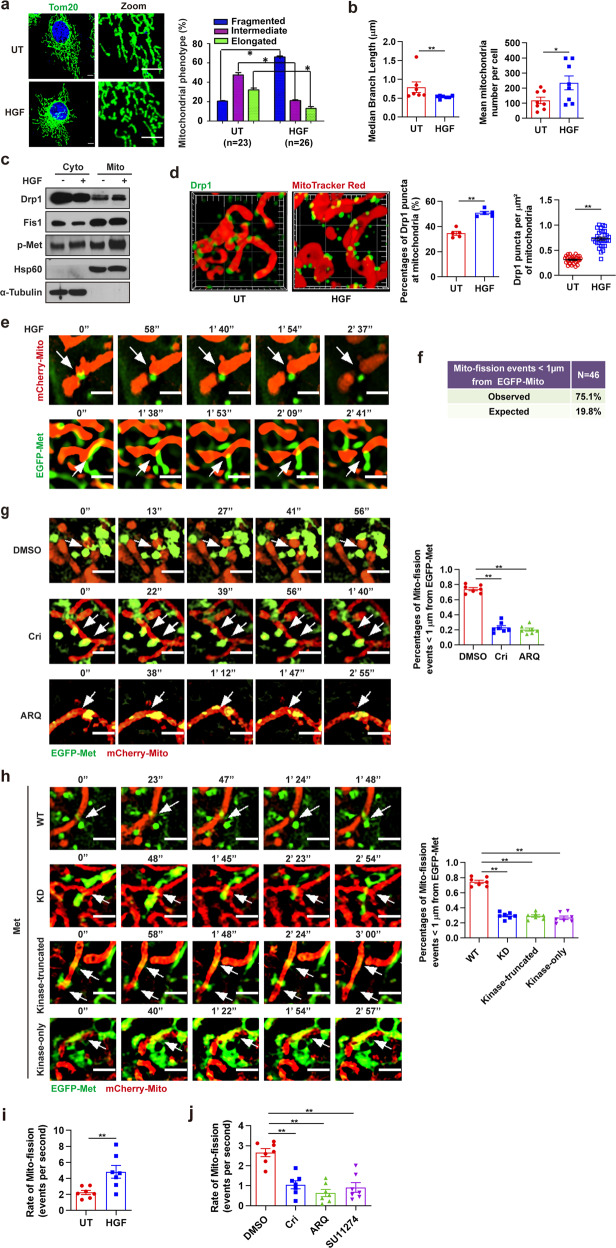
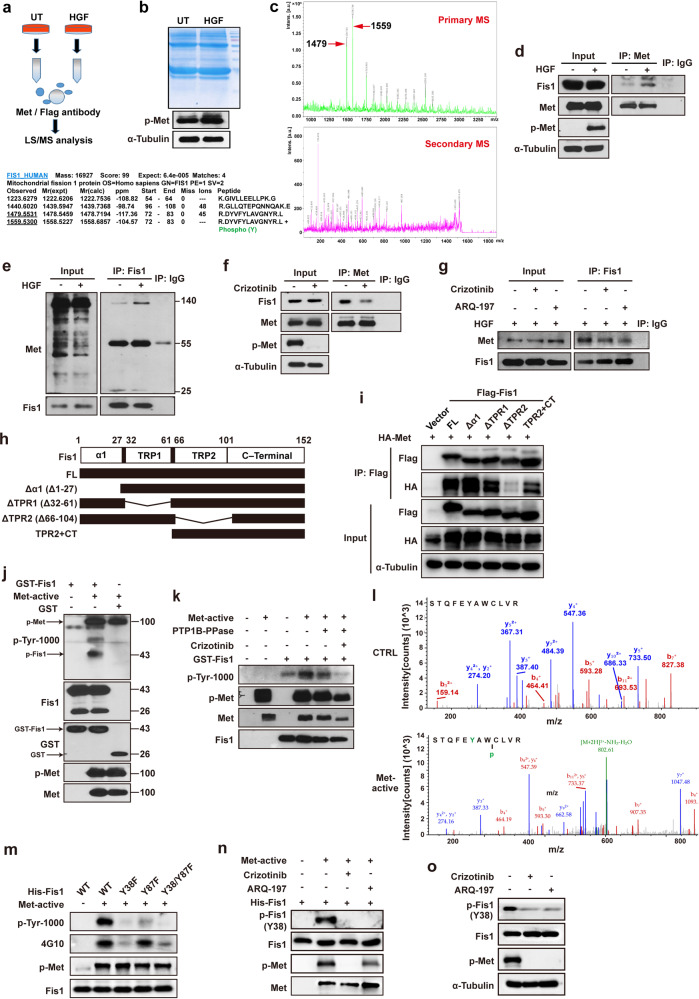
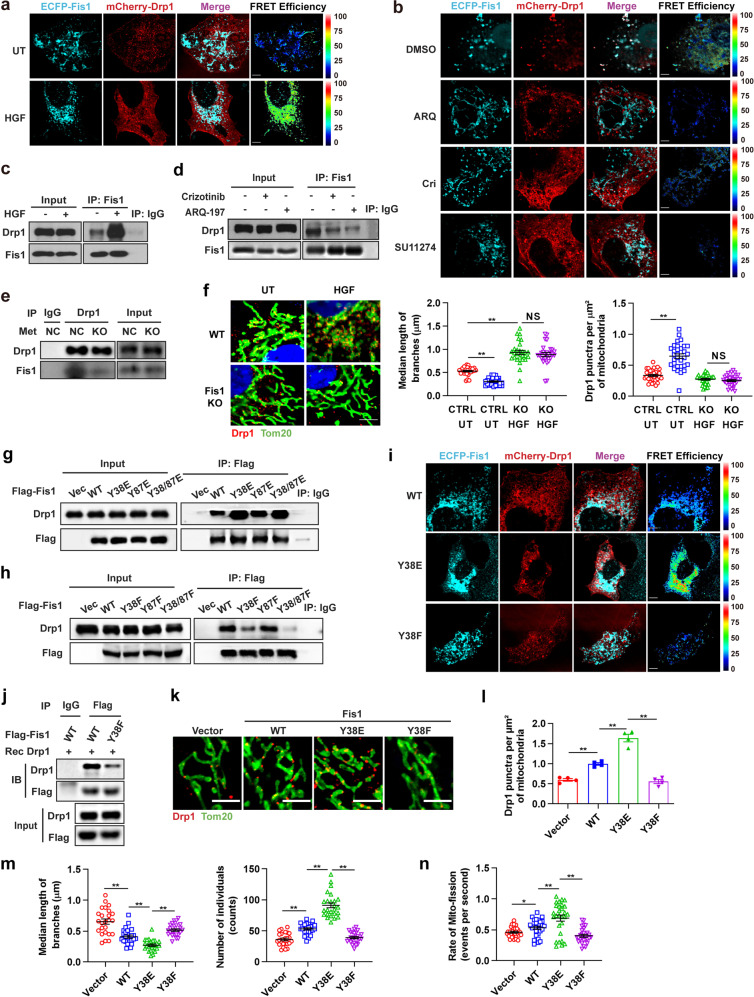
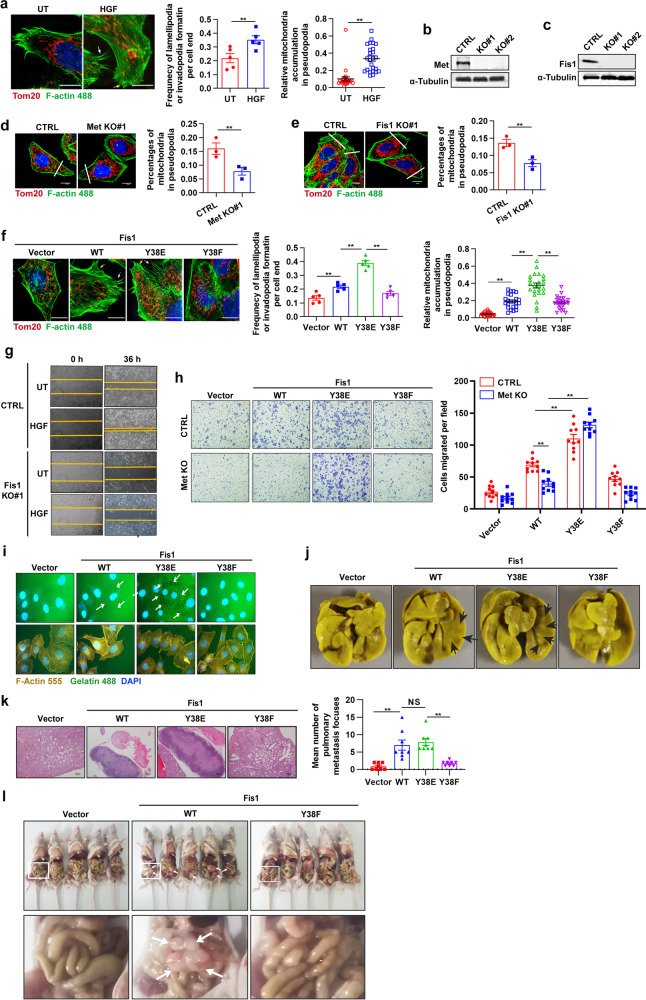
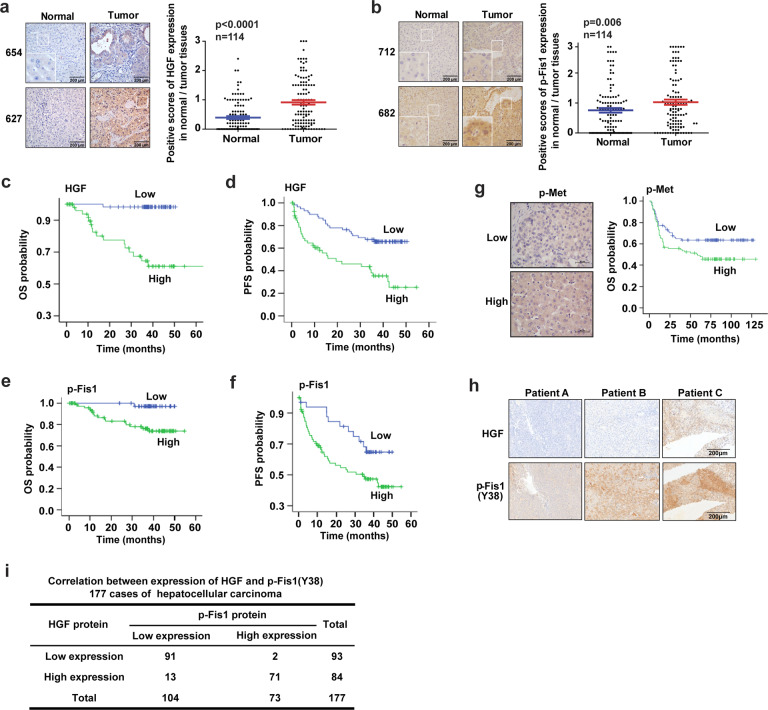
Met tyrosine kinase, a receptor for a hepatocyte growth factor (HGF), plays a critical role in tumor growth, metastasis, and drug resistance. Mitochondria are highly dynamic and undergo fission and fusion to maintain a functional mitochondrial network. Dysregulated mitochondrial dynamics are responsible for the progression and metastasis of many cancers. Here, using structured illumination microscopy (SIM) and high spatial and temporal resolution live cell imaging, we identified mitochondrial trafficking of receptor tyrosine kinase Met. The contacts between activated Met kinase and mitochondria formed dramatically, and an intact HGF/Met axis was necessary for dysregulated mitochondrial fission and cancer cell movements. Mechanically, we found that Met directly phosphorylated outer mitochondrial membrane protein Fis1 at Tyr38 (Fis1 pY38). Fis1 pY38 promoted mitochondrial fission by recruiting the mitochondrial fission GTPase dynamin-related protein-1 (Drp1) to mitochondria. Fragmented mitochondria fueled actin filament remodeling and lamellipodia or invadopodia formation to facilitate cell metastasis in hepatocellular carcinoma (HCC) cells both in vitro and in vivo. These findings reveal a novel and noncanonical pathway of Met receptor tyrosine kinase in the regulation of mitochondrial activities, which may provide a therapeutic target for metastatic HCC.


Conflict of interest statement

Jiao Ji is one of the employees of Ascentage Pharma Group Inc. The remaining authors declare no competing interests.

Figures

Fig. 1
Fig. 1
HGF stimulates mitochondrial location of Met. a, b Huh7 cells were treated with HGF (100 ng/ml, 20 min) (a) or crizotinib (1 µM, 1 h) (b) and immunofluorescent stained for Met and Tom20, a mitochondrial marker. Images were captured by a confocal microscope. The zoomed images show Met colocalization with mitochondria. Scale bars, 100 µm. Histogram reporting Mander’s overlap coefficients relative to Met colocalization with mitochondria. Error bars represent means ± SEM (n = 6 cells, *p < 0.05, **p < 0.01; Student’s t test). c, d Representative 3D SIM images of mitochondrial localization of Met (yellow arrows) in Huh7 cells immunofluorescent stained for Met and mitochondria, showing the cross-section profiles (c) and three fields of surface profiles (d). Images in (c) were captured in Z-stacks showing contacts extending more than 200 nm in the Z-plane (frame, 10 µm × 10 µm; main calibration, 1 µm). Scale bars of (d), 1 µm. e Quantification of area (upper) and diameter (lower) of the contacting region between Met dots and mitochondria according to (c) and (d). Error bars represent means ± SEM (n = 52 contacts). f Time-lapse SIM live-cell imaging of mitochondrial localization of Met in HeLa cells stably expressing mCherry–Met and EGFP–Mito. Two fields were captured. Scale bars, 1 µm. g Quantification of contact duration of Met and mitochondria according to (f). Error bars represent means ± SEM (n = 38 contacts). h Representative 3D SIM images of mitochondrial localization of Met in Huh7 cells treated with HGF (100 ng/ml) for the indicated time. Cells were immunofluorescent stained for Met and mitochondria (frame, 10 µm × 10 µm; main calibration, 1 µm). i Quantification of Met docking at mitochondria at indicated time points according to (h). Error bars represent means ± SEM (n = 25 fields, **p < 0.01; Student’s t test). j Immunoblot analysis of Met in mitochondrial and cytosolic fractions of Huh7 cells after treated with HGF (100 ng/ml, 20 min). Mitochondria isolation markers, α-Tubulin (cytoplasmic) and Hsp60 (mitochondria) were used as controls
Fig. 2
Fig. 2
Kinase activity is required for mitochondrial trafficking of Met. a Immunoblot analysis of Flag-Met in mitochondrial and cytosolic fractions of Met-/ Huh7 cells stably transfected with WT Flag-Met and KD Flag-Met. Mitochondria isolation markers, GAPDH (cytoplasmic) and Hsp60 (mitochondria) were used as controls. b Met/ HeLa cells stably expressing WT or KD EGFP–Met and mCherry–Mito were treated with HGF (100 ng/ml, 20 min) or not and then subjected to SIM live-cell imaging. Representative SIM images of mitochondrial localization of Met are shown. Scale bars, 10 µm. Quantification of percentages of Met contacting with mitochondria (n = 25 fields) and the number of Met dots docking at per µm2 of mitochondria (n = 16 fields). Error bars represent means ± SEM (**p < 0.01; Student’s t test). c, d Immunoblot analysis of intact and fragmented Flag-Met in mitochondrial and cytosolic fractions of Huh7 cells treated with HGF (100 ng/ml, 20 min) (c) or crizotinib (1 µM, 1 h) (d). Mitochondria isolation markers, α-Tubulin (cytoplasmic) and Hsp60 (mitochondria) were used as controls. e Representative SIM live-cell imaging of mitochondrial localization of Met in Met−/ HeLa cells stably transfected with WT, kinase-truncated or kinase-only EGFP–Met. Scale bars, 10 µm. Quantification of percentages of Met contacting with mitochondria (n = 25 fields) and the number of Met dots docking at per µm2 of mitochondria (n = 34 fields). Error bars represent means ± SEM (**p < 0.01; Student’s t test)
Fig. 3
Fig. 3
Mitochondrial fission is driven by Met kinase. a Huh7 cells were stimulated with HGF (100 ng/ml, 20 min) or not and then immunofluorescent stained for Met and Tom20. Percentages of cells with indicated mitochondrial morphologies were shown. Scale bars, 5 µm. Error bars represent means ± SEM (n represents the number of cells analyzed, *p < 0.05; Student’s t test). b Quantification of median branch length of individual mitochondria (n = 7 cells) and mean mitochondria number per cell (n = 8 cells) according to (a). Error bars represent means ± SEM (*p < 0.05, **p < 0.01; Student’s t test). c Immunoblot analysis of Drp1 and p-Met (Y1234-5) in mitochondrial and cytosolic fractions of Huh7 cells treated with HGF (100 ng/ml, 20 min). Mitochondria isolation markers, α-Tubulin (cytoplasmic) and Hsp60 (mitochondria) were used as controls. d Huh7 cells stimulated with HGF (100 ng/ml, 20 min) were immunofluorescent stained for Drp1 and mitochondria. Representative 3D SIM images of Drp1 assembly in mitochondria were shown. Images were captured in Z-stacks (frame, 10 µm × 10 µm; main calibration, 1 µm). Quantification of percentages of Drp1 puncta at mitochondria (n = 5 fields) and Drp1 puncta at per µm2 of mitochondria (n = 31 fields). Error bars represent means ± SEM (**p < 0.01; Student’s t test). e Met−/− HeLa cells expressing WT EGFP-Met and mCherry–Mito were treated with HGF (100 ng/ml, 20 min). Representative time-lapse SIM live-cell imaging shows that Met contacts mitochondria at division sites before mitochondrial fission events happen (indicated with white arrows). Scale bars, 1 µm. Two fields were taken. f Quantification of percentages of mitochondrial division events that are marked by Met in HeLa cells transfected with WT EGFP-Met and mCherry–Mito (n = 46 events in 25 cells, p < 0.001, Fisher’s exact test). Quantified from SIM live-cell imaging described in (e). g Time-lapse SIM live-cell imaging shows Met contacts with mitochondria at the sites of mitochondrial division before fission (indicated with white arrows) in Met−/− HeLa cells expressing WT EGFP-Met and mCherry–Mito with crizotinib (1 µM, 1 h) or ARQ-197 (5 µM, 1 h) treatments. Scale bars, 1 µm. Percentages of mitochondrial fission (Mito-fission) events marked by Met are quantified. Error bars represent means ± SEM (**p < 0.01; Student’s t test). Data are representative of seven independent experiments, 46 events per experiment. h Time-lapse N-SIM live-cell imaging of Met contacting mitochondria at the sites of mitochondrial division before fission (indicated with white arrows) in Met−/− HeLa cells expressing WT, KD, kinase-truncated or kinase-only EGFP-Met and mCherry–Mito. Scale bars, 1 µm. Percentages of Mito-fission events marked by Met are quantified. Error bars represent means ± SEM (**p < 0.01; Student’s t test). Data are representative of seven independent experiments, 62 events per experiment. i, j Huh7 cells were treated with HGF (100 ng/ml, 20 min) (i), crizotinib (1 µM, 1 h), ARQ-197 (5 µM, 1 h) or SU11274 (1 µM, 1 h) (j), and then subjected to Live Cell Imaging. Mito-fission rates are quantified. Error bars represent means ± SEM (n = 7 cells, **p < 0.01; Student’s t test)
Fig. 4
Fig. 4
Met interacts with Fis1 and triggers its tyrosine phosphorylation. a The schematic diagram of proteomic analysis of Met co-binding proteins. b The comma blue stain of proteins co-IP with Met or normal IgG antibody. c Fis1 was detected in Met co-binding beads determined by MS analysis. d, e Huh7 cells were stimulated with HGF (100 ng/ml, 20 min) and then applied to IP assay with anti-Met antibody (d) or anti-Fis1 antibody (e). f, g Huh7 cells were treated with crizotinib (1 µM, 1 h) or ARQ-197 (5 µM, 1 h) and then applied to IP assay with anti-Met antibody (f) or anti-Fis1 antibody (g). h Schematic diagram of Fis1 truncations. The deleted regions are represented by lines. i HEK293T cells were transiently co-transfected with the indicated plasmids for 48 h. Cells were lysed and immunoprecipitated with anti-Flag antibody. Co-immunoprecipitated HA-tagged Met was detected by immunoblotting. j Purified GST–Fis1 fusion protein was incubated with recombinant activated Met kinase for 30 min in the kinase buffer with ATP, and then subjected to WB. k Purified GST–Fis1 fusion protein was incubated with activated Met kinase in the presence of crizotinib or protein–tyrosine phosphatase (PTP1B) for 1 h, and the phosphorylation levels of Fis1 were detected with WB. l Purified His–Fis1 fusion protein was incubated with activated Met for 30 min, and then subjected to LC–MS analysis to detect phosphorylated tyrosine sites. m Purified Fis1 (WT), Fis1 (Y38F), Fis1 (Y87F), and Fis1 (Y38/87F) fusion proteins were incubated with activated Met for 30 min. Two kinds of anti-phosphorylation antibodies (p-Tyr-1000 and p-Tyr 4G10) detecting total phosphotyrosine levels were used in WB. n His–Fis1 fusion protein was incubated with Met kinase for 30 min in the presence of crizotinib (1 µM, 1 h) or ARQ-197 (5 µM, 1 h) or not, and the phosphorylation levels of Fis1 were determined with specific Fis1 pY38 antibody. o Huh7 cells were treated with crizotinib (1 µM) or ARQ-197 (5 µM) for 1 h, and the expression levels of p-Fis1 (Y38) was determined with specific Fis1 pY38 antibody
Fig. 5
Fig. 5
Y38 Phosphorylation of Fis1 facilitates Drp1 assembly to mitochondria and promotes mitochondrial fission. a Representative confocal images of HeLa cells expressing FRET pairs (ECFP–Fis1 and mCherry–Drp1) demonstrating preferentially increased SE-FRET signals with the treatment of HGF (100 ng/ml, 20 min). Scale bars, 5 µm. b Representative confocal images of HeLa cells expressing FRET pairs (ECFP–Fis1 and mCherry–Drp1) demonstrating decreased SE-FRET signals with the treatment of crizotinib (1 µM, 1 h), ARQ-197 (5 µM, 1 h) or SU11274 (1 µM, 1 h). Scale bars, 5 µm. c, d Huh7 cells were stimulated with HGF (100 ng/ml, 20 min) (c) or treated with crizotinib (1 µM, 1 h) or ARQ-197 (5 µM, 1 h) (d) and then applied to IP assay with anti-Fis1 antibody. e Met knockout Huh7 cells and their control were applied to IP assay with anti-Drp1 antibody. f Representative confocal images of mitochondrial morphology in WT or Fis1−/− Huh7 cells treated with HGF (100 ng/ml, 20 min) or not. Cells were stained for Tom20 and Drp1. Scale bars, 5 µm. Quantification of branch length of mitochondria (n = 27 cells) and Drp1 puncta docking at mitochondria (n = 31 cells). Error bars represent means ± SEM (*p < 0.05, NS denotes no statistical significance; Student’s t test). g, h Fis1−/− Huh7 cells were transiently transfected with empty vector, WT Fis1-Flag, and indicated Fis1 phosphomimetic mutants (g) or nonphosphorylatable mutants (h) tagged with Flag, and then applied to IP assay with anti-Flag antibody. i Representative confocal images of HeLa cells expressing FRET pairs (mCherry–Drp1 and ECFP–Fis1 WT, ECFP–Fis1 Y38E, or ECFP–Fis1 Y38F) demonstrating corresponding SE-FRET signal. Scale bars, 5 µm. j Western blot detection of the binding between recombinant Drp1 and Fis1 protein in an in vitro pull-down assay. WT or Y38F Fis1 was immunoprecipitated with Flag beads from Huh7 cells. k Representative confocal images of mitochondrial morphology in Fis1−/− Huh7 cells transfected with empty vector, Fis1 WT, Fis1 Y38E mutant, or Fis1 Y38F mutant. Cells were stained for Tom20 and Drp1. Scale bars, 2 µm. l Quantification of Drp1 puncta locating at per µm2 of mitochondria according to (k). Error bars represent means ± SEM (n = 4 cells, **p < 0.01; Student’s t test). m Quantification of branch length of individual mitochondria and mitochondria number per cell according to (k). Error bars represent means ± SEM (n = 25 cells, **p < 0.01; Student’s t test). n Quantification of mito-fission rates of Fis1−/− Huh7 cells expressing empty vector, Fis1 WT, Fis1 Y38E mutant, or Fis1 Y38F mutant through Live Cell Imaging. Error bars represent means ± SEM (n = 28 cells, *p < 0.05, **p < 0.01; Student’s t test)
Fig. 6
Fig. 6
Met-mediated Fis1 Y38 phosphorylation facilitates cell metastasis in vitro and in vivo. a Representative SIM images of lamellipodia (yellow arrows) and invadopodia (white arrows) forming at the leading edge of Huh7 cells treated with HGF (100 ng/ml, 20 min). Mitochondria were stained with anti-Tom20 antibody and F-actin was stained with phalloidine. Scale bars, 10 µm. Quantification of the frequency of lamellipodia and (or) invadopodia formation of each cell end (n = 5 cells) and relative abundance of mitochondria in lamellipodia or invadopodia region (n = 25 cells). Error bars represent means ± SEM (**p < 0.01; Student’s t test). b, c Immunoblot analysis of Met knockout efficacy (b) or Fis1 knockout efficacy (c) in Huh7 cells using CRISPR-Cas9 technology. d, e Representative images of lamellipodia and (or) invadopodia at the leading edge of Met−/− (d) or Fis1−/− (e) Huh7 cells. Quantification of relative abundance of mitochondria in the lamellipodia or invadopodia region. Scale bars, 10 µm. Error bars represent means ± SEM (n = 3 cells, **p < 0.01; Student’s t test). f Representative SIM images of lamellipodia (yellow arrows) and invadopodia (white arrows) forming at the leading edge of Fis1−/− Huh7 cells re-expressed with indicated plasmids. Mitochondria were stained with anti-Tom20 antibody and F-actin was stained with phalloidine. Scale bars, 10 µm. Quantification of the frequency of lamellipodia and (or) invadopodia formation of each cell end (n = 5 cells) and relative abundance of mitochondria in lamellipodia or invadopodia region (n = 23 cells). Error bars represent means ± SEM (**p < 0.01; Student’s t test). g Representative images of wound healing assay in WT or Fis1−/− Huh7 cells stimulated with HGF (100 ng/ml) for indicated time or not, implying the migration ability. h Fis1−/− Huh7 cells with Met knocked out or not were transfected with indicated plasmids. Transwell assay was applied to examine the migration ability of these cells. Quantification of cells migrated per field. Error bars represent means ± SEM (n = 10 fields, **p < 0.01; Student’s t test). i Representative images of cytoskeleton morphology in Fis1−/− huh7 cells transfected with indicated plasmids. Cells were stained with F-actin 555 and incubated in an extracellular matrix substituted with F-488 conjugated gelatin. The white arrows indicate the gelatin degraded by cancer cells (dark spots). j, k Fis1−/− Huh7 cells re-expressed with indicated plasmids were injected to nude mice for 1 × 106/mouse through tail vein, pulmonary metastasis was tested after 28 days. Representative nodules on the pulmonary surface after picric acid staining for 6 h (j). Representative images of lung histological sections with HE staining (k, left). Scale bars, 100 µm. Quantification of the mean number of lung metastases per mice (k, right). Error bars represent means ± SEM (n = 8 mice, **p < 0.01, NS denotes no statistical significance; Student’s t test). l Nude mice were intraperitoneally inoculated with Fis1−/− Huh7 cells re-expressed with indicated plasmids (n = 5 mice) and tumor nodes in the abdominal cavity were observed after 21 days. The white arrows indicate the tumor nodes on the peritoneum. The zoomed images are shown below
Fig. 7
Fig. 7
Clinical relevance of p-Fis1 and HGF in HCC. a, b Representative images of HGF (a) and p-Fis1 (Y38) (b) staining in HCC patient specimens. Scale bars, 200 µm. The HGF or p-Fis1 (Y38) scores are shown. The student’s t test was used for statistical analysis. c, d Kaplan–Meier overall survival (OS) (c) and progression-free survival (PFS) (d) curves for HCC patients according to HGF expression in tumor tissues, the log-rank test was used to determine significance. e, f Kaplan–Meier overall survival (OS) (e) and progression-free survival (PFS) (f) curves for HCC patients according to p-Fis1 (Y38) expression in tumor tissues, the log-rank test was used to determine significance. g Representative images of p-Met staining in HCC patient specimens (upper). Scale bars, 50 µm. Kaplan–Meier overall survival (OS) for HCC patients according to p-Met expression in tumor tissues, the log-rank test was used to determine significance (lower). h, i Representative images of HGF and p-Fis1 (Y38) staining in HCC patient specimens (h). The Spearman correlation test or Cox regression analysis was used to validating the correlation between HGF and p-Fis1 (Y38), p value was caculated (i)

References

    1. Llovet JM, et al. Hepatocellular carcinoma. Nat. Rev. Dis. Prim. 2016;2:16018. - PubMed
    1. Osada S, Kanematsu M, Imai H, Goshima S. Clinical significance of serum HGF and c-Met expression in tumor tissue for evaluation of properties and treatment of hepatocellular carcinoma. Hepatogastroenterology. 2008;55:544–549. - PubMed
    1. Ke AW, et al. Role of overexpression of CD151 and/or c-Met in predicting prognosis of hepatocellular carcinoma. Hepatology. 2009;49:491–503. - PubMed
    1. Wang ZL, Liang P, Dong BW, Yu XL, Yu DJ. Prognostic factors and recurrence of small hepatocellular carcinoma after hepatic resection or microwave ablation: a retrospective study. J. Gastrointest. Surg. 2008;12:327–337. - PubMed
    1. Ueki T, Fujimoto J, Suzuki T, Yamamoto H, Okamoto E. Expression of hepatocyte growth factor and its receptor c-met proto-oncogene in hepatocellular carcinoma. Hepatology. 1997;25:862–866. - PubMed

Publication types

MeSH terms