. 2021 Dec 1;8(1):261.
doi: 10.1038/s41438-021-00706-9.

Regulatory circuits involving bud dormancy factor PpeDAM6

Affiliations

Regulatory circuits involving bud dormancy factor PpeDAM6

Alba Lloret et al. Hortic Res. .

Abstract

DORMANCY-ASSOCIATED MADS-BOX (DAM) genes have recently emerged as key potential regulators of the dormancy cycle and climate adaptation in perennial species. Particularly, PpeDAM6 has been proposed to act as a major repressor of bud dormancy release and bud break in peach (Prunus persica). PpeDAM6 expression is downregulated concomitantly with the perception of a given genotype-dependent accumulation of winter chilling time, and the coincident enrichment in H3K27me3 chromatin modification at a specific genomic region. We have identified three peach BASIC PENTACYSTEINE PROTEINs (PpeBPCs) interacting with two GA-repeat motifs present in this H3K27me3-enriched region. Moreover, PpeBPC1 represses PpeDAM6 promoter activity by transient expression experiments. On the other hand, the heterologous overexpression of PpeDAM6 in European plum (Prunus domestica) alters plant vegetative growth, resulting in dwarf plants tending toward shoot meristem collapse. These alterations in vegetative growth of transgenic lines associate with impaired hormone homeostasis due to the modulation of genes involved in jasmonic acid, cytokinin, abscisic acid, and gibberellin pathways, and the downregulation of shoot meristem factors, specifically in transgenic leaf and apical tissues. The expression of many of these genes is also modified in flower buds of peach concomitantly with PpeDAM6 downregulation, which suggests a role of hormone homeostasis mechanisms in PpeDAM6-dependent maintenance of floral bud dormancy and growth repression.


Conflict of interest statement

The authors declare no competing interests.

Figures
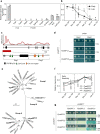
Fig. 1
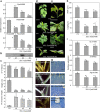
Fig. 1. BPC family proteins interact with GA-repeat motifs in PpeDAM6.
a, b Relative expression of PpeDAM6 in peach by real-time RT-PCR. Data are means from three biological samples with two technical replicates each, with error bars representing standard deviation. Different letters (a–e) indicate significant difference between samples with a confidence level of 95% in each cultivar. a Different plant tissues. Tubulin-like and actin-like genes were used as reference genes. b Floral bud samples from early (black line) and late (gray line) flowering cultivars. Dash lines represent dormancy release for each cultivar. SAND-like gene was used as reference gene. c Schematic representation of H3K27me3-enriched region (red rectangle) of PpeDAM6 adapted from Leida et al. and the designated baits for Y1H assay (Reg1 and Reg2). Exon organization of PpeDAM6 (black rectangles) and untranslated 5’ and 3’ regions (gray rectangles), CarG box (green triangle), and GA-repeat motifs (brown pentagons) are shown. d Y1H analysis of different combinations of pABAi vectors with Reg1 and Reg2 regions and prey vectors (pGADT7) containing positive screening partial clones of PpeBPC1 and PpeBPC2, and control plasmids (–). Yeast strains were grown on a minimal medium and a growth selective medium containing 200 μM of Aureobasidin A (+AbA). e Phylogenetic tree of BPC proteins from Arabidopsis, Hordeum vulgare, Populus trichocarpa, Vitis vinifera, and Prunus persica. The tree was constructed using the Maximum Likelihood method and bootstrapped with 1000 replicates. The scale bar indicates the branch length that corresponds to the number of substitutions per amino acid position. f Relative expression of PpeBPC1 (white squares), PpeBPC2 (white rhombs), and PpeBPC3 (white triangles) measured along floral bud development in the early flowering cultivar. Dash line represents dormancy release. SAND-like gene was used as reference gene. Data are means from three biological samples with two technical replicates each, with error bars representing standard deviation. Different letters (a–d) indicate significant difference between samples for each gene, at a confidence level of 95%. g Y2H analysis of protein interactions between different combinations of bait vectors (pGBKT7) and prey vectors (pGADT7), containing PpeBPC1, PpeBPC2, and PpeBPC3. Yeast strains were grown on a minimal medium (SD without leucine and tryptophan) and a chromogenic medium containing Aureobasidin A and X-α-Gal (+AbA +Gal)
Fig. 2
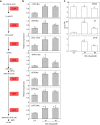
Fig. 2. PpeBPC1 represses PpeDAM6 by binding to GA-repeat motifs in H3K27me3-enriched region.
a Schematic representation of the designated baits to determine the DNA-binding specificity of peach BPC factors. The positive bait (Reg2) was split in seven different fragments. Potential binding sites like CarG boxes and GA-repeat motifs are labeled with green triangles and brown pentagons, respectively. b Y1H analysis of different combinations of pABAi vectors with the seven different regulatory fragments, and prey vectors (pGADT7) with PpeBPC1, PpeBPC2, and PpBPC3 and control plasmid (–). Yeast strains were grown on a minimal medium and a growth selective medium containing 200 μM of Aureobasidin A (+AbA). c Schematic representation of the different reporter vector constructions for the dual luciferase assay. A genomic fragment including promoter (1 kb), 5’ untranslated region (5’-UTR) (gray rectangles), and first and second exons (black rectangles) is represented. Potential binding sites like CarG boxes and GA-repeat motifs are labeled by green triangles and brown pentagons, respectively. Different reporter constructions show deletions of one or both GA-repeat motifs. d Relative LUC/REN ratio measured in the different combinations of reporter vectors (Pro.1-LUC, Pro.2-LUC, and Pro.3-LUC) and effectors vectors containing control plasmid (white bar), PpeBPC1 (light gray bar), PpeBPC2 (dark gray bar), and PpeBPC3 (black bar). In each combination, the value for reporter construction with empty pGreenII-62sk plasmid (control, white bar) was set to 1. Data are means of three biological replicates with error bars representing standard deviation. Different letters (a–b) indicate significant difference between samples for each reporter construction, at a confidence level of 95%
Fig. 3
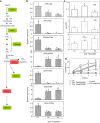
Fig. 3. PpeDAM6 overexpression impairs growth in plum through shoot apical meristem development.
a Relative expression of heterologous PpeDAM6, PdoDAM6, and both genes (PpeDAM6 + PdoDAM6) in leaves of three transgenic lines. AGL26-like and actin-like genes were used as reference genes. Data are means from three biological samples with two technical replicates each, with error bars representing standard deviation. b Protein level of PpeDAM6 in leaves of “Claudia Verde” (CV) and transgenic lines 35S::PpeDAM6 #1, #2, and #3. c Different whole plant parameters of 3-month old plants. Data are means from at least three different plants per genotype, with error bars representing standard deviation. An asterisk indicates significant difference with the control at a confidence level of 95%. d Phenotype of three-month old plants of CV and transgenic lines. Scale bar, 5 cm. e Photographic details of shoot apex. Scale bar, 1 cm. f Shoot apex phenotype of transgenic lines 35S::PpeDAM6 #1 and #2 before and after growth cessation and meristem collapse. g Longitudinal section of shoot apical meristem of “Claudia Verde” (CV) and transgenic lines 35S::PpeDAM6 #1 and #2. Scale bars, 50 µm. h Shoot apical meristem width and height in CV and transgenic lines 35S::PpeDAM6 #1 and #2. Values shown are mean from at least four different plants per genotype with error bars representing standard deviation. i Relative expression of CLV1-like, STM-like, and AGO10-like in CV and 35S::PpeDAM6 #1, #2, and #3 apices. AGL26-like and actin-like genes were used as reference genes. Data are means from four biological apices with two technical replicates each, with error bars representing standard deviation. An asterisk indicates significant difference with the control at a confidence level of 95%
Fig. 4
Fig. 4. JA biosynthesis pathway in 35S::PpeDAM6 overexpressing lines.
a Simplified overview of JA biosynthesis pathway. b Relative expression levels of JA biosynthesis genes in leaves of Claudia Verde (CV) and 35S::PpeDAM6 #1 and #2. AGL26-like and actin-like genes were used as reference genes. Data are means from three biological samples with two technical replicates each, with error bars representing standard deviation. c OPDA, JA, and JA-Ile content in leaves of CV and 35S::PpeDAM6 #1 and #2. Data are means from four biological samples, with error bars representing standard deviation. An asterisk indicates significant difference with the control at a confidence level of 95%
Fig. 5
Fig. 5. CK biosynthesis pathway in 35S::PpeDAM6 overexpressing lines.
a Simplified overview of CK catabolism pathway. b Relative expression levels of CKX genes in leaves of Claudia Verde (CV) and 35S::PpeDAM6 #1 and #2. AGL26-like and actin-like genes were used as reference genes. Data are means from three biological samples with two technical replicates each, with error bars representing standard deviation. c Content of iPR and iPA in leaves of CV and 35S::PpeDAM6 #1 and #2. Data are means from four biological samples, with error bars representing standard deviation. An asterisk indicates significant difference with the control at a confidence level of 95%
Fig. 6
Fig. 6. GA biosynthesis and response pathways in 35S::PpeDAM6 overexpressing lines.
a Simplified overview of GA biosynthesis and signaling pathway. b Relative expression levels of GA-related genes in leaves of Claudia Verde (CV) and 35S::PpeDAM6 #1 and #2. AGL26-like and actin-like genes were used as reference genes. Data are means from three biological samples with two technical replicates each, with error bars representing standard deviation. An asterisk indicates significant difference with the control at a confidence level of 95%. c Content of GA19 and GA4 in leaves of CV and 35S::PpeDAM6 #1 and #2. Data are means from four biological samples, with error bars representing standard deviation. d Growth of CV (white rhombs), 35S::PpeDAM6 #1 (white squares) and #2 (white triangle) under water (control) and GA treatments. Data are means from at least three different plants per genotype. Different letters (a–b) indicate significant difference between different genotypes in each week, at a confidence level of 95%
Fig. 7
Fig. 7. ABA biosynthesis and response pathway in 35S::PpeDAM6 overexpressing lines.
a Simplified overview of ABA biosynthesis and signaling pathways. b Relative expression levels of ABA-related genes in leaves of Claudia Verde (CV) and 35S::PpeDAM6 #1 and #2. AGL26-like and actin-like genes were used as reference genes. Data are means from three biological samples with two technical replicates each, with error bars representing standard deviation. c Content of ABA in leaves of CV and 35S::PpeDAM6 #1 and #2. Data are means from four biological samples, with error bars representing standard deviation. An asterisk indicates significant difference with the control at a confidence level of 95%
Fig. 8
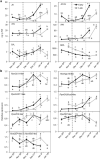
Fig. 8. Hormone homeostasis and meristem-related genes during floral bud development in peach.
a Seasonal changes in the hormone content along floral bud development in early (black line) and late (gray line) flowering cultivars. Dash lines represent dormancy release. Data are means from three biological samples with two technical replicates each, with error bars representing standard deviation. b Relative expression of PpeCLV1-like, PpeAGO10-like, PpeGAST1-like, and PpeGa20ox2-like measured along floral bud development in early (black line) and late (gray line) flowering cultivars. SAND-like gene was used as reference gene. Data are means from three biological samples with two technical replicates each, with error bars representing standard deviation. Different letters (a–e) indicate significant difference between samples, at a confidence level of 95%
Fig. 9
Fig. 9. Schematic changes during flower bud development in peach.
Abscisic acid (ABA), jasmonic acid (JA), citokinin (CK), and gene expression changes (PpeDAM6, GAST-like, and SAM genes). Dormancy release and bud break are labeled with dashed lines. PpeDAM6 effect on hormone accumulation and gene expression is labeled with black arrows (activation) and perpendicular bars (inhibition)

References

    1. Singh RK, Svystun T, AlDahmash B, Jönsson AM, Bhalerao RP. Photoperiod- and temperature-mediated control of phenology in trees – a molecular perspective. N. Phytol. 2017;213:511–524. - PubMed
    1. Falavigna V, da S, Guitton B, Costes E, Andrés F. I want to (bud) break free: the potential role of DAM and SVP-like genes in regulating dormancy cycle in temperate fruit trees. Front. Plant Sci. 2019;9:1990. - PMC - PubMed
    1. Heide OM, Prestrud AK. Low temperature, but not photoperiod, controls growth cessation and dormancy induction and release in apple and pear. Tree Physiol. 2005;25:109–114. - PubMed
    1. Cooke JEK, Eriksson ME, Junttila O. The dynamic nature of bud dormancy in trees: environmental control and molecular mechanisms. Plant Cell Environ. 2012;35:1707–1728. - PubMed
    1. Ferguson BJ, Beveridge CA. Roles for auxin, cytokinin, and strigolactone in regulating shoot branching. Plant Physiol. 2009;149:1929–1944. - PMC - PubMed