. 2021 Nov 30;12(1):6990.
doi: 10.1038/s41467-021-27263-y.

Neuropilin 1 regulates bone marrow vascular regeneration and hematopoietic reconstitution

Affiliations

Neuropilin 1 regulates bone marrow vascular regeneration and hematopoietic reconstitution

Christina M Termini et al. Nat Commun. .

Abstract

Ionizing radiation and chemotherapy deplete hematopoietic stem cells and damage the vascular niche wherein hematopoietic stem cells reside. Hematopoietic stem cell regeneration requires signaling from an intact bone marrow (BM) vascular niche, but the mechanisms that control BM vascular niche regeneration are poorly understood. We report that BM vascular endothelial cells secrete semaphorin 3 A (SEMA3A) in response to myeloablation and SEMA3A induces p53 - mediated apoptosis in BM endothelial cells via signaling through its receptor, Neuropilin 1 (NRP1), and activation of cyclin dependent kinase 5. Endothelial cell - specific deletion of Nrp1 or Sema3a or administration of anti-NRP1 antibody suppresses BM endothelial cell apoptosis, accelerates BM vascular regeneration and concordantly drives hematopoietic reconstitution in irradiated mice. In response to NRP1 inhibition, BM endothelial cells increase expression and secretion of the Wnt signal amplifying protein, R spondin 2. Systemic administration of anti - R spondin 2 blocks HSC regeneration and hematopoietic reconstitution which otherwise occurrs in response to NRP1 inhibition. SEMA3A - NRP1 signaling promotes BM vascular regression following myelosuppression and therapeutic blockade of SEMA3A - NRP1 signaling in BM endothelial cells accelerates vascular and hematopoietic regeneration in vivo.


Conflict of interest statement

The authors declare no competing interests.

Figures

Fig. 1
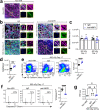
Fig. 1. BM ECs upregulate expression of SEMA3A and its receptor, NRP1, following irradiation.
a Heatmap of semaphorin (Sema) gene expression in irradiated and non-irradiated (non-IRR) BM ECs isolated before and after irradiation (n = 3/condition). b qRT-PCR analysis of Sema and Nrp expression in VE-cad+ BM ECs from Non-IRR and 500 cGy-irradiated mice (n = 6/condition from n = 10,000 cells/replicate; ****p < 0.0001). Data normalized to non-IRR sample. Horizontal bars represent means. c qRT-PCR of Sema3a expression in BM hematopoietic cell populations, LepR+ stromal cells and CD31+Sca-1 sinusoidal BM ECs (sBMECs) and CD31+Sca-1+ arterial BM ECs (aBMECs; n = 4–12 replicates/condition; ****p < 0.0001). Data normalized to KSL cells. d qRT-PCR of Sema3a expression in aBMECs and sBMECs before and +24 h following 500 cGy (n = 6/group; aBMEC: ***p = 0.0008, sBMEC: n.s. p = 0.72). Data normalized to non-IRR. e qRT-PCR of Nrp1 expression in BM hematopoietic cell populations, LepR+ stromal cells and ECs (n = 4–12 replicates/group; ****p < 0.0001). Data normalized to KSL cells. f SEMA3A concentration in the BM of mice following 500 cGy quantified by ELISA (n = 8 mice; 6 h, d1, d2: ****p < 0.0001, d7: ***p = 0.0001, d14: ***p = 0.0007). Dotted line represents BM SEMA3A concentration in non-IRR mice. g Confocal images of femurs from C57BL/6J mice before and +72 h following 500 cGy. Expression of SEMA3A (yellow) in VE-Cad+ BM ECs (magenta) and CD31+ BM ECS (green) is shown (white arrows). Nuclei labeled with DAPI (blue). Representative images from n = 3 experiments, Scale bar 50 µm; magnified scale bar, 20 µm; max z-projections shown. h Expression of NRP1 (yellow) in VE-Cad+ BM ECs (magenta) and CD31+ BM ECS (green) is shown (white arrows) in same conditions. Representative images from n = 3 experiments. i Representative gating, histogram, and j quantification of NRP1 expression on Non-IRR and 500 cGy-irradiated BM ECs (n = 5/group, ****p < 0.0001, aBMEC: p = 0.8256). k NRP1 MFI within BM EC sub-populations before and +24 h post-500 cGy (n = 5/group, ****p < 0.0001). Data assessed by Holm-Sidak’s multiple comparison two-sided t-test after two-way ANOVA (b, d, f, j, k) and the Holm-Sidak’s multiple comparison two-sided t-test after one-way ANOVA (c, e). Data presented as mean values +/− SEM. **p < 0.01, ***p < 0.001, ****p < 0.0001. Source data are provided as a Source Data file. .
Fig. 2
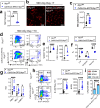
Fig. 2. NRP1 inhibition accelerates BM vascular regeneration in vivo.
Representative confocal images of VE-cadherin+ (magenta) and CD31+ (green) BM vessels, and nuclei (blue) in femurs from a non-IRR mice and at b day +3 and day +7 following 500 cGy and treatment with IgG (10 µg/dose) or anti-NRP1 (10 µg/dose). Left image shows full view taken using 20× lens and right images display individual channels from magnified yellow box. Scale bar 50 µm; magnified view scale bar, 20 µm. c Quantification of VE-Cadherin vascular area from the images in a, b. Dotted line represents mean Non-IRR vascular area. Data presented as mean values +/− SEM. (n = 2 independent experiments, d3 IgG n = 4 fields of view, d3 anti-NRP1 n = 5 fields, d7 IgG n = 7 fields, d7 anti-NRP1 n = 7 fields; IgG d3: p = 0.016, anti-NRP1 d3: p = 0.0467, IgG d7: p = 0.0349, anti-NRP1 d7: p = 0.9694. d BM cell counts at day +7 following 500 cGy and treatment with IgG or anti-NRP1 (n = 5 mice/group, p = 0.0025). Dotted line shows cell counts of non-IRR BM. e At left, representative flow cytometric analysis of CD45VE-cad+ BM ECs within BM lin cells from the groups shown. At right, percentages of BM ECs at day +7 following 500 cGy. Dotted line represents %VE-cad+ ECs in non-IRR controls (n = 5 mice/group). f At left, representative histograms of % activated caspase 3/7+ cells within linCD45VE-cad+ BM ECs at day +7 following 500 cGy. At right, mean % activated caspase 3/7+ BM ECs at day +7 following 500 cGy (n = 5/group). Dotted line represents % activated caspase 3/7+ ECs in non-IRR controls. g Levels of Evans Blue Dye (EBD) in the BM extracellular space at +24 h following 500 cGy and treatment with IgG or anti-NRP1 (n = 5–6 mice/group, non-IRR vs. IgG: p = 0.0024, IgG vs. anti-NRP1: p = 0.188, non-IRR vs. anti-NRP1 p = 0.2679). df Data assessed by Student’s two-tailed t-test, g One-way ANOVA with Holm-Sidak’s multiple comparison two-sided t-test, c Two-sided one-sample t-test and Wilcoxon test used to compare sample means to the mean of non-IRR samples, *p < 0.05, **p < 0.01, ****p < 0.0001. Source data provided as a Source Data file.
Fig. 3
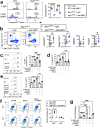
Fig. 3. NRP1 inhibition accelerates hematopoietic regeneration following TBI.
a PB WBC, neutrophil (NEU), and lymphocyte (LYMPH) counts at days +3, +7, and +10 following 500 cGy and treatment with IgG or anti-NRP1 (n = 5–10 mice/group, mean values +/− SEM; WBC: d7: p = 0.0016, d10 p = 0.002; NEU: d7: p = 0.0089, d10: p = 0.0035, LYMPH: d10: p = 0.0482). b BM cell counts at day +10 following 500 cGy and treatment with IgG or anti-NRP1 (n = 5–10 mice/group, p = 0.0033). Dotted line represents BM cell counts in non-IRR controls. c At left, flow cytometry of BM c-kit+sca-1lin progenitors and KSL cells at day +10 following 500 cGy; at right, numbers of BM c-kit+sca-1lin cells and KSL at day +10 (n = 5–10 mice/group, p < 0.0001). d At left, PB donor CD45.2+ cell engraftment at 20 weeks in CD45.1+ mice transplanted with BM cells collected at day +10 from 500 cGy—irradiated CD45.2+ mice treated with IgG or anti-NRP1, along with CD45.1+ BM competitor cells. At right, % total CD45.2+ cells, CD45.2+Mac1+Gr1+ myeloid cells, CD45.2+B220+ B cells, and CD45.2+CD3+ T cells at 20 weeks (n = 12–13 mice/group, total: p = 0.0288, myeloid: p = 0.0266, B cells: p = 0.0051, T cells: p = 0.0001). e At left, histograms of donor CD45.2+KSL cells in the BM of transplanted CD45.1+ mice at 20 weeks (n = 5 mice/group, p = 0.0079). f Percent survival of C57BL/6J mice following 800 cGy TBI and treatment with anti-NRP1 or IgG for 10 days (Log-rank test, p = 0.001, n = 12 mice/group). g PB WBCs and hemoglobin (Hb) at day +7, +10 and +14 from C57BL/6J mice following 800 cGy and treatment with anti-NRP1 or IgG (n = 8–10 mice/condition; WBC d7: p = 0.4045, WBC d10: p = 0.0415, WBC d14: p = 0.8714; Hb d7: p = 0.0154, Hb d10: p = 0.2741, Hb d14: p = 0.6216). h At left, flow cytometry of BM KSL cells 10 days following 800 cGy and treatment with anti-NRP1 or IgG; at right, %KSL cells (n = 10 mice/condition; p = 0.0358). a Two-way ANOVA with Holm Sidak’s multiple comparison two-sided t-test. b, c Two-sided t-test, d, e Two-sided Mann–Whitney test, f Two-sided log-rank test, g Two-way ANOVA with Holm-Sidak’s multiple comparison two-sided t-tests, and h Student’s two-sided unpaired t-test. *p < 0.05, **p < 0.01, ***p < 0.001, ****p < 0.0001. Source data are provided as a Source Data file.
Fig. 4
Fig. 4. NRP1 inhibition accelerates BM vascular and hematopoietic regeneration following chemotherapy.
a qRT-PCR analysis of Sema3a and Nrp1 expression in BM ECs from mice at +24 h following 5-FU chemotherapy. For each gene, expression is normalized to vehicle treatment (n = 5/condition; Sema3a: p < 0.0001, Nrp1: p = 0.1291). b Representative images of VE-cadherin+ (magenta), CD31+ (green) BM vessels in femur sections from untreated control mice and at day +7 following 5-FU chemotherapy and treatment with anti-NRP1 or IgG. Nuclei are stained with DAPI (blue). Scale bar, 50 µm; magnified view scale bar, 20 µm. c BM cell counts at day +7 following 5-FU chemotherapy and treatment with anti-NRP1 or IgG (n = 5 mice/group, p = 0.0219). d At left, representative flow cytometric analysis of CD45VE-cad+ BM ECs within BM lin cells from control mice and at day +7 following 5-FU chemotherapy and anti-NRP1 or IgG treatment. At right, percentages and numbers of BM ECs at day +7 following 5-FU chemotherapy and the treatments shown. Dotted lines represent numbers in control mice (n = 5 mice/group; % BM ECs p < .0001; number BM ECs p = 0.0008). e At left, representative histograms show % activated caspase 3/7+ cells within linCD45VE-cad+ BM ECs at day +7 following 5-FU. At right, % activated caspase 3/7+ BM ECs at day +7 (n = 5/group; p < .0001). Dotted line represents percentages of activated caspase 3/7+ cells within linCD45VE-cad+ BM ECs in non-IRR controls. f PB WBC, NEU, and LYMPHs at day +7 following 5-FU and the treatments shown (n = 5 mice/group; p < 0.0001). g At left, flow cytometry of BM KSL cells at day +7 following 5-FU and the treatments shown. At right, % BM KSL cells (n = 5 mice/group; p = 0.011). h Colony forming unit quantification from 30,000 BM cells isolated from mice at day +7 following 5-FU and IgG or anti-NRP1 treatment (n = 4 replicates, mean values +/− SEM; GM: p < 0.0001; GEMM: p = 0.0201). Statistics show GM and GEMM comparisons. a, f, h Two-way ANOVA followed by Holm-Sidak’s multiple comparison two-sided t-tests; c, d, g Student’s unpaired two-sided t-test. *p < 0.05, ***p < 0.001, ****p < 0.0001. Source data provided as a Source Data file.
Fig. 5
Fig. 5. EC-specific deletion of Nrp1 accelerates BM vascular and hematopoietic regeneration.
a qRT-PCR analysis for Nrp1 expression in VE-cadherin+ BM ECs from Nrp1fl/fl mice and Cdh5-Cre-ERT2;Nrp1fl/fl mice following tamoxifen treatment (n = 4–5 mice/group, p < 0.0001). Nrp1 expression was normalized to Gapdh levels and then replicates were normalized relative to the Nrp1fl/fl group. b Representative microscopic images of VE-cad+ BM vessels (red) in femur sections from Nrp1fl/fl mice and Cdh5-Cre-ERT2;Nrp1fl/fl mice at day +7 following 500 cGy TBI. Scale bar, 100 µm. c BM cell counts in Nrp1fl/fl mice and Cdh5-Cre-ERT2;Nrp1fl/fl mice at day +10 following 500 cGy (n = 10 mice/group; p = 0.001). d Representative flow cytometric analysis of CD45CD31+ BM ECs within BM lin cells from Nrp1fl/fl mice and Cdh5-Cre-ERT2;Nrp1fl/fl mice are shown at day +10. At right, representative percentages of Annexin+7AAD and Annexin+7AAD+ cells within the BM EC population are shown. e At left, mean percentages of CD31+ BM ECs within the BM lin population at day +10 and at right, numbers of femoral CD31+ BM ECs at day +10 following 500 cGy TBI (n = 5 mice/group; %BM ECs: p < 0.0001; number BM ECs: p = 0.0056). f Mean percentages of live, apoptotic, and necrotic BM ECs at day +10 following 500 cGy in the groups shown (n = 5 mice/group; p < 0.0001). g PB WBC, NEU, and LYMPHS at day +10 following 500 cGy TBI in Nrp1fl/fl mice and Cdh5-Cre-ERT2;Nrp1fl/fl mice (n = 10 mice/group; WBC: p < 0.0001; NEU: p = 0.0014; LYMPH: p = 0.0327). h At left, representative flow cytometric analysis of BM c-kit+sca1lin progenitors and KSL stem/progenitor cells at day +10 following 500 cGy TBI. At right, number of c-kit+sca1lin progenitors and KSL cells at day +10 in the groups shown (n = 10 mice/group, p < 0.0001). i CFC quantification from 10,000 BM cells isolated from mice at day +10 following IR (n = 10 replicates, data are presented as mean values +/− SEM, p < 0.0001). a, c, e, h Student’s unpaired two-sided t-test, f, g, i Two-way ANOVA with Holm-Sidak’s multiple comparison two-sided t-tests. *p < 0.05, **p < 0.01, ****p < 0.0001. Source data are provided as a Source Data file.
Fig. 6
Fig. 6. SEMA3A promotes BM EC apoptosis via activation of Cdk5 and p53.
a (Left) flow cytometry of activated caspase 3/7+ BM ECs in wild-type (WT) and Nrp1VEGF− mice at day +5 following 500 cGy and the treatments shown; (Right) % activated caspase 3/7+ BM ECs (n = 5/group; ****p < 0.0001; ***p = 0.0003). b (Left) Donor CD45.2+ cell engraftment at 20 weeks in the PB of CD45.1+ mice competitively transplanted with BM cells from 500 cGy—irradiated Nrp1VEGF− mice treated with anti-NRP1 or IgG; (Right) % donor CD45.2+, Mac1+/Gr1+, B220+, and CD3+ cells at 20 weeks (n = 5–6/group; total: p = 0.0346; myeloid: p = 0.0325; T cells: p = 0.0195). c (Left) Histograms of p-Cdk5+ BM ECs at 1 h following 800 cGy and the treatments shown; (Right) %p-p53+ BM ECs. Horizontal lines show gating for p-Cdk5+ cells (n = 5 replicates, Non-IRR; n = 6 replicates for IRR, IRR + SEMA3A, IRR + SEMA3A + anti-NRP1; non-IRR vs. IRR: p < 0.0001; IRR vs. IRR + SEMA3A: p = 0.0005; IRR vs. IRR + SEMA3A + Anti-NRP1 p < 0.0001). d % activated caspase 3/7+ BM ECs at 24 h following 800 cGy and treatment with SEMA3A, SEMA3A + anti-NRP1 or SEMA3A + roscovitine (ROSC), 10 ng/ml (n = 4–8 replicates; non-IRR vs. IRR: p < 0.0001; IRR vs. IRR + SEMA3A: p = 0.0007; IRR vs. IRR + SEMA3A + Anti-NRP1 p < 0.0001; IRR vs. IRR + SEMA3A + Anti-NRP1 + ROSC p < 0.0001). e At left, histograms of p-p53+ BM ECs at 1 h following 800 cGy and treatment with SEMA3A, SEMA3A + anti-NRP1, or SEMA3A + ROSC. At right, % p-p53+ BM ECs are shown. Black horizontal lines show gating for p-p53+ cells (n = 6 replicates, Non-IRR; n = 9 replicates for IRR and IRR + SEMA3A; n = 5 replicates for IRR + SEMA3A + anti-NRP1; n = 4 replicates for IRR + SEMA3A + ROSC; p < 0.0001 for all comparisons). f At left, flow cytometry for activated caspase 3/7+ BM ECs from p53−/− and p53+/+ mice at 24 h following irradiation with 800 cGy and the treatments shown. At right, % activated caspase 3/7+ BM ECs are shown (n = 5 replicates/group, p < 0.0001). g Puma expression in BM ECs at 6 h following 800 cGy and the treatments shown (n = 4/condition; ****p < 0.0001, *p = 0.0142, **p = 0.0025, ***p = 0.0009). a, c, d, e One-way ANOVA followed by Holm-Sidak’s two-sided unpaired t-tests, f Two-way ANOVA followed by Holm-Sidak’s two-sided unpaired t-test, g Brown–Forsythe ANOVA followed by two-sided unpaired t-tests with Welch’s correction, b Two-sided Mann–Whitney test. *p < 0.05, **p < 0.01, ***p < 0.001, ****p < 0.0001. Source Data file provided.
Fig. 7
Fig. 7. BM ECs promote hematopoietic regeneration via secretion of R spondin 2.
a IPA of functions and diseases enriched in BM ECs at 72 h following 500 cGy and treatment with anti-NRP1 relative to irradiated control BM ECs. p values shown for pair-wise comparisons and each replicate is a pool of sorted BM ECs (n = 5 mice). b Heat map of genes that encode secreted proteins expressed ≥ 2-fold in BM ECs from irradiated mice treated with anti-NRP1 compared to BM ECs from irradiated controls. Each replicate is a pool of sorted BM ECs from five mice. c R spondin 2 (RSPO2) ELISA of supernatants from BM ECs following 800 cGy irradiation and culture with 10 µg/ml anti-NRP1 or IgG (n = 3–5/group; p = 0.0034). d PB WBC and NEU at day +10 following 500 cGy in mice treated with anti-NRP1, 10 µg anti-R spondin 2, anti-NRP1 + anti-R spondin 2, or IgG every other day × 10 days (n = 5–7 mice/group; WBC: p = 0.015, NEU: p = 0.0135). Dotted lines represent levels in non-IRR controls. e (Left) Flow cytometry of BM KSL cells and CD150+CD41/48-KSL LT-HSCs in mice at day +10 following 500 cGy and treatment with anti-NRP1, anti-R spondin 2, anti-NRP1 + anti-R spondin 2, or IgG. Numbers represent percentages in each gate; (Right) % BM KSL and % SLAM KSL cells in each treatment group (n = 5–7 mice/group; KSL: p = 0.007; SLAM KSL: p = 0.0123). f Numbers of BM KSL and SLAM HSCs from mice at day +10 following 500 cGy and treatment with anti-NRP1, anti-R spondin 2, anti-NRP1 + anti-R spondin 2, or IgG (n = 5–7/group; KSL: p = 0.0067; SLAM KSL: p = 0.0013). g Total BM CFCs and CFU-GEMMs in mice at day +10 following 500 cGy and treatments as shown (n = 5/group; CFCs: p = 0.0002; GEMM: p = 0.0026). h Numbers of CFU-GEMMs from BM c-kit+lin cells at day +3 following 300 cGy and treatment with 100 ng/ml Wnt3a, 200 ng/ml R spondin 2, or the combination (n = 3–5/group; p < 0.0001). cg Two-way ANOVA followed by two-sided Holm-Sidak unpaired t-tests; h One-way ANOVA with Holm-Sidak’s multiple comparison two-sided t-test. *p < 0.05, **p < 0.01, ***p < 0.001, ****p < 0.0001. Source Data file provided.

Similar articles

Cited by

References

    1. Asada N, et al. Differential cytokine contributions of perivascular hematopoietic stem cell niches. Nat. Cell Biol. 2017;19:214–223. - PMC - PubMed
    1. Chow A, et al. Bone marrow CD169+ macrophages promote the retention of hematopoietic stem and progenitor cells in the mesenchymal stem cell niche. J. Exp. Med. 2011;208:261–271. - PMC - PubMed
    1. Ding L, Saunders T, Enikolopov G, Morrison S. Endothelial and perivascular cells maintain haematopoietic stem cells. Nature. 2012;481:457–462. - PMC - PubMed
    1. Ding L, Morrison S. Haematopoietic stem cells and early lymphoid progenitors occupy distinct bone marrow niches. Nature. 2013;495:231–235. - PMC - PubMed
    1. Greenbaum A, et al. CXCL12 in early mesenchymal progenitors is required for haematopoietic stem-cell maintenance. Nature. 2013;495:227–230. - PMC - PubMed

Publication types