. 2021 Nov 30;6(1):83.
doi: 10.1038/s41536-021-00193-5.

3D in vitro M2 macrophage model to mimic modulation of tissue repair

Affiliations

3D in vitro M2 macrophage model to mimic modulation of tissue repair

Jiranuwat Sapudom et al. NPJ Regen Med. .

Abstract

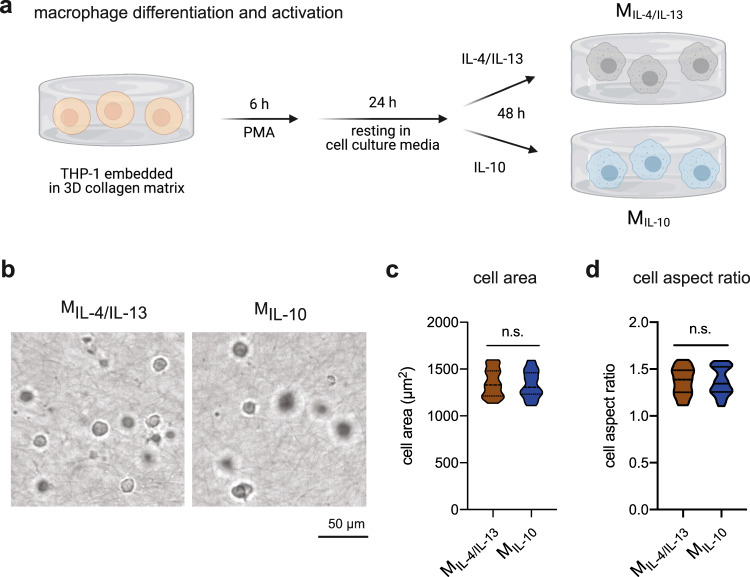
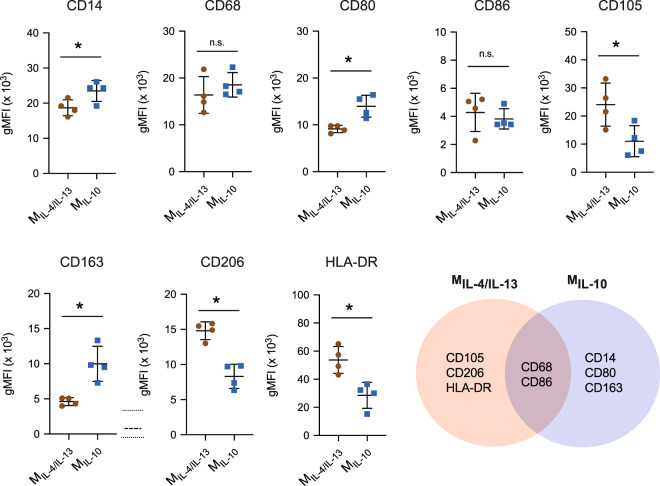
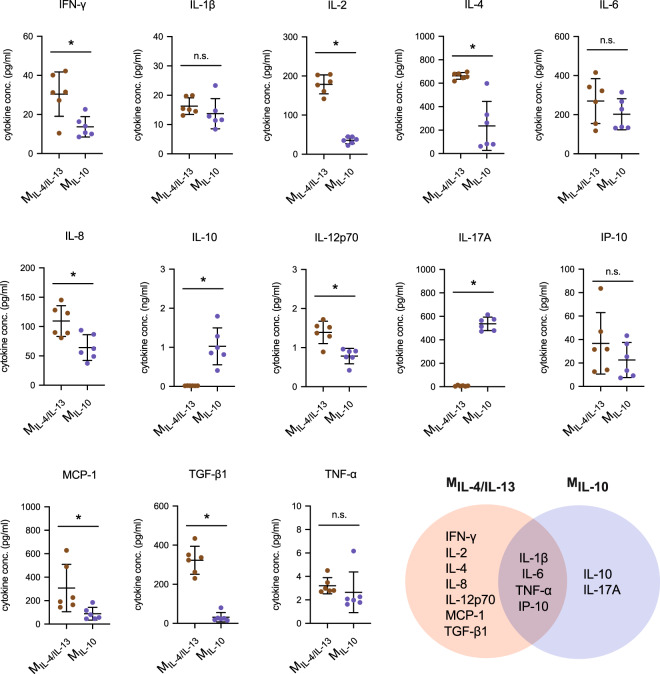
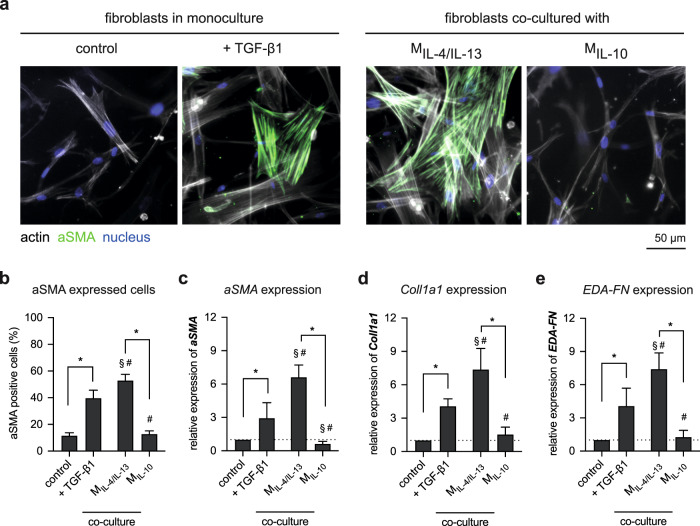
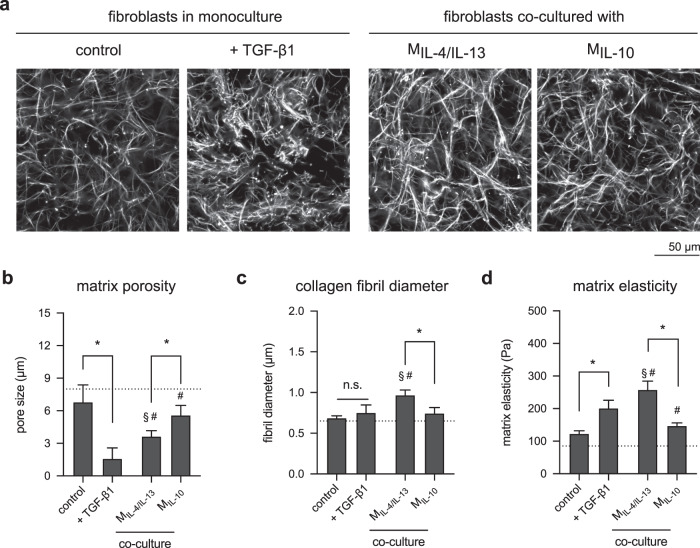
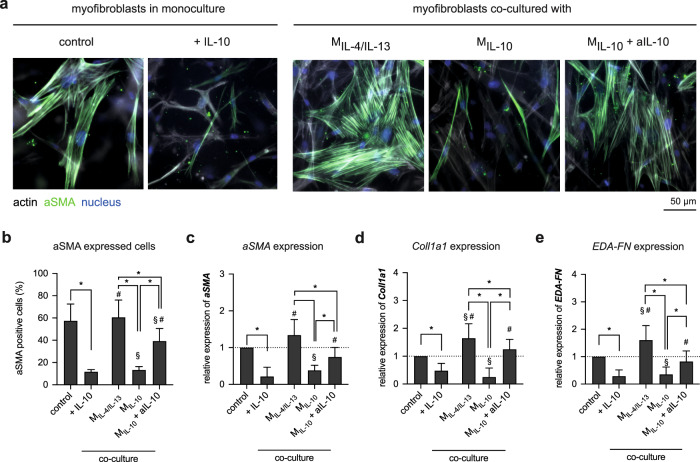
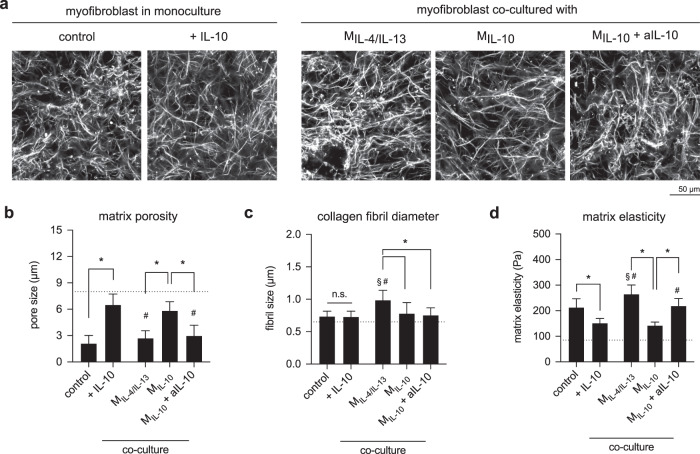
Distinct anti-inflammatory macrophage (M2) subtypes, namely M2a and M2c, are reported to modulate the tissue repair process tightly and chronologically by modulating fibroblast differentiation state and functions. To establish a well-defined three-dimensional (3D) cell culture model to mimic the tissue repair process, we utilized THP-1 human monocytic cells and a 3D collagen matrix as a biomimetic tissue model. THP-1 cells were differentiated into macrophages, and activated using IL-4/IL-13 (MIL-4/IL-13) and IL-10 (MIL-10). Both activated macrophages were characterized by both their cell surface marker expression and cytokine secretion profile. Our cell characterization suggested that MIL-4/IL-13 and MIL-10 demonstrate M2a- and M2c-like subtypes, respectively. To mimic the initial and resolution phases during the tissue repair, both activated macrophages were co-cultured with fibroblasts and myofibroblasts. We showed that MIL-4/IL-13 were able to promote matrix synthesis and remodeling by induction of myofibroblast differentiation via transforming growth factor beta-1 (TGF-β1). On the contrary, MIL-10 demonstrated the ability to resolve the tissue repair process by dedifferentiation of myofibroblast via IL-10 secretion. Overall, our study demonstrated the importance and the exact roles of M2a and M2c-like macrophage subtypes in coordinating tissue repair in a biomimetic model. The established model can be applied for high-throughput platforms for improving tissue healing and anti-fibrotic drugs testing, as well as other biomedical studies.


Conflict of interest statement

The authors declare no competing interests.

Figures

Fig. 1
Fig. 1. Macrophage differentiation and activation in 3D collagen matrices.
a Schematic workflow for macrophage differentiation and activation towards MIL-4/IL-13 and MIL-10 in 3D collagen matrix. b Representative images of MIL-4/IL-13 and MIL-10 were gathered using bright-field microscopy. A quantitative morphological analysis, namely c cell area and d cell aspect ratio, was conducted using an image analysis toolbox. Data are presented as a violin plot. At least 100 cells from three independent experiments were analyzed.
Fig. 2
Fig. 2. Quantitative analysis of cell surface markers of MIL-4/IL-13 and MIL-10.
Cell surface markers were analyzed by immunocytostaining of CD14, CD68, CD80, CD86, CD105, CD163, CD206, and HLA-DR. Geometric mean fluorescence intensity (gMFI) was plotted. Black line and error bar in the plot represent mean and standard deviation, respectively. * indicates a significance level of p ≤ 0.05 using Mann–Whitney test. Experiments were performed in four independent replicates.
Fig. 3
Fig. 3. Quantitative analysis of cytokine secretion profile of MIL-4/IL-13 and MIL-10.
Cytokine secretion profile was analyzed from cell culture supernatants after 3 days of macrophage activation by a bead-based multiplex immunoassay using flow cytometry. Data are shown as a dot plot. Black line and error bar in the plot represent mean and standard deviation, respectively. * indicates a significance level of p ≤ 0.05 using Mann–Whitney test. Experiments were performed in six independent replicates.
Fig. 4
Fig. 4. Alteration of fibroblast morphology and specific markers in the presence of TGF-β1 and co-culture with M2 macrophages subtypes.
a Representative images showing nuclei (blue), actin filaments (gray), and αSMA (green) (scale bar: 50 μm). Fibroblast differentiation was analyzed by b manual counting of αSMA-positive cells. At least 200 cells per condition were counted. Gene expression analysis of c αSMA, d Coll1a1, and e EDA-FN were performed using qPCR. Data are represented as mean ± SD; *a significance level of p ≤ 0.05 using a one-way ANOVA followed by Tukey’s post hoc analysis. The characters # and § represent the significance level of p ≤ 0.05 using a one-way ANOVA followed by Tukey’s post hoc analysis when compared to control, and treated samples with TGF-β1, respectively. Experiments were performed in four replicates.
Fig. 5
Fig. 5. Matrix remodeling by fibroblasts in the presence of TGF-β1 and co-culture with M2 subtypes.
a Representative images of decellularized collagen matrices in mono and co-culture with M2 subtypes (scale bar: 50 μm). Decellularized collagen matrices were characterized regarding b matrix porosity characterized as mean pore size, c collagen fibril diameter, and d bulk matrix elastic modulus (data are represented as mean ± SD; *significance level of p ≤ 0.05 using a one-way ANOVA followed by Tukey’s post hoc analysis). The characters # and § represent the significance level of p ≤ 0.05 using a one-way ANOVA followed by Tukey’s post hoc analysis when compared to control, and treated samples with TGF-β1, respectively. For the quantification of matrix porosity and collagen fibril diameter, 10 different positions of each matrix condition were analyzed. Experiments were performed in four replicates.
Fig. 6
Fig. 6. Alteration of myofibroblasts morphology and specific markers in the presence of IL-10 and co-culture with M2 macrophages subtypes.
a Representative images showing nuclei (blue), actin filaments (gray), and αSMA (green) (scale bar: 50 μm). Myofibroblast de-dedifferentiation were analyzed using b percentage of αSMA-positive cells by manual counting of cells with αSMA incorporation into actin stress fibers and quantitative analysis of c αSMA, d Coll1a1, and e EDA-FN gene expression. For quantitative analysis of αSMA-positive cells, at least 200 cells per condition were counted. Data are represented as mean ± SD; *significance level of p ≤ 0.05 using a one-way ANOVA followed by Tukey’s post hoc analysis). The characters # and § represent the significance level of p ≤ 0.05 using a one-way ANOVA followed by Tukey’s post hoc analysis when compared to control, and treated samples with IL-10, respectively. Experiments were performed in four replicates.
Fig. 7
Fig. 7. Matrix remodeling by myofibroblasts in the presence of IL-10 and co-culture with M2 subtypes.
a Representative images of decellularized collagen matrices in mono and co-culture with M2 subtypes (scale bar: 50 μm). Decellularized collagen matrices were characterized regarding b matrix porosity characterized as mean pore size, c collagen fibril diameter, and d matrix elastic modulus. (Data are represented as mean ± SD; *significance level of p ≤ 0.05 using a one-way ANOVA followed by Tukey’s post hoc analysis.) The characters # and § represent the significance level of p ≤ 0.05 using a one-way ANOVA followed by Tukey’s post hoc analysis when compared to control, and treated samples with IL-10, respectively. For the quantification of matrix porosity and collagen fibril diameter, 10 different positions of each matrix condition were analyzed. Experiments were performed in four replicates.
Fig. 8
Fig. 8. Migration of fibroblasts and myofibroblasts into 3D collagen matrices.
Cells were stained with Phalloidin conjugated with Alexa Fluor-488 and DAPI, for visualization and quantification of cell migration into 3D collagen matrices, respectively. Representative images of xz-view of a fibroblast and d myofibroblast into 3D collagen matrices in mono- and co-culture with macrophages. Quantitative analysis of b, e percentage of migrating cells and c, f maximum migration depth of fibroblast and myofibroblasts. Cells found >20 μm beneath the matrix surface were counted as migrating cells. The maximum migration distance was defined as the distance crossed by 10% of all cells. Data are represented as mean ± SD; *significance level of p ≤ 0.05 using a one-way ANOVA followed by Tukey’s post hoc analysis. The characters # and § represent the significance level of p ≤ 0.05 using a one-way ANOVA followed by Tukey’s post hoc analysis when compared to control, and treated samples with TGF-β1 or IL-10, respectively. Three different positions of each matrix condition were analyzed. Experiments were performed in four replicates.
Fig. 9
Fig. 9. Schematic illustration of the proposed M2-associated functions in initiation and termination phases of tissue repair in 3D biomimetic wound-healing model.
MIL-4/IL-13 macrophages control the initiation of tissue repair by modulating fibroblast differentiation via TGF-β1, while MIL-10 macrophages terminate the tissue repair by de-differentiating myofibroblasts back into fibroblasts via IL-10.

References

    1. Tottoli EM, et al. Skin wound healing process and new emerging technologies for skin wound care and regeneration. Pharmaceutics. 2020;12:1–30.. - PMC - PubMed
    1. Reinke JM, Sorg H. Wound repair and regeneration. Eur. Surg. Res. 2012;49:35–43. - PubMed
    1. Schultz GS, Wysocki A. Interactions between extracellular matrix and growth factors in wound healing. Wound Repair Regen. 2009;17:153–162. - PubMed
    1. Leoni G, Neumann PA, Sumagin R, Denning TL, Nusrat A. Wound repair: role of immune-epithelial interactions. Mucosal Immunol. 2015;8:959–968. - PMC - PubMed
    1. Wilkinson HN, Hardman MJ. Wound healing: cellular mechanisms and pathological outcomes: cellular mechanisms of wound repair. Open Biol. 2020;10:200223. - PMC - PubMed