. 2021 Nov 30;4(1):1341.
doi: 10.1038/s42003-021-02876-7.

Infrared nanoscopy and tomography of intracellular structures

Affiliations

Infrared nanoscopy and tomography of intracellular structures

Katerina Kanevche et al. Commun Biol. .

Abstract

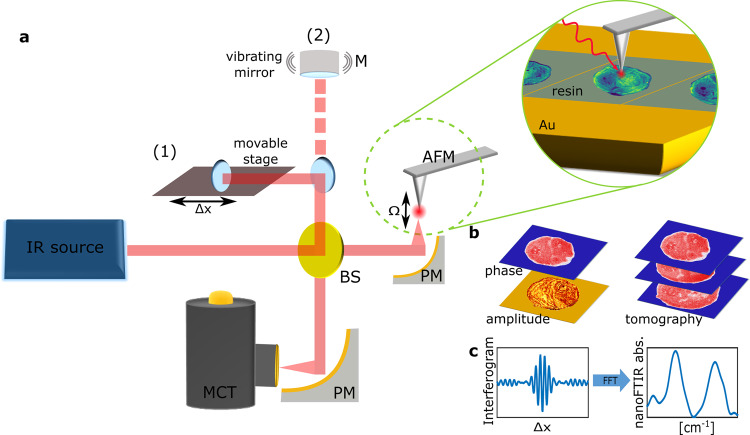
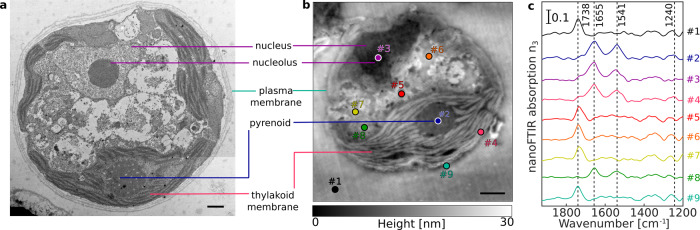
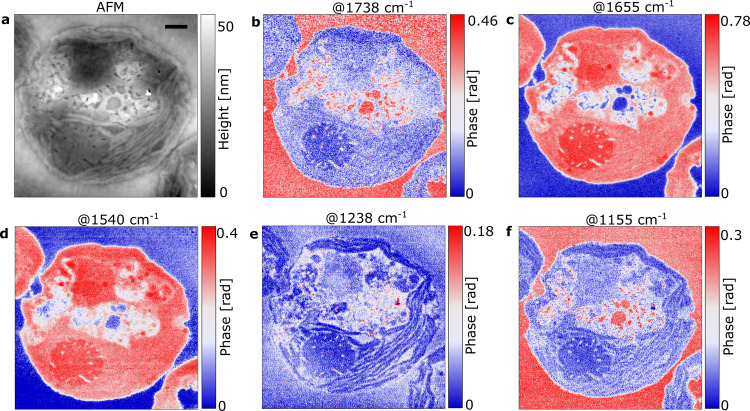
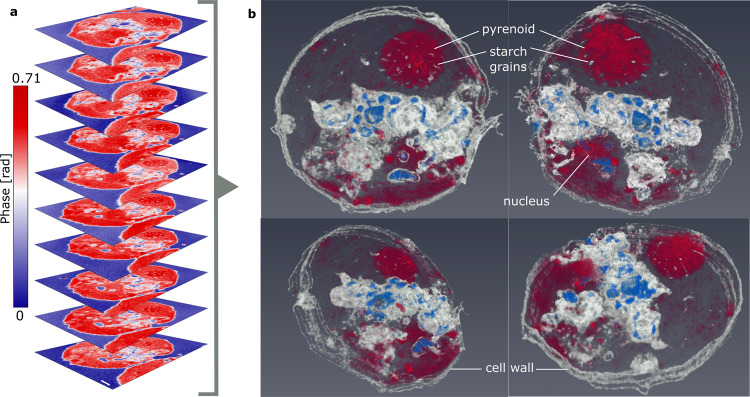
Although techniques such as fluorescence-based super-resolution imaging or confocal microscopy simultaneously gather both morphological and chemical data, these techniques often rely on the use of localized and chemically specific markers. To eliminate this flaw, we have developed a method of examining cellular cross sections using the imaging power of scattering-type scanning near-field optical microscopy and Fourier-transform infrared spectroscopy at a spatial resolution far beyond the diffraction limit. Herewith, nanoscale surface and volumetric chemical imaging is performed using the intrinsic contrast generated by the characteristic absorption of mid-infrared radiation by the covalent bonds. We employ infrared nanoscopy to study the subcellular structures of eukaryotic (Chlamydomonas reinhardtii) and prokaryotic (Escherichia coli) species, revealing chemically distinct regions within each cell such as the microtubular structure of the flagellum. Serial 100 nm-thick cellular cross-sections were compiled into a tomogram yielding a three-dimensional infrared image of subcellular structure distribution at 20 nm resolution. The presented methodology is able to image biological samples complementing current fluorescence nanoscopy but at less interference due to the low energy of infrared radiation and the absence of labeling.


Conflict of interest statement

The authors declare no competing interests.

Figures

Fig. 1
Fig. 1. Operating modes of IR nanoscopy in an asymmetric Michelson interferometer scheme.
a IR radiation, either broadband fs laser for nanoFTIR or QCL for sSNOM, is guided through a beamsplitter (BS) and focused on an oscillating AFM tip via a parabolic mirror (PM). For nanoFTIR (1), the reference arm mirror is mounted on a movable stage. In sSNOM mode (2), the reference arm is equipped with piezo-driven mirror vibrating with frequency M. The scattered light from the tip is recombined with the reflected light from the reference arm at the BS, focused on a mercury-cadmium-telluride (MCT) detector, and fed to a lock-in amplifier. b Simultaneously to AFM imaging, the demodulated sSNOM scattering amplitude and phase are recorded. sSNOM tomography is performed by imaging of serial sections. c The detected interferogram is demodulated at sidebands nΩ ± mM for harmonics n and m of the tip’s resonance frequency Ω and the mirror’s vibration frequency M, respectively. Fast Fourier transformation (FFT) of the interferogram is used to obtain nanoFTIR spectra.
Fig. 2
Fig. 2. Cross-sectional imaging of C. reinhardtii cells.
Cellular cross sections were imaged by TEM (a) and AFM (b). Scale bars equal 1 µm. nanoFTIR absorption spectra (c) were acquired at nine different locations marked on the AFM images.
Fig. 3
Fig. 3. sSNOM phase imaging of a C. reinhardtii cell.
A single cellular cross section was visualized by AFM topography (a) and sSNOM phase imaging at several wavenumbers (bf), with red indicating high and blue indicating low absorption of each respective wavenumber. Scale bar equals 1 µm.
Fig. 4
Fig. 4. Imaging of specific intracellular structures of a C. reinhardtii cell.
The nuclear region is visualized by AFM topography (a) with the scale bar showing 1 µm, sSNOM phase imaging at 1655 cm-1 (b) with the inset showing a line profile across a nuclear body, and sSNOM amplitude (c). The axoneme of the flagellum is similarly visualized using AFM topography (d) with the scale bar showing 100 nm, sSNOM phase imaging at 1656 cm-1 (e) and sSNOM amplitude (f), with the doublet microtubules (green marks) and the radial spokes (blue marks) of the flagellum.
Fig. 5
Fig. 5. sSNOM tomography of a C. reinhardtii section.
Ten sSNOM images of consecutive C. reinhardtii cross sections, recorded at 1656 cm−1 (a) used for the construction of a tomogram (b), shown in four orientations: top right—view from the top, top left — view from the bottom, bottom left—top view tilted, bottom right - bottom view tilted (Supplementary Movie 1). Scale bar equals 1 µm.

References

    1. Yip KM, et al. Atomic-resolution protein structure determination by cryo-EM. Nature. 2020;587:157–161. - PubMed
    1. Sigal YM, Zhou R, Zhuang X. Visualizing and discovering cellular structures with super-resolution microscopy. Science. 2018;361:880–887. - PMC - PubMed
    1. Schermelleh L, et al. Super-resolution microscopy demystified. Nat. Cell Biol. 2019;21:72–84. - PubMed
    1. Faist J, et al. Quantum cascade laser. Science. 1994;264:553–556. - PubMed
    1. Kuepper C, et al. Quantum cascade laser-based infrared microscopy for label-free and automated cancer classification in tissue sections. Sci. Rep. 2018;8:7717. - PMC - PubMed

Publication types

MeSH terms

LinkOut - more resources