. 2021 Nov 20:13:8663-8672.
doi: 10.2147/CMAR.S328451. eCollection 2021.

Gut Microbiota and Sunitinib-Induced Diarrhea in Metastatic Renal Cell Carcinoma: A Pilot Study

Affiliations

Gut Microbiota and Sunitinib-Induced Diarrhea in Metastatic Renal Cell Carcinoma: A Pilot Study

Zhimin Su et al. Cancer Manag Res. .

Abstract

Introduction: Sunitinib-induced diarrhea seriously affects the prognosis of patients with metastatic renal cell carcinoma (mRCC) and reduces their quality of life. We aim to explore and find the relationship between sunitinib-induced diarrhea and gut microbiota.

Methods: Feces were collected from 31 mRCC patients receiving sunitinib treatment. To characterize the feces gut microbiome profiles of patients, the V3-V4 region of 16S rRNA sequencing was carried out in this study.

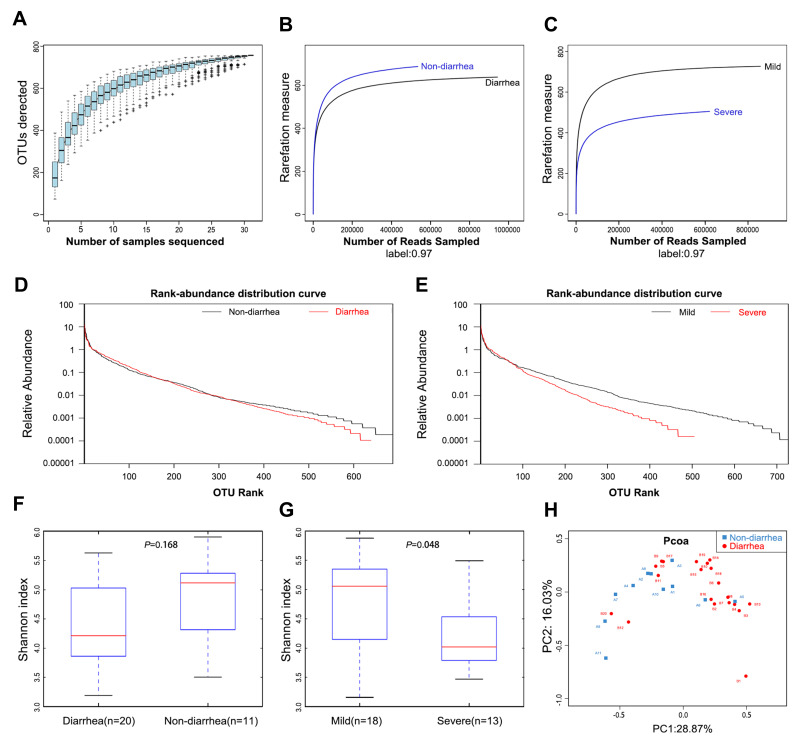
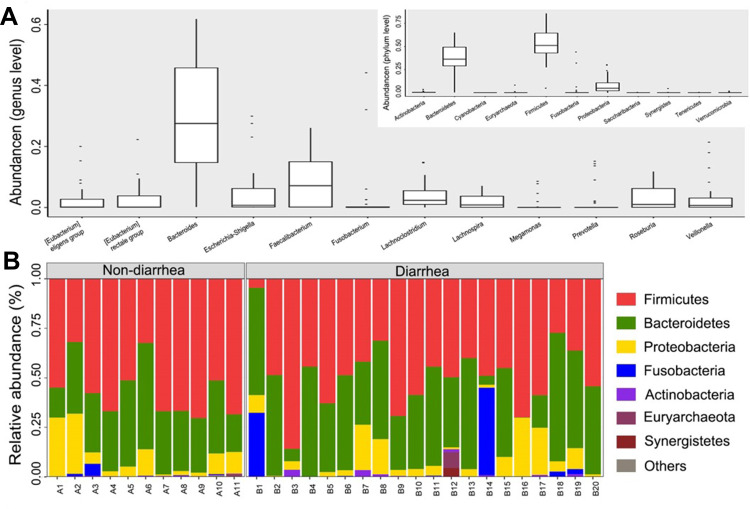
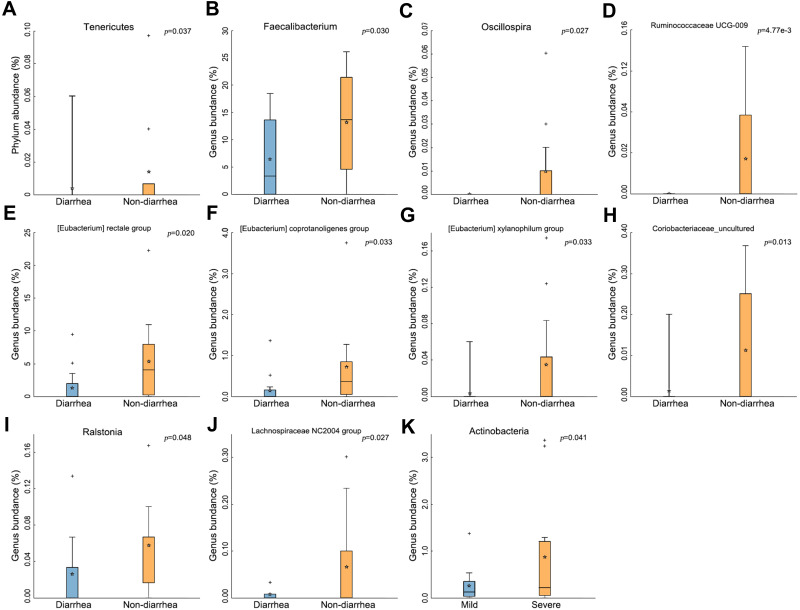
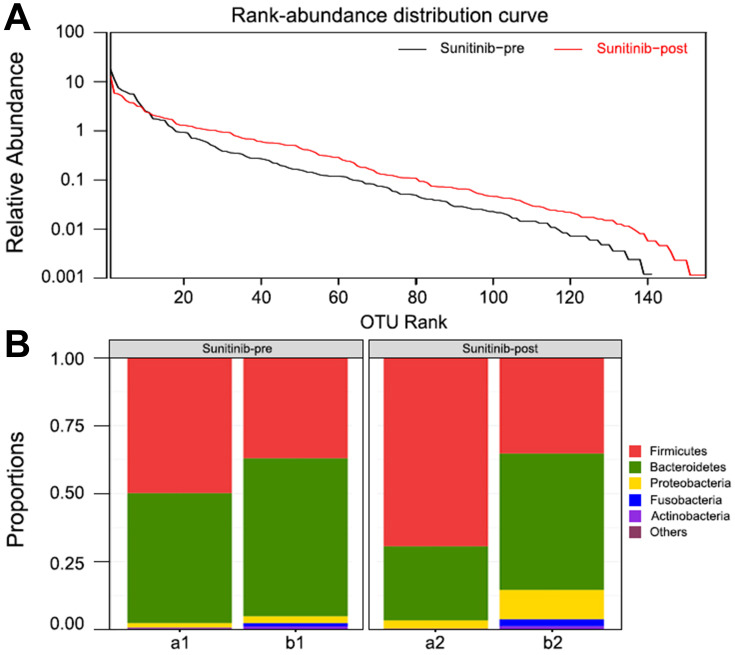
Results: Gut microbial diversity was decreased both in the severe diarrhea group and in the sunitinib-post group. The microbial composition with higher abundance of Bacteroides (mucus degrading bacteria) and lower abundance of Faecalibacterium, Oscillospira, Ruminococcaceae, Eubacterium and Coriobacteriaceae (butyrate-producing bacteria) were found in patients with diarrhea. Interestingly, the abundance of Actinobacteria was decreased in patients receiving sunitinib with severe diarrhea.

Conclusion: This study reported an association between gut microbiota and sunitinib-induced diarrhea. Defects of the butyrate-producing bacteria and the increase in Bacteroides may be the physiological basis of sunitinib-induced diarrhea.

Keywords: 16S rRNA sequencing; butyrate-producing bacteria; gut microbial diversity; sunitinib-induced diarrhea.


Conflict of interest statement

The authors report no conflicts of interest in this work.

Figures

Figure 1
Figure 1
Gut microbiota diversity in patients (n=31). (A) Species accumulation curves became flatter as the sample size increased, indicating that the sample size of this study is adequate. (B) The estimated OTUs richness was significantly decreased from the non-diarrhea group (n=11) to the diarrhea group (n=20). (C) The estimated OTUs richness was significantly decreased in the severe group (n=13). (D) Rank-abundance distribution curves analysis showed that the relative abundance of the diarrhea group was lower than that of the non-diarrhea group. (E) The relative abundance of the severe group decreased compared with the mild group. (F) Gut microbial diversity in the diarrhea group was lower than that in the non-diarrhea group by Shannon analysis. (G) Gut microbial diversity was significantly higher in the severe group than that of in the mild group (p=0.048). (H) PCoA analysis indicated a symmetrical distribution of fecal microbial community among all the samples.
Figure 2
Figure 2
The composition of the microbial community and the predominant classes in two groups. (A) Composition of fecal microbiota at the phylum level and genus level. (B) The predominant classes of microbes in two groups at phylum level. The part of the abundance less than 1% was merged into others when plotting.
Figure 3
Figure 3
The change of gut microbiota in the diarrhea group. (A) Tenericutes significantly decreased in the diarrhea group (p=0.037). (BJ) Types of bacteria reduced in diarrhea group. (K) Less Actinobacteria was found in the severe group (p=0.041). The box presented 95% CIs; the line inside denotes the median, and the symbol “+” denotes the mean value.
Figure 4
Figure 4
The change of bacteria displayed by LDA analysis. (A) Cladogram. The red and green nodes in the branches represented the microbiota that play an important role in the corresponding groups, respectively, while the yellow nodes represented the microbiota that do not play an important role in the two groups. (B) The LDA scores obtained by LDA analysis for the significant microbial communities in the two groups. The red and green regions indicated the abundance of different microbes.
Figure 5
Figure 5
Bacteroides in patients with sunitinib. (A) Rank-abundance distribution curve. The bacterial diversity increased after sunitinib treatment. (B) Microbial community composition of patients before and after treatment. The abundance of Bacteroides was decreased in patients with sunitinib.

Similar articles

Cited by

References

    1. Siegel RL, Miller KD, Jemal A. Cancer statistics, 2017. CA Cancer J Clin. 2017;67(1):7–30. doi: 10.3322/caac.21387 - DOI - PubMed
    1. Ravaud A, Motzer RJ, Pandha HS, et al. Adjuvant sunitinib in high-risk renal-cell carcinoma after nephrectomy. N Engl J Med. 2016;375(23):2246–2254. doi: 10.1056/NEJMoa1611406 - DOI - PubMed
    1. Escudier B, Porta C, Schmidinger M, et al. Renal cell carcinoma: ESMO clinical practice guidelines for diagnosis, treatment and follow-up. Ann Oncol. 2016;27(suppl 5):v58–58v68. doi: 10.1093/annonc/mdw328 - DOI - PubMed
    1. Rini BI, Escudier B, Tomczak P, et al. Comparative effectiveness of axitinib versus sorafenib in advanced renal cell carcinoma (AXIS): a randomised Phase 3 trial. Lancet. 2011;378(9807):1931–1939. doi: 10.1016/S0140-6736(11)61613-9 - DOI - PubMed
    1. Sh Z. Adjuvant Sunitinib in Renal-Cell Carcinoma. N Engl J Med. 2017;376(9):893. - PubMed