

Correlating Neuroimaging and CNVs Data: 7 Years of Cytogenomic Microarray Analysis on Patients Affected by Neurodevelopmental Disorders
- PMID: 34849274
- PMCID: PMC8608469
- DOI: 10.1055/s-0040-1716398
Correlating Neuroimaging and CNVs Data: 7 Years of Cytogenomic Microarray Analysis on Patients Affected by Neurodevelopmental Disorders
Abstract
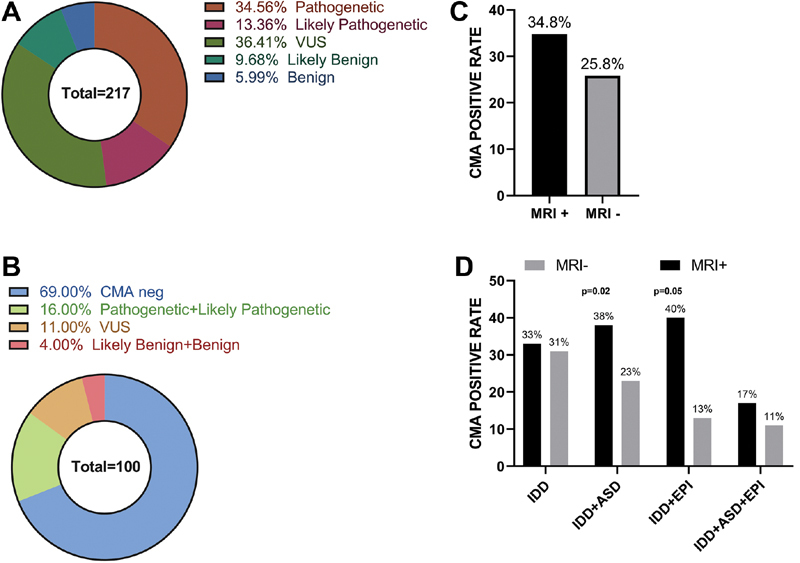
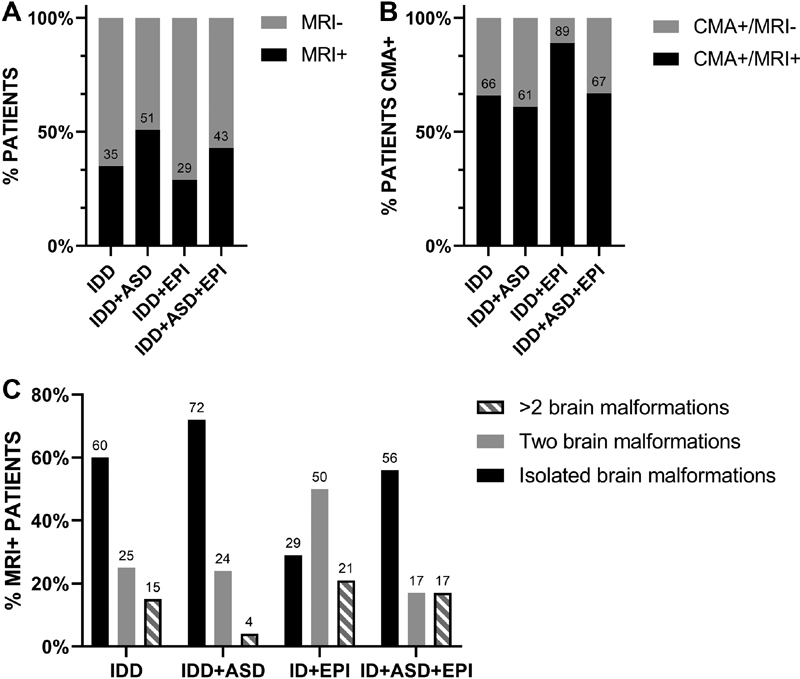
The aim of this study was to evaluate the relationship between neurodevelopmental disorders, brain anomalies, and copy number variations (CNVs) and to estimate the diagnostic potential of cytogenomical microarray analysis (CMA) in individuals neuroradiologically characterized with intellectual developmental disorders (IDDs) isolated or associated with autism spectrum disorders (ASDs) and epilepsy (EPI), all of which were identified as a "synaptopathies." We selected patients who received CMA and brain magnetic resonance imaging (MRI) over a 7-year period. We divided them into four subgroups: IDD, IDD + ASD, IDD + EPI, and IDD + ASD + EPI. The diagnostic threshold of CMA was 16%. The lowest detection rate for both CMA and brain anomalies was found in IDD + ASD, while MRI was significantly higher in IDD and IDD + EPI subgroups. CMA detection rate was significantly higher in patients with brain anomalies, so CMA may be even more appropriate in patients with pathological MRI, increasing the diagnostic value of the test. Conversely, positive CMA in IDD patients should require an MRI assessment, which is more often associated with brain anomalies. Posterior fossa anomalies, both isolated and associated with other brain anomalies, showed a significantly higher rate of CMA positive results and of pathogenic CNVs. In the next-generation sequencing era, our study confirms once again the relevant diagnostic output of CMA in patients with IDD, either isolated or associated with other comorbidities. Since more than half of the patients presented brain anomalies in this study, we propose that neuroimaging should be performed in such cases, particularly in the presence of genomic imbalances.
Keywords: autism spectrum disorders; brain anomalies; epilepsy; intellectual developmental disorders; synaptopathies.
Thieme. All rights reserved.
Conflict of interest statement
Conflict of Interest None declared.
Figures

Similar articles
-
Chromosomal Microarray Analysis in Turkish Patients with Unexplained Developmental Delay and Intellectual Developmental Disorders.Noro Psikiyatr Ars. 2020 May 5;57(3):177-191. doi: 10.29399/npa.24890. eCollection 2020 Sep. Noro Psikiyatr Ars. 2020. PMID: 32952419 Free PMC article.
-
Confirmation of chromosomal microarray as a first-tier clinical diagnostic test for individuals with developmental delay, intellectual disability, autism spectrum disorders and dysmorphic features.Eur J Paediatr Neurol. 2013 Nov;17(6):589-99. doi: 10.1016/j.ejpn.2013.04.010. Epub 2013 May 24. Eur J Paediatr Neurol. 2013. PMID: 23711909
-
Chromosomal Microarray Analysis of Consecutive Individuals with Autism Spectrum Disorders Using an Ultra-High Resolution Chromosomal Microarray Optimized for Neurodevelopmental Disorders.Int J Mol Sci. 2016 Dec 9;17(12):2070. doi: 10.3390/ijms17122070. Int J Mol Sci. 2016. PMID: 27941670 Free PMC article.
-
The Cytoscan HD Array in the Diagnosis of Neurodevelopmental Disorders.High Throughput. 2018 Sep 14;7(3):28. doi: 10.3390/ht7030028. High Throughput. 2018. PMID: 30223503 Free PMC article. Review.
-
Chromosomal Microarrays: Understanding Genetics of Neurodevelopmental Disorders and Congenital Anomalies.J Pediatr Genet. 2017 Mar;6(1):42-50. doi: 10.1055/s-0036-1584306. Epub 2016 May 30. J Pediatr Genet. 2017. PMID: 28180026 Free PMC article. Review.
References
-
- American Psychiatric Association . 5th ed. American Psychiatric Association; Washington, DC: 2013. Diagnostic and Statistical Manual of Mental Disorders.
-
- Greenspan S. Borderline intellectual functioning: an update. Curr Opin Psychiatry. 2017;30(02):113–122. - PubMed
-
- Khan M A, Khan S, Windpassinger C, Badar M, Nawaz Z, Mohammad R M. The molecular genetics of autosomal recessive nonsyndromic intellectual disability: a mutational continuum and future recommendations. Ann Hum Genet. 2016;80(06):342–368. - PubMed
-
- Leonard H, Wen X. The epidemiology of mental retardation: challenges and opportunities in the new millennium. Ment Retard Dev Disabil Res Rev. 2002;8(03):117–134. - PubMed
LinkOut - more resources
Full Text Sources
