. 2021:1:25.
doi: 10.1038/s43586-021-00021-6. Epub 2021 Mar 25.

Optical tweezers in single-molecule biophysics

Affiliations

Optical tweezers in single-molecule biophysics

Carlos J Bustamante et al. Nat Rev Methods Primers. 2021.

Abstract

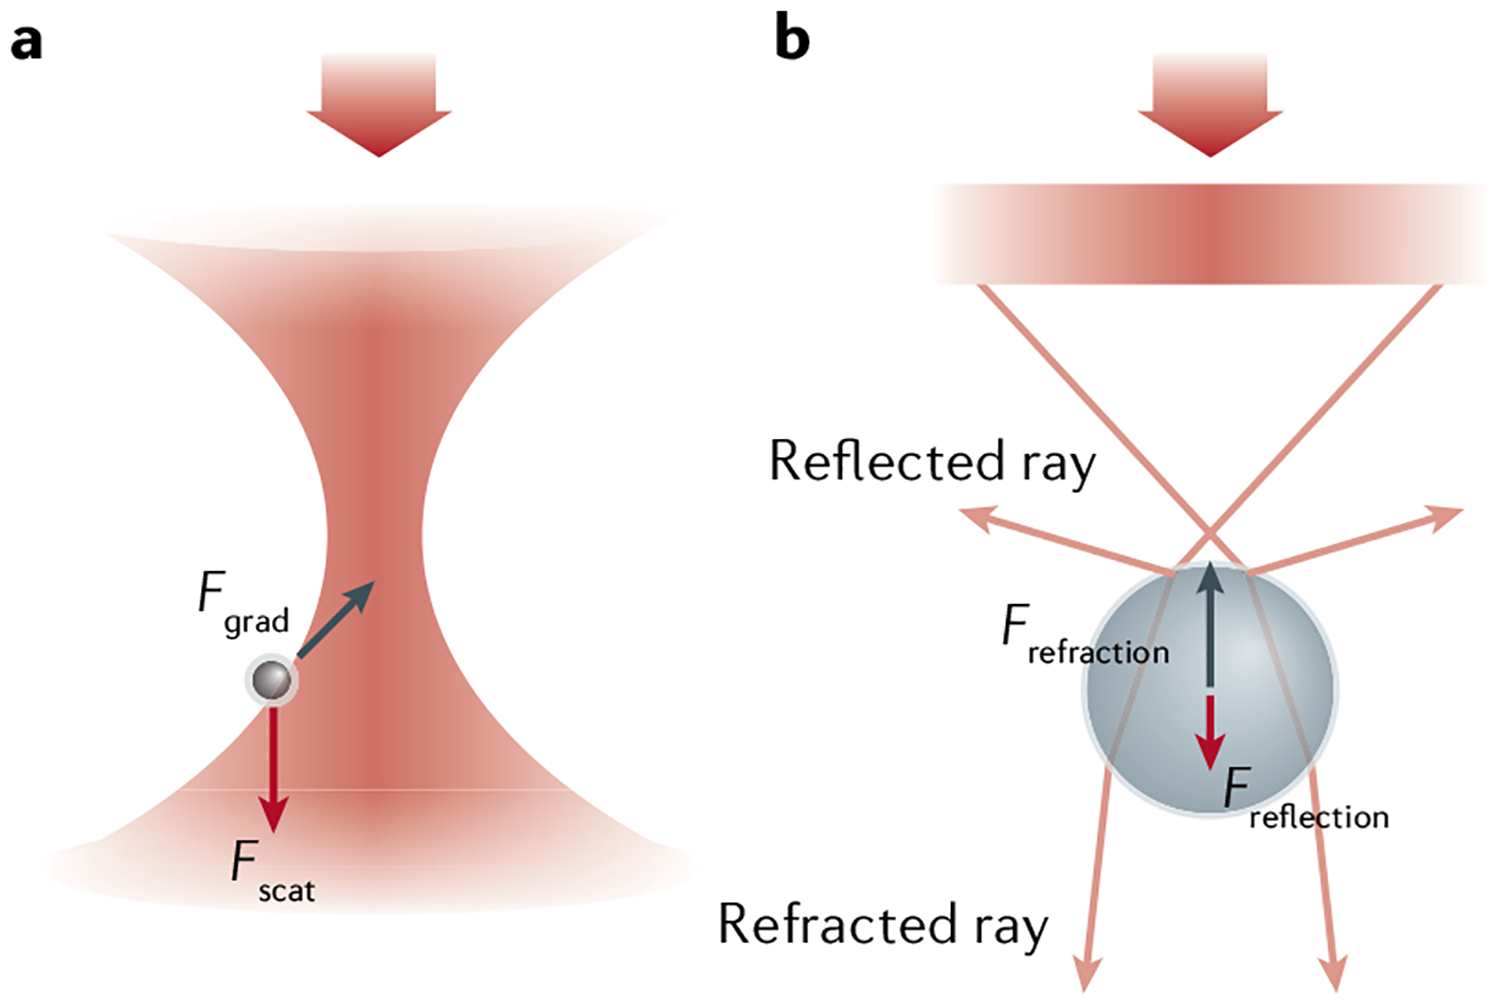
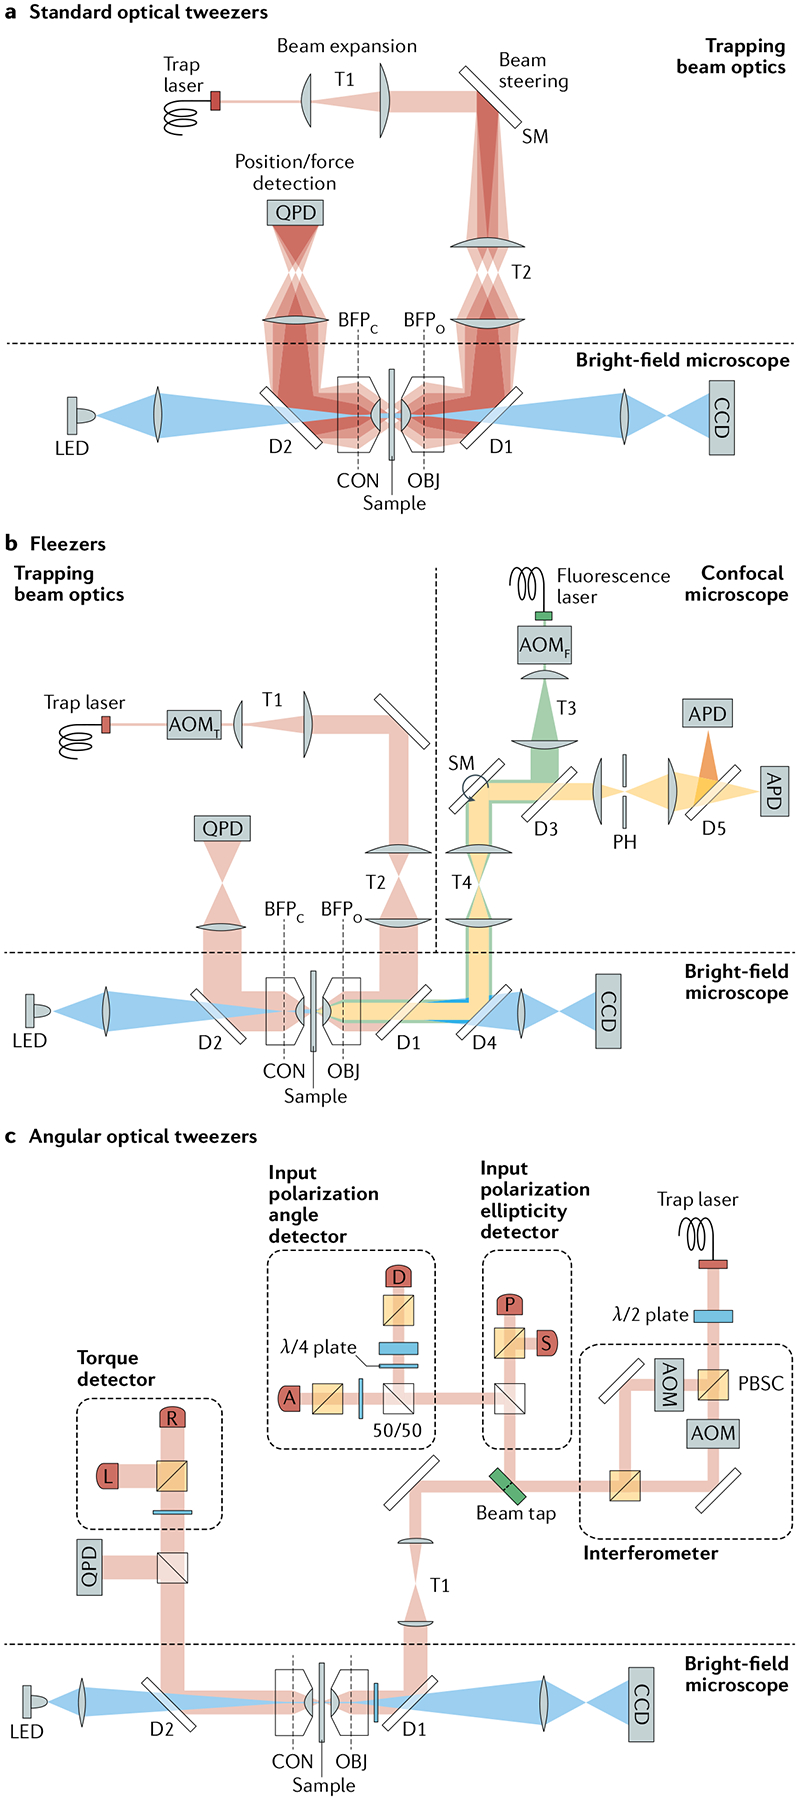
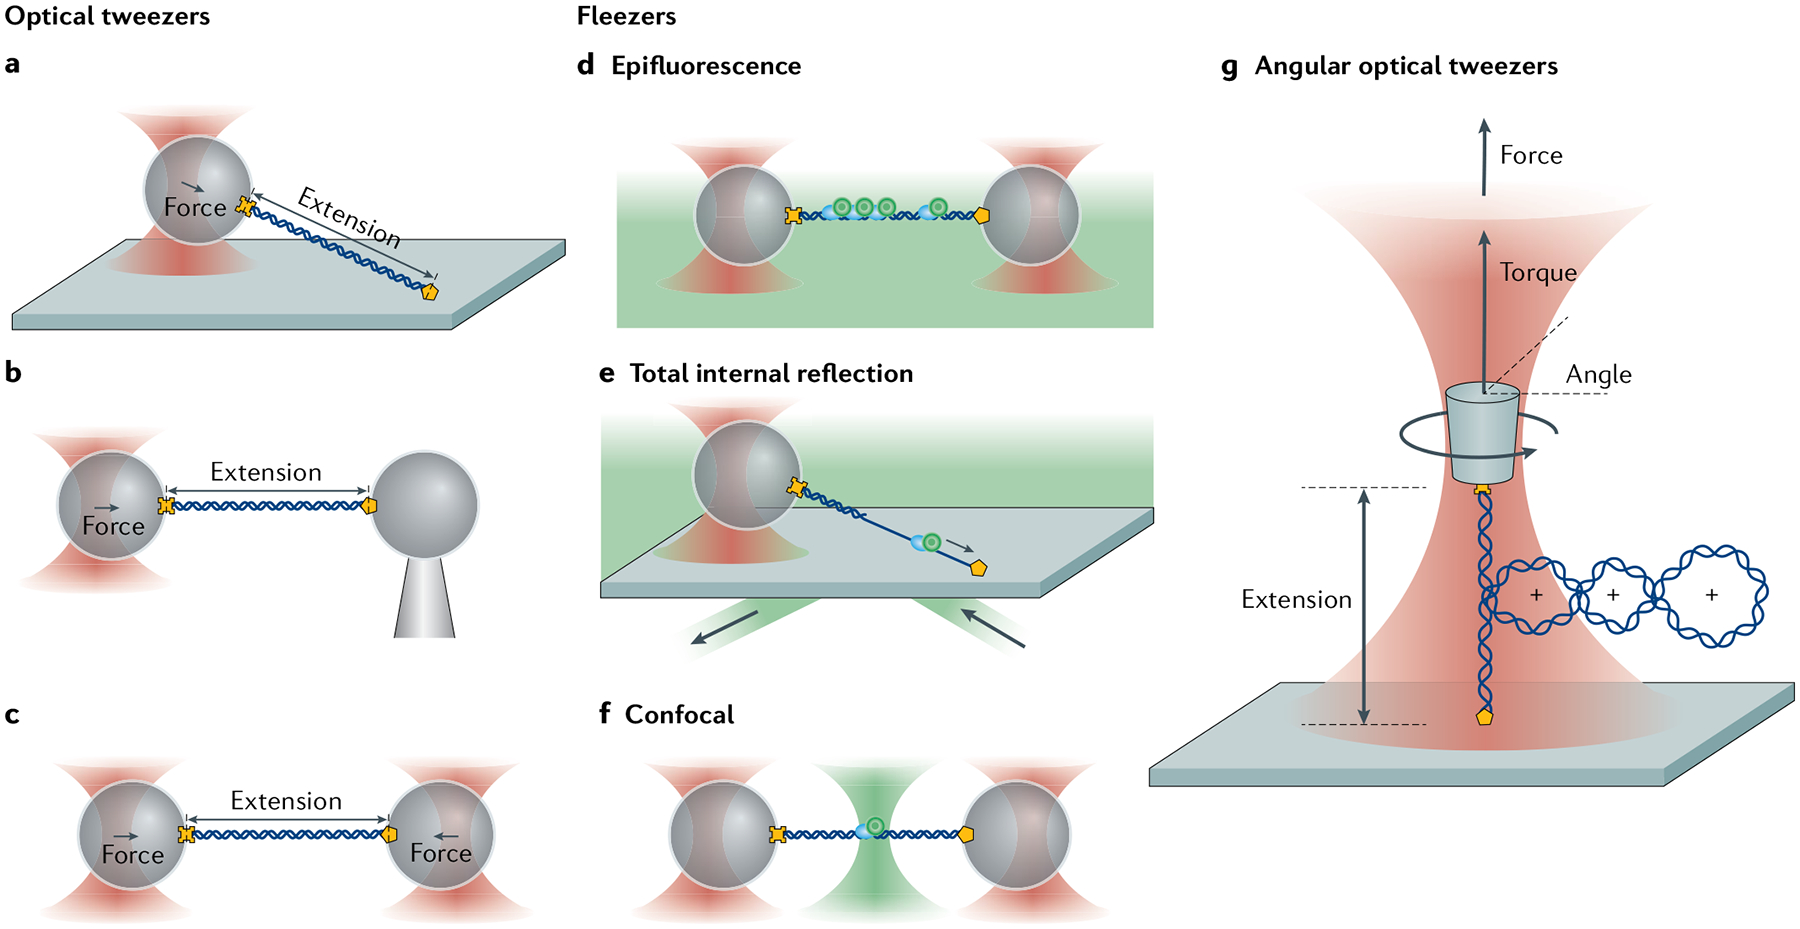
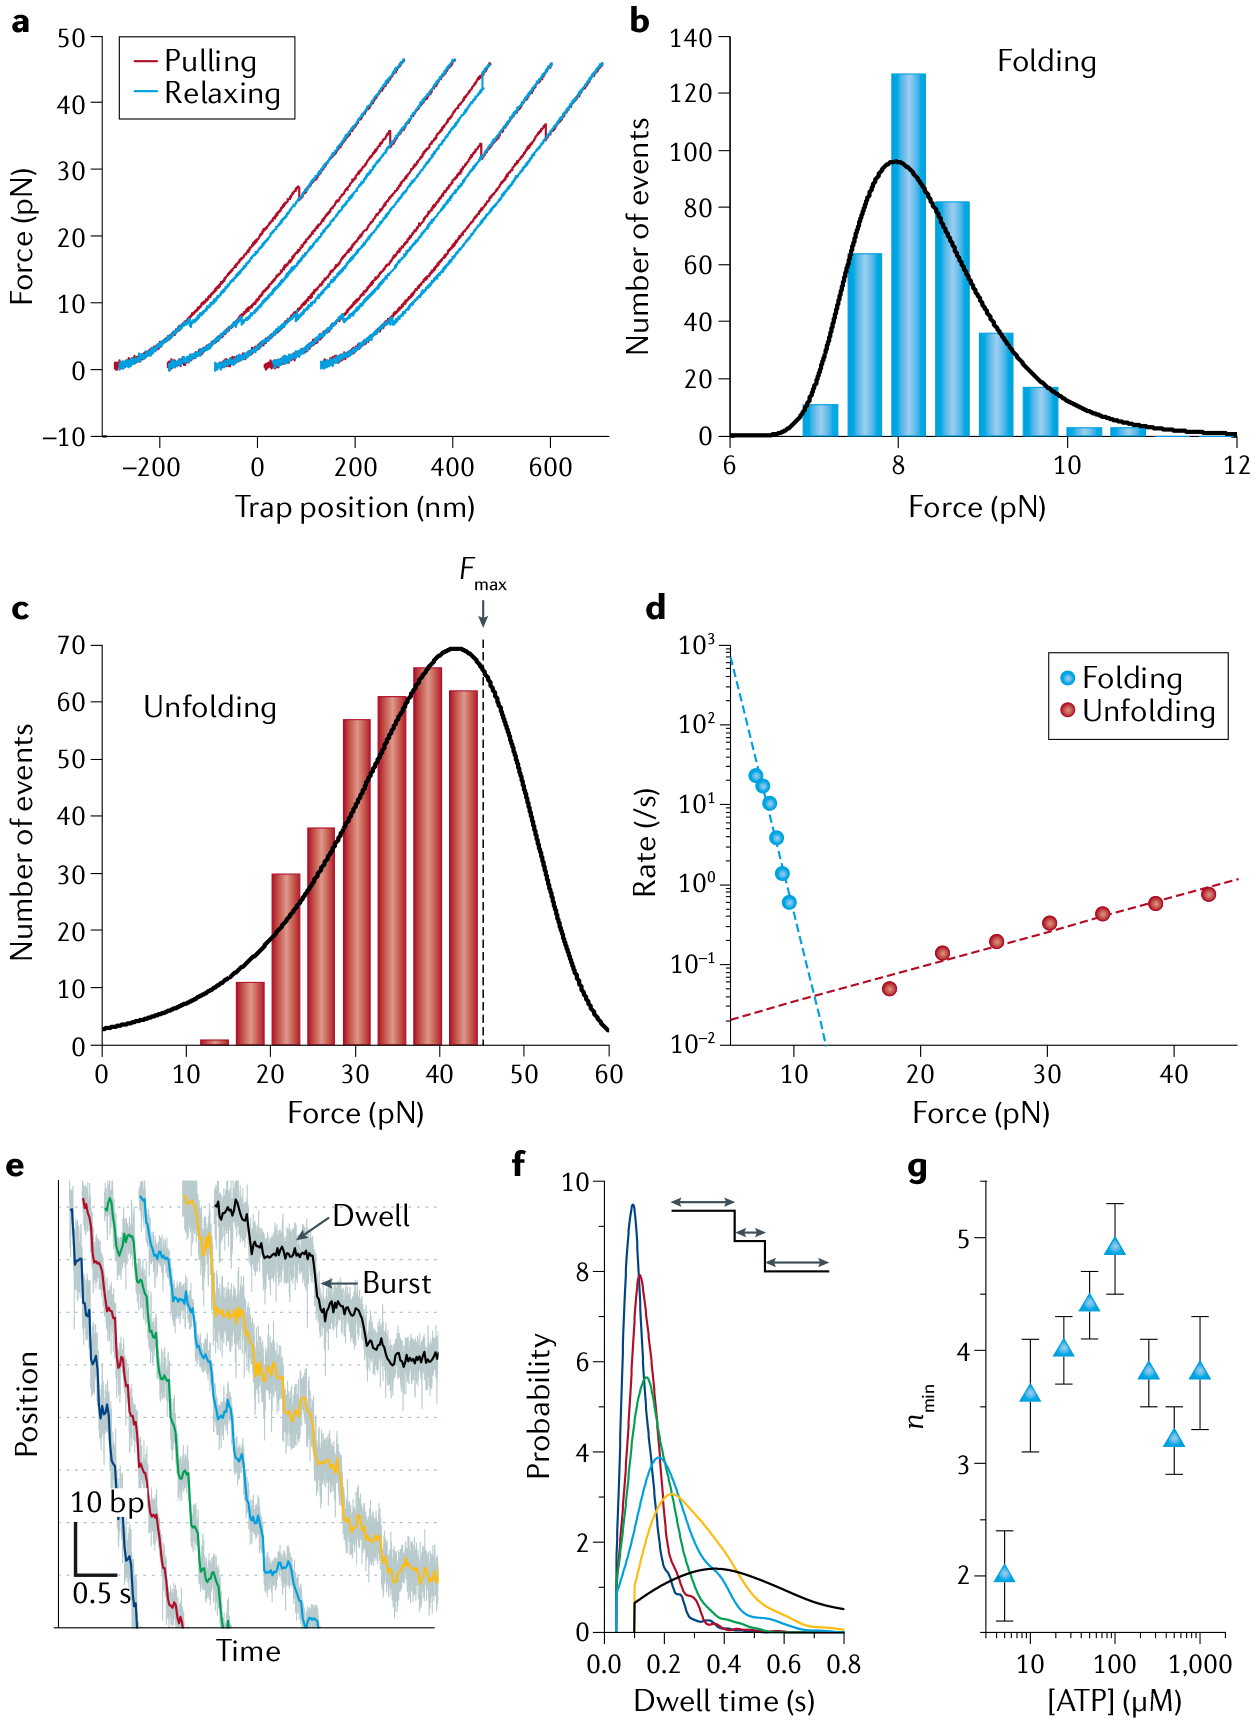
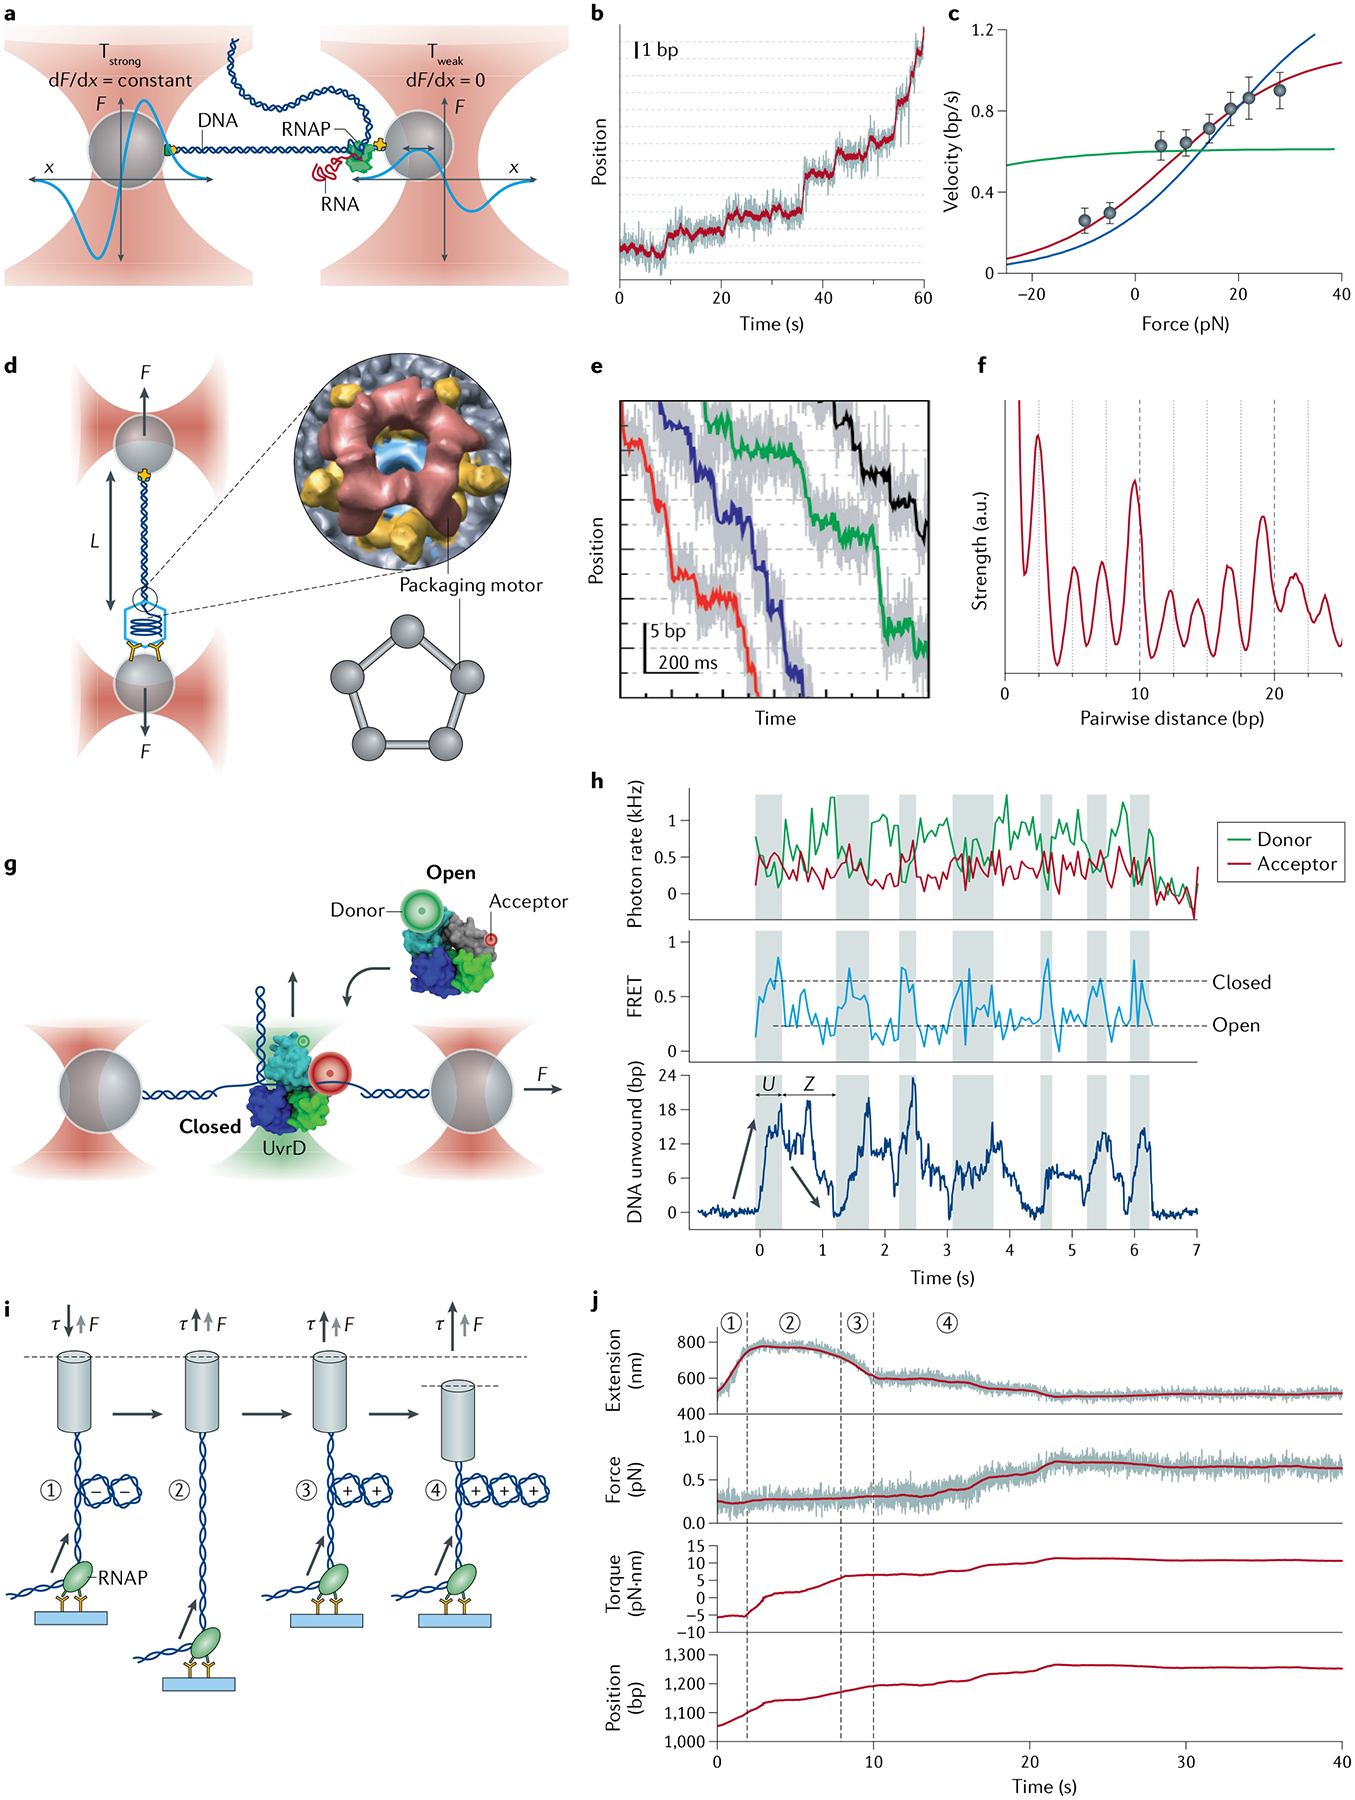
Optical tweezers have become the method of choice in single-molecule manipulation studies. In this Primer, we first review the physical principles of optical tweezers and the characteristics that make them a powerful tool to investigate single molecules. We then introduce the modifications of the method to extend the measurement of forces and displacements to torques and angles, and to develop optical tweezers with single-molecule fluorescence detection capabilities. We discuss force and torque calibration of these instruments, their various modes of operation and most common experimental geometries. We describe the type of data obtained in each experimental design and their analyses. This description is followed by a survey of applications of these methods to the studies of protein-nucleic acid interactions, protein/RNA folding and molecular motors. We also discuss data reproducibility, the factors that lead to the data variability among different laboratories and the need to develop field standards. We cover the current limitations of the methods and possible ways to optimize instrument operation, data extraction and analysis, before suggesting likely areas of future growth.


Conflict of interest statement

Competing interests The authors declare no competing interests.

Figures

Fig. 1 |
Fig. 1 |. Principles of optical tweezers.
Forces acting on a dielectric sphere interacting with light, with the incident light beam focused by a high-numerical aperture (NA) lens. a | A Rayleigh particle smaller than the wavelength of light experiences a scattering force (Fscat, red arrow) that pushes the particle along the direction of propagation of the light and a gradient force (Fgrad, black arrow) that attracts it towards the focus. b | A dielectric sphere larger than the wavelength of light either reflects or refracts light (pink arrows) focused by a high-NA lens. The change in direction of each ray corresponds to a change in momentum of the light and an equal and opposite change in bead momentum. Reflected rays of light lose forward momentum that is gained by the bead, leading to a net force (Freflection, red arrow) pushing the bead along the direction of propagation of the light. Refracted rays are deflected forward because of the high incidence angle of the light, which generates momentum change and reactive force (Frefraction, black arrow) that pulls the bead towards the focus.
Fig. 2 |
Fig. 2 |. Basic designs of optical traps.
a | Optical layout of a standard single-beam optical trap. A high-power laser generates the trapping beam (pink), which is expanded by telescope T1. Beam-steering optics (here, a steerable mirror (SM)) control the tilt in the beam axis. A high-numerical aperture objective (OBJ) focuses the trapping beam into the sample. T2 images the steering plane (at SM) onto the objective back focal plane (BFPO), so that tilting the beam displaces the trap in the sample plane. A condenser (CON) collects the light scattered by the trapped particle. A lens images the light at the condenser back focal plane (BFPC) onto a position-sensitive quadrant photodetector (QPD) for position/force detection. Two dichroic mirrors (D1 and D2) reflect the trapping beam and transmit visible light (blue) for bright-field illumination (light-emitting diode (LED)) and imaging (charge-coupled device (CCD)) of the sample plane. b | Optical layout for a representative fleezers set-up (dual traps with a confocal microscope). A fluorescence excitation beam (green) is expanded (T3) and directed (D3, SM, T4, D4) into the trapping OBJ. The OBJ focuses the beam to a diffraction-limited spot on the sample plane and collects light emitted within the spot. The excitation spot is displaced in the sample plane by a SM. The emitted light (yellow) travels back along the emission path, passing through a dichroic mirror (D3) and into a pinhole aperture (PH) to reject out-of-focus light. Emission light is detected by an avalanche photodiode (APD) (or by two APDs for Förster resonance energy transfer measurements). The trapping and fluorescence excitation beams are interlaced by two out-of-phase acousto-optic modulators (AOMT and AOMF, respectively). The trap layout is similar to that shown in part a, with dual traps generated by time-sharing using AOMT. c | Representative optical layout of angular optical tweezers. The trapping laser is linearly polarized and split equally into two orthogonally polarized beams at a polarization beam splitter cube (PBSC). Each beam then passes through an AOM, and the two beams are recombined at another PBSC. Prior to the objective, the ellipticity of the laser is measured by the ‘input polarization ellipticity detector’ via photodetectors P and S, while the polarization angle is measured by the ‘input polarization angle detector’ via photodetectors A and D. After the laser interacts with a trapped cylinder in the sample plane, the transmitted laser becomes elliptically polarized, and the optical torque is measured by the ‘torque detector’ via photodetectors R and L. The force on the cylinder is measured by a QPD.
Fig. 3 |
Fig. 3 |. Measurement geometries of standard optical traps, fleezers and angular optical traps.
ac | Common optical trapping geometries Single-trap, surface-based geometry where a molecule (here, DNA) functionalized at both ends (yellow cross and pentagon) is tethered between a trapped bead and the sample chamber surface (part a). Single-trap, micropipette-based geometry where the molecule is attached to a trapped bead and a second bead held by suction on the end of a micropipette (part b). Dual-trap geometry where the molecule is tethered between two trapped beads (part c). df | Example fleezers configurations Dual traps with wide-field, epifluorescence microscopy, where excitation light bathes the specimen plane and fluorescence is collected from dyes (green circles) emitting in the focal plane (part d). Single trap with total internal reflection fluorescence microscopy, where excitation occurs at the chamber surface, in an exponentially decaying evanescent field (typically ~100–200 nm in depth) (part e). Dual traps with confocal fluorescence microscopy, where the excitation light is focused into a diffraction-limited spot inside the sample chamber, and only light emitted from within the spot is collected (part f). g | Basic operational geometry of angular optical tweezers (AOT),. In AOT, a nanofabricated quartz cylinder is trapped. Shown is an example where the AOT are used to investigate the torsional properties of a DNA molecule by twisting the DNA. During this measurement, the AOT exert and measure torque, control rotation and supercoiling, and measure the displacement and force of the trapped cylinder, all at the same time.
Fig. 4 |
Fig. 4 |. Example optical trapping data.
a | Force-ramp cycles of Top7, a de novo designed protein. Successive pulling (red) and relaxing (blue) cycles are offset along the x axis for clarity. b,c | Folding and unfolding force distributions, respectively, of Top7 at a pulling speed of 100 nm/s. Black lines are distributions derived from model fitting in part d. The unfolding distribution in part c is right-censored because the maximum force (Fmax) was set at 45 pN during pulling experiments to avoid tether rupture. d | Force-dependent rates of unfolding (red dots) and refolding (blue dots) extracted from the corresponding force distributions in parts b and c. Dashed lines are fits to Bell’s model. e | Representative trajectories showing the processive translocation of individual φ29 packaging motors on double-stranded DNA (dsDNA) under a constant force of ~8 pN and different [ATP] (250 μM, 100 μM, 50 μM, 25 μM, 10 μM and 5 μM in blue, red, green, cyan, yellow and black, respectively). Each translocation cycle is composed of a stationary dwell phase and a stepping burst phase. f | Probability distributions of the lifetimes of the dwell phase at different [ATP]. Colour scheme as in part e. g | Values of nmin, the minimum number of rate-limiting kinetic events during the dwell, derived from the dwell time distributions for different [ATP]. Parts ad adapted with permission from REF., AAAS. Parts eg adapted from REF., Springer Nature Limited.
Fig. 5 |
Fig. 5 |. Example fluorescence-trap data.
a | Dual-trap plus epifluorescence configuration, showing labelled RAD51 bound to DNA (DNA functionalized at both ends (yellow cross and pentagon) and fluorescence collected from dye (green circles)). b | Kymograph of a RAD51–double-stranded DNA (dsDNA) complex, held at fixed length, triggered to disassemble. c | Fluorescence intensity (red) decreases as tension (blue) increases owing to disassembly-induced DNA contraction. d | Dual-trap plus confocal configuration, showing a ribosome opening a messenger RNA (mRNA) hairpin and labelled elongation factor G (EF-G) binding. e | Time trace of ribosome translocation in one-codon steps separated by dwells of duration τdwell (red) with simultaneous fluorescence intensity (green) indicating binding and dissociation of EF-G. Average EF-G residence times before mRNA unwinding (τunwinding) and after unwinding (τrelease) are displayed for a weak hairpin at high force. f | Surface-based, single-trap plus confocal configuration, showing a single nucleosome bound to Förster resonance energy transfer (FRET)-labelled DNA under force. g | Resulting FRET decrease versus force as the nucleosome is unravelled mechanically. Parts b and c adapted from REF., Springer Nature Limited. Parts d and e adapted with permission from REF., Elsevier. Parts f and g adapted with permission from REF., Elsevier.
Fig. 6 |
Fig. 6 |. Example angular optical tweezers data.
a | Experimental configuration for torsional measurements of a chromatin fibre. Angular optical tweezers are used to twist a chromatin fibre at 4 turns/s, while holding the chromatin fibre under a constant force of 0.5 pN. b | Resulting extension. c | Resulting torque. Measurements are conducted on chromatin fibres containing different numbers of nucleosomes. Extension and torque signals are smoothed by sliding windows of 1 turn and 4 turns, respectively. Torsional properties of each type of substrate may be determined from the torque–turn relation. Adapted with permission from REF., Elsevier.
Fig. 7 |
Fig. 7 |. Example applications of optical tweezers to study protein–DNA interactions.
a | By stretching a double-stranded DNA (dsDNA) molecule, RNA polymerase (RNAP) is tracked in real time and stalled under an applied load. t1, t2 and t3 represent three successive time points as the bead is pulled from the trap centre. b | By unzipping a dsDNA molecule, RNAP, which is trailed by another motor, Mfd, is tracked in real time. c | By twisting two dsDNA molecules via a combination of optical tweezers and a micropipette, a DNA braid is formed and used to study topoisomerase relaxation. d | By combining fluorescence detection and force manipulation, the replicative helicase CMG is observed to dynamically transition between single-stranded DNA (ssDNA) and dsDNA.
Fig. 8 |
Fig. 8 |. Example applications of optical tweezers to study protein folding.
a | Experimental geometry and representative force–extension curves for studying the folding and unfolding of single calmodulin molecules. Stretch and relax cycles are shown in blue and red, respectively. b | Traces of wild-type calmodulin showing folding/unfolding transitions at different preset forces. Data taken in a passive mode. As the preset force increases, the equilibrium is tilted from the native folded state (yellow, all four EF hands folded, F1234) to the unfolded state (red). Four intermediates (blue, F123 folded; cyan, F12 or amino-terminal domain folded; green, F34 or carboxy-terminal domain folded; orange, F23 folded) are also populated in a force-dependent manner. Gaussian fits to histograms of each state are shown on the left. c | Force–extension curves for studying the misfolding of prion protein (PrP) dimers. Unfolding (blue) and refolding (red) curves show the formation of stable non-native structures, in contrast to the expected sequential unfolding of independently folded native domains (inset). d | Transition path time (ttp) for misfolding measured from constant-force trajectories. Barrier region defined by boundaries X1 and X2 (REF.). e | Left: experimental geometry for studying the PrP dimers. Right: experimental geometry for studying co-translational folding. DNA handles are attached to the N terminus of the nascent chain and the ribosome itself. f | Example trajectory of real-time translation elongation. The force decreases as the tether gets longer. Blue dashed line corresponds to the codon position where folding would begin under equilibrium conditions. Inset: zoom image showing the folding transitions. ID1, first dimer intermediate state; M, misfolded state; mRNA, messenger RNA; τ, non-equilibrium delay prior to folding; U, unfolded state. Parts a and b adapted with permission from REF., AAAS. Parts c, d and e (left panel) adapted with permission from REF., PNAS. Parts e (right panel) and f adapted from REF., Springer Nature Limited.
Fig. 9 |
Fig. 9 |. Example applications of optical tweezers to study molecular motors.
a | Dual-trap optical tweezers set-up for observing the stepping behaviour of Escherichia coli RNA polymerase (RNAP). Schematic force (F) versus position (x) profiles for both traps are shown in cyan. A passive force clamp is maintained in the weak trap (Tweak) on the right. b | Representative trajectory showing a single RNAP translocating on its DNA template in discrete steps. Dotted lines are spaced at 3.4-Å (1-bp) intervals. c | Force–velocity relationship for RNAP at [NTP]eq = 10 μM GTP, 10 μM UTP, 5 μM ATP and 2.5 μM CTP. Fits to a power stroke model (green), a linear Brownian ratchet model (blue) and a branched Brownian ratchet model (red) are shown. d | Dual-trap optical tweezers set-up for studying DNA packaging by the bacteriophage φ29 packaging motor, a pentameric ring ATPase. The DNA tether length (L) is monitored as a function of time. e | Representative single-molecule packaging trajectories collected with 250 μM ATP and an external force of ~40 pN. Dotted lines are spaced at 2.5-bp intervals. f | Pairwise distance distribution (PWD) averaged from many packaging trajectories indicates the motor’s step size. g | Fleezers set-up for studying the conformational dynamics and DNA unwinding behaviour of the E. coli UvrD helicase. h | Simultaneous measurements of donor/acceptor fluorescence, Förster resonance energy transfer (FRET) efficiency and number of DNA base pairs unwound enable direct correlation of the conformational states of UvrD (‘Open’ and ‘Closed’) with the motor’s helicase activity (rezipping ‘Z’ and unwinding ‘U’). i | Angular optical tweezers (AOT) set-up for studying the transcriptional dynamics of the E. coli RNAP under torsion. j | Representative data of simultaneous force (F), torque (τ) and extension measurements. Under a low-force clamp, RNAP translocation first neutralizes the preformed (−) plectoneme and then induces the formation of (+) plectoneme. After the force clamp is turned off, RNAP continues to translocate along the DNA template, resulting in an increase in force and the corresponding torque until reaching a stall. Parts ac adapted from REF., Springer Nature Limited. Parts df adapted with permission from REF., Elsevier. Parts g and h adapted with permission from REF., AAAS. Parts i and j adapted with permission from REF., AAAS.

References

    1. Ashkin A Acceleration and trapping of particles by radiation pressure. Phys. Rev. Lett 24, 156 (1970). - PubMed
    1. Ashkin A, Dziedzic JM, Bjorkholm JE & Chu S Observation of a single-beam gradient force optical trap for dielectric particles. Opt. Lett 11, 288 (1986). - PubMed
    2. This study provides the first demonstration of a single-beam optical trap that has since been commonly used in single-molecule biophysics.

    1. Ashkin A, Dziedzic JM & Yamane T Optical trapping and manipulation of single cells using infrared laser beams. Nature 330, 769–771 (1987). - PubMed
    1. Neuman KC & Nagy A Single-molecule force spectroscopy: optical tweezers, magnetic tweezers and atomic force microscopy. Nat. Methods 5, 491–505 (2008). - PMC - PubMed
    1. Jones PH, Marago OM & Volpe G Optical Tweezers: Principles and Applications (Cambridge Univ. Press, 2015).

LinkOut - more resources