

Clinical and biomarker modifiers of vitamin D treatment response: the Multi-Ethnic Study of Atherosclerosis
- PMID: 34849546
- PMCID: PMC8895207
- DOI: 10.1093/ajcn/nqab390
Clinical and biomarker modifiers of vitamin D treatment response: the Multi-Ethnic Study of Atherosclerosis
Abstract
Background: Different 25-hydroxyvitamin D [25(OH)D] thresholds for treatment with vitamin D supplementation have been suggested and are derived almost exclusively from observational studies. Whether other characteristics, including race/ethnicity, BMI, and estimated glomerular filtration rate (eGFR), should also influence the threshold for treatment is unknown.
Objectives: The aim was to identify clinical and biomarker characteristics that modify the response to vitamin D supplementation.
Methods: A total of 666 older adults in the Multi-Ethnic Study of Atherosclerosis (MESA) were randomly assigned to 16 wk of oral vitamin D3 (2000 IU/d; n = 499) or placebo (n = 167). Primary outcomes were changes in serum parathyroid hormone (PTH) and 1,25-dihydroxyvitamin D [1,25(OH)2D] concentrations from baseline to 16 wk.
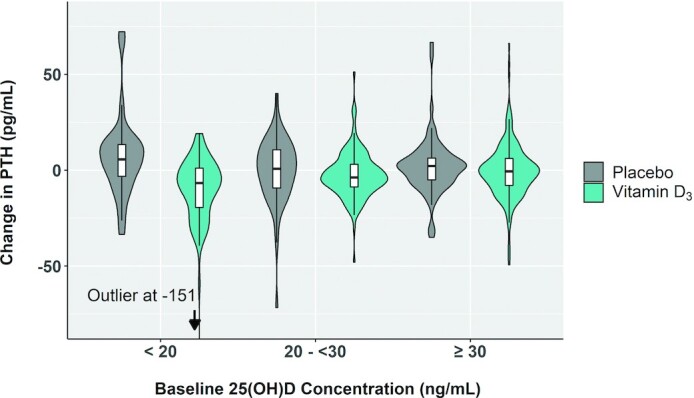
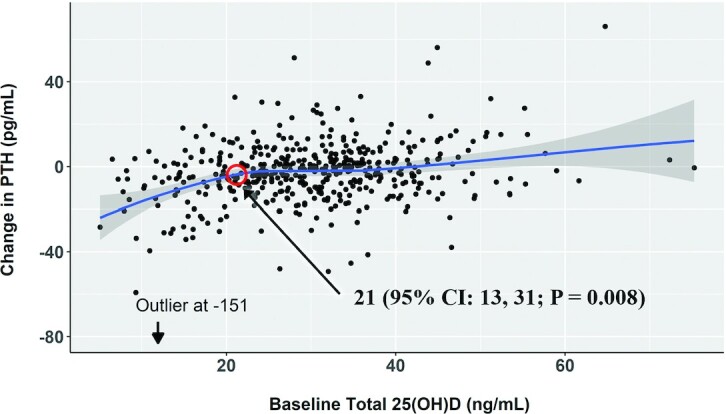
Results: Among 666 participants randomly assigned (mean age: 72 y; 53% female; 66% racial/ethnic minority), 611 (92%) completed the study. The mean (SD) change in PTH was -3 (16) pg/mL with vitamin D3 compared with 2 (18) pg/mL with placebo (estimated mean difference: -5; 95% CI: -8, -2 pg/mL). Within the vitamin D3 group, lower baseline 25-hydroxyvitamin D [25(OH)D] was associated with a larger decline in PTH in a nonlinear fashion. With baseline 25(OH)D ≥30 ng/mL as the reference, 25(OH)D <20 ng/mL was associated with a larger decline in PTH with vitamin D3 supplementation (-10; 95% CI: -15, -6 pg/mL), whereas 25(OH)D of 20-30 ng/mL was not (-2; 95% CI: -6, 1 pg/mL). A segmented threshold model identified a baseline 25(OH)D concentration of 21 (95% CI: 13, 31) ng/mL as an inflection point for difference in change in PTH. Race/ethnicity, BMI, and eGFR did not modify vitamin D treatment response. There was no significant change in 1,25(OH)2D in either treatment group.
Conclusions: Of characteristics most commonly associated with vitamin D metabolism, only baseline 25(OH)D <20 ng/mL modified the PTH response to vitamin D supplementation, providing support from a clinical trial to use this threshold to define insufficiency. This trial was registered at clinicaltrials.gov as NCT02925195.
Keywords: HbA1c harmonization program; cholecalciferol; randomized clinical trial; standardization; vitamin D; vitamin D deficiency; vitamin D insufficiency; vitamin D standardization program.
© The Author(s) 2021. Published by Oxford University Press on behalf of the American Society for Nutrition.
Figures
References
-
- Rosen CJ. Clinical practice. Vitamin D insufficiency. N Engl J Med. 2011;364(3):248–54. - PubMed
-
- Holick MF. Vitamin D deficiency. N Engl J Med. 2007;357(3):266–81. - PubMed
-
- Bhambri R, Naik V, Malhotra N, Taneja S, Rastogi S, Ravishanker U, Mithal A. Changes in bone mineral density following treatment of osteomalacia. J Clin Densitom. 2006;9(1):120–7. - PubMed
-
- Thacher TD, Fischer PR, Pettifor JM, Lawson JO, Isichei CO, Reading JC, Chan GM.. A comparison of calcium, vitamin D, or both for nutritional rickets in Nigerian children. N Engl J Med. 1999;341(8):563–8. - PubMed
Publication types
MeSH terms
Substances
Associated data
Grants and funding
LinkOut - more resources
Full Text Sources
Medical
Research Materials
Miscellaneous
