

SC-MEB: spatial clustering with hidden Markov random field using empirical Bayes
- PMID: 34849574
- PMCID: PMC8690176
- DOI: 10.1093/bib/bbab466
SC-MEB: spatial clustering with hidden Markov random field using empirical Bayes
Abstract
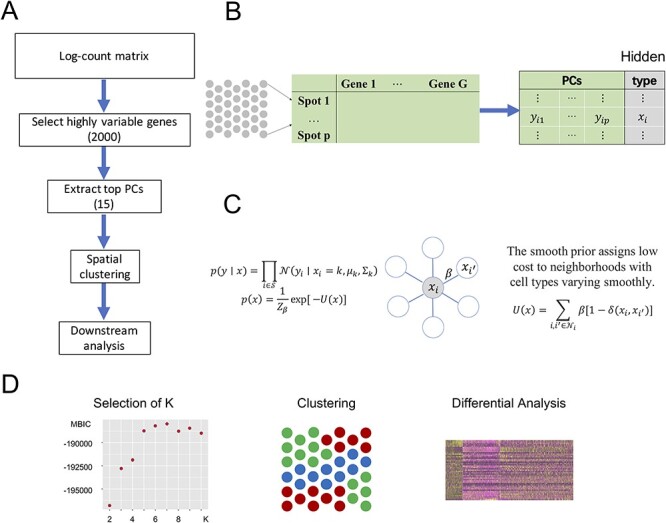
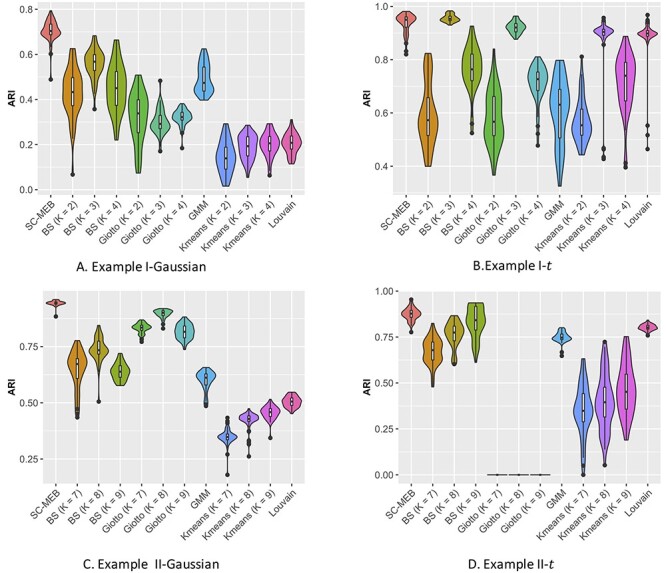
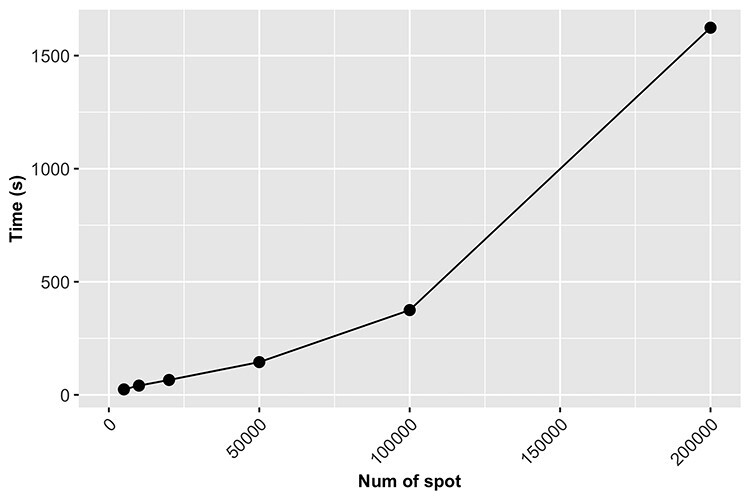
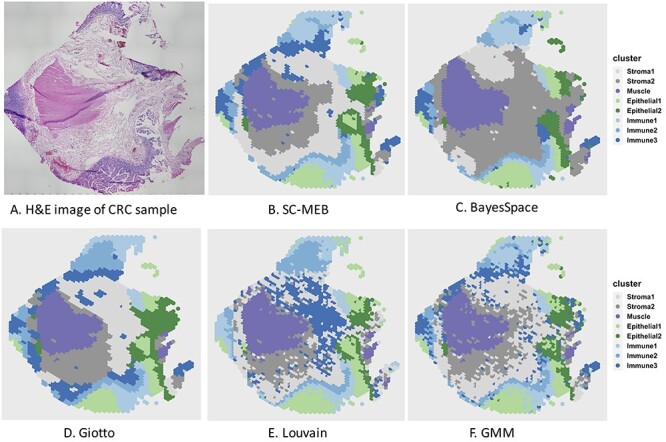
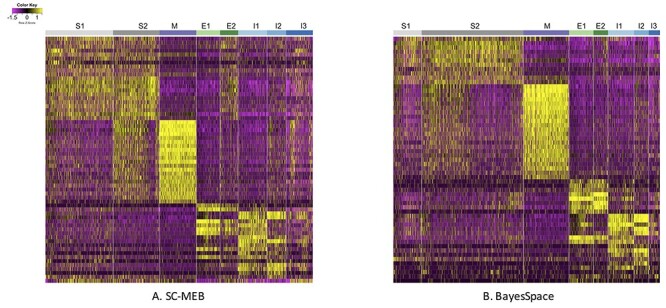
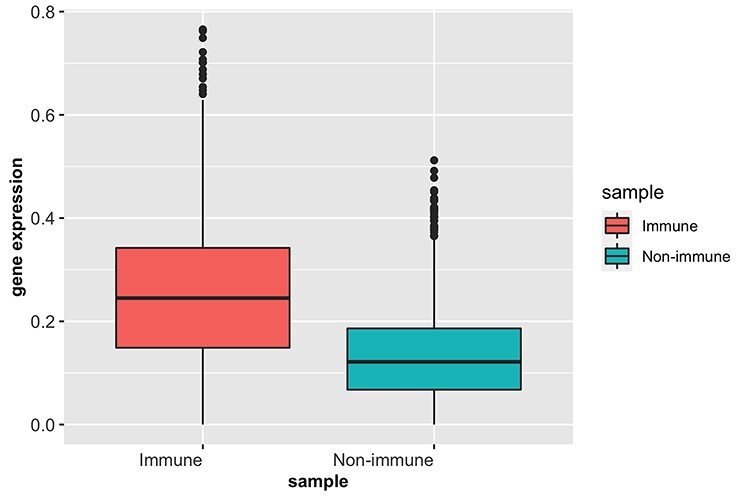
Spatial transcriptomics has been emerging as a powerful technique for resolving gene expression profiles while retaining tissue spatial information. These spatially resolved transcriptomics make it feasible to examine the complex multicellular systems of different microenvironments. To answer scientific questions with spatial transcriptomics and expand our understanding of how cell types and states are regulated by microenvironment, the first step is to identify cell clusters by integrating the available spatial information. Here, we introduce SC-MEB, an empirical Bayes approach for spatial clustering analysis using a hidden Markov random field. We have also derived an efficient expectation-maximization algorithm based on an iterative conditional mode for SC-MEB. In contrast to BayesSpace, a recently developed method, SC-MEB is not only computationally efficient and scalable to large sample sizes but is also capable of choosing the smoothness parameter and the number of clusters. We performed comprehensive simulation studies to demonstrate the superiority of SC-MEB over some existing methods. We applied SC-MEB to analyze the spatial transcriptome of human dorsolateral prefrontal cortex tissues and mouse hypothalamic preoptic region. Our analysis results showed that SC-MEB can achieve a similar or better clustering performance to BayesSpace, which uses the true number of clusters and a fixed smoothness parameter. Moreover, SC-MEB is scalable to large 'sample sizes'. We then employed SC-MEB to analyze a colon dataset from a patient with colorectal cancer (CRC) and COVID-19, and further performed differential expression analysis to identify signature genes related to the clustering results. The heatmap of identified signature genes showed that the clusters identified using SC-MEB were more separable than those obtained with BayesSpace. Using pathway analysis, we identified three immune-related clusters, and in a further comparison, found the mean expression of COVID-19 signature genes was greater in immune than non-immune regions of colon tissue. SC-MEB provides a valuable computational tool for investigating the structural organizations of tissues from spatial transcriptomic data.
Keywords: cell phenotype; empirical Bayes; expectation-maximization algorithm; hidden Markov random field; spatial transcriptomics.
© The Author(s) 2021. Published by Oxford University Press. All rights reserved. For Permissions, please email: journals.permissions@oup.com.
Figures
References
-
- Besag J. Spatial interaction and the statistical analysis of lattice systems. J R Stat Soc B Methodol 1974; 36(2): 192–225.
-
- Besag J. On the statistical analysis of dirty pictures. J R Stat Soc B Methodol 1986; 48(3): 259–79.
-
- Bishop CM. Pattern recognition and machine learning. springer, 2006.
-
- Burgess DJ. Spatial transcriptomics coming of age. Nat Rev Genet 2019; 20(6): 317–7. - PubMed
Publication types
MeSH terms
Grants and funding
LinkOut - more resources
Full Text Sources
Medical
