. 2021 Dec 16;144(11):3340-3354.
doi: 10.1093/brain/awab225.

Six-dimensional dynamic tractography atlas of language connectivity in the developing brain

Affiliations

Six-dimensional dynamic tractography atlas of language connectivity in the developing brain

Masaki Sonoda et al. Brain. .

Abstract

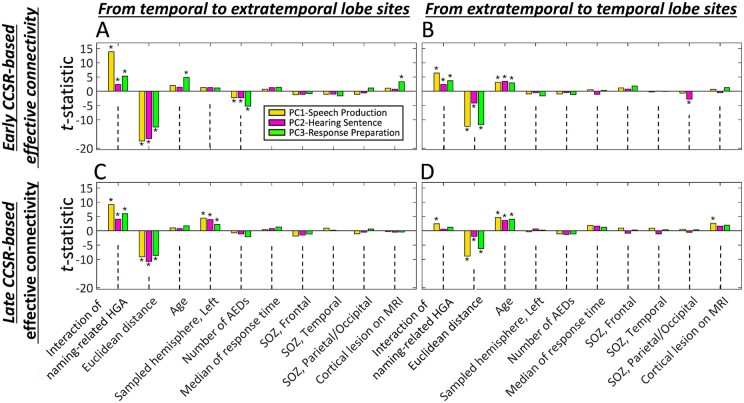
During a verbal conversation, our brain moves through a series of complex linguistic processing stages: sound decoding, semantic comprehension, retrieval of semantically coherent words, and overt production of speech outputs. Each process is thought to be supported by a network consisting of local and long-range connections bridging between major cortical areas. Both temporal and extratemporal lobe regions have functional compartments responsible for distinct language domains, including the perception and production of phonological and semantic components. This study provides quantitative evidence of how directly connected inter-lobar neocortical networks support distinct stages of linguistic processing across brain development. Novel six-dimensional tractography was used to intuitively visualize the strength and temporal dynamics of direct inter-lobar effective connectivity between cortical areas activated during each linguistic processing stage. We analysed 3401 non-epileptic intracranial electrode sites from 37 children with focal epilepsy (aged 5-20 years) who underwent extra-operative electrocorticography recording. Principal component analysis of auditory naming-related high-gamma modulations determined the relative involvement of each cortical area during each linguistic processing stage. To quantify direct effective connectivity, we delivered single-pulse electrical stimulation to 488 temporal and 1581 extratemporal lobe sites and measured the early cortico-cortical spectral responses at distant electrodes. Mixed model analyses determined the effects of naming-related high-gamma co-augmentation between connecting regions, age, and cerebral hemisphere on the strength of effective connectivity independent of epilepsy-related factors. Direct effective connectivity was strongest between extratemporal and temporal lobe site pairs, which were simultaneously activated between sentence offset and verbal response onset (i.e. response preparation period); this connectivity was approximately twice more robust than that with temporal lobe sites activated during stimulus listening or overt response. Conversely, extratemporal lobe sites activated during overt response were equally connected with temporal lobe language sites. Older age was associated with increased strength of inter-lobar effective connectivity especially between those activated during response preparation. The arcuate fasciculus supported approximately two-thirds of the direct effective connectivity pathways from temporal to extratemporal auditory language-related areas but only up to half of those in the opposite direction. The uncinate fasciculus consisted of <2% of those in the temporal-to-extratemporal direction and up to 6% of those in the opposite direction. We, for the first time, provided an atlas which quantifies and animates the strength, dynamics, and direction specificity of inter-lobar neural communications between language areas via the white matter pathways. Language-related effective connectivity may be strengthened in an age-dependent manner even after the age of 5.

Keywords: cortico-cortical evoked potentials; dynamic DWI tractography; high-gamma activity; intracranial electroencephalography; paediatric epilepsy surgery.


Figures

Figure 1
Figure 1
Spatial distribution of subdural electrode sampling. (A) The surface image presents the spatial distribution of analysed electrodes on each hemisphere. Colour indicates the number of patients available at a given spatial point. A total of 3401 non-epileptic artefact-free electrode sites were included in the analysis. (B) The spatial distribution of 488 stimulus sites in the temporal lobe used for the assessment of CCSR-based temporal to extratemporal lobe connectivity. (C) The spatial distribution of 1581 stimulus sites in the extratemporal lobe used for the assessment of the connectivity in the opposite direction.
Figure 2
Figure 2
Auditory naming task and the time windows incorporated in the PCA. (A) Patients were instructed to give overt verbal answers to each of the auditory sentence questions (median duration of question sentence: 1.8 s; range: 1.2 to 2.4 s). Naming-related high-gamma activity during each 300 ms window was normalized as a relative value to the pre-trial baseline. (B) To determine what linguistic stages a given electrode channel was involved in, we employed a PCA to high-gamma modulations during six 300 ms time windows, that include three 300 ms periods during stimulus listening, two 300 ms periods between stimulus offset and response onset, as well as a 300 ms period immediately after overt response onset.
Figure 3
Figure 3
Linguistic stage categorization based on a PCA of naming-related high gamma modulations. (A) This heat map presents the contributions (as reflected by the principal component coefficients) of naming-related high-gamma modulation during each 300 ms window to the principal components (PCs). (B) The first three principal components account for ∼95% of the variance (broken line) in high-gamma temporal patterns (red line). (C) Relative contribution of principal components 1–3 to each time window. (DF) The spatial distribution of each principal component. A colour is displayed at sites where ≥4 patients’ data were available.
Figure 4
Figure 4
Workflow to quantify inter-lobar effective connectivity based on CCSRs. (A) CCEPs: Averaged ECoG trace and single-trial ECoG traces are aligned to the onset of SPES. (B) To identify significant CCSRs, a time-frequency transformation followed by a cluster-based permutation test was employed for the 2 to 60 Hz and −50 to +300 ms time-frequency range (pink square). (i) Early CCSR: within 20 to 60 Hz and +10 and +50 ms (white dashed square)., This time-frequency range was largely free of stimulation-related broadband artefacts (yellow arrow). (ii) Late CCSR: within 2 and 20 Hz and +50 and +300 ms (white dotted square). (C) Early CCSR peaks were taken as evidence of direct effective connectivity; late CCSRs peaks were taken as evidence of secondary effective connectivity.
Figure 5
Figure 5
Mixed model-based prediction of the strength of early and late CCSR-defined effective connectivity. The bar graphs show the effects of variables for predicting the strength of (A and B) early CCSR-defined and (C and D) late CCSR-defined inter-lobar effective connectivity between language sites supporting the same linguistic stages. (A and C) Prediction of effective connectivity in the temporal to extratemporal lobe direction. (B and D) Connectivity in the opposite direction. Bars indicate the effect of predictors in each principal component-defined network: Yellow bars: PC1-SpeechProduction. Pink bars: PC2-HearingSentence. Green bars: PC3-ResponsePreparation. *FDR-corrected P-value < 0.05. HGA = high-gamma activity; PC = principal component; SOZ = seizure onset zone.
Figure 6
Figure 6
Direct inter-lobar effective connectivity across sites supporting overlapping linguistic stages. (A and B) The statistical effect (i.e. mixed model t-values) of naming-related high-gamma activity (HGA) interaction between sites supporting the same and different principal component (PC) language sites on the strength of direct inter-lobar effective connectivity. *FDR-corrected P <0.05. (C) The effect size (i.e. significant mixed model estimate value) of naming-related high-gamma activity interaction on the strength of direct inter-lobar effective connectivity is indicated by the arrowhead length and the arrow width (a–n). Connectivity direction is presented by arrow colour: white = a temporal-to-extratemporal direction; purple = the opposite direction. For example, effective connectivity to PC3-ResponsePreparation extratemporal language sites was strongest from the PC3-ResponsePreparation temporal lobe sites (white arrow e; effect size = +106.1%) while small from the PC1-SpeechProduction temporal lobe sites (white arrow i; effect size = +61.0%) and the PC2-HearingSentence temporal lobe sites (white arrow c; effect size = +48.2%). Effective connectivity to the PC3-ResponsePreparation temporal lobe sites was strongest from the PC3-ResponsePreparation extratemporal lobe sites (purple arrow f; effect size = +254.3%) while moderate from the PC1-SpeechProduction extratemporal lobe sites (purple arrow h; effect size = +99.5%) and the PC2-HearingSentence extratemporal lobe sites (purple arrow d; effect size = +169.4%).
Figure 7
Figure 7
Snapshots of 6D dynamic tractography. The snapshots of each animation demonstrate the trajectories of rapid neural propagations elicited by SPES and its relationship to naming-related high-gamma modulations at the stimulus and recording sites. Each plot displays group-level effective connectivity data derived from 27 patients. The streamline colour reflects the interaction (i.e. multiplication) of high-gamma activity (HGA) at temporal and extratemporal lobe sites during a given linguistic stage. Thus, red streamlines reflect high-gamma co-augmentation at both stimulus and recording sites, whereas blue streamlines indicate high-gamma augmentation at the stimulus sites but attenuation at the recording sites. The size of each white dot reflects the strength of effective connectivity rated by the magnitude of significant early CCSR local peak. Each white dot indicates the location of stimulation-induced neural propagation estimated by the propagation velocity. To optimize visibility, each movie delineates the effective connectivity pathways satisfying the following criteria: (i) stimulus sites with naming-related high-gamma augmentation during a specific PCA-based linguistic stage; (ii) the interaction of naming-related high-gamma activity was ≥|±200|; and (iii) a given streamline was associated with a significant early CCSR. (AC) Temporal to extratemporal lobe propagations (Supplementary Video 1). (DF) Extratemporal to temporal lobe propagations (Supplementary Video 2). (A and D) Neural propagations elicited by stimulation of PC1-SpeechProduction language sites. (B and E) PC2-HearingSentence. (C and F) PC3-ResponsePreparation. Supplementary Videos 1 and 2 are available at https://doi.org/10.6084/m9.figshare.14766093.v1.

References

    1. Hamberger MJ, Seidel WT, Mckhann GM, Perrine K, Goodman RR.. Brain stimulation reveals critical auditory naming cortex. Brain. 2005;128(Pt 11):2742–2749. - PubMed
    1. Hickok G, Poeppel D.. The cortical organization of speech processing. Nat Rev Neurosci. 2007;8(5):393–402. - PubMed
    1. Rauschecker JP, Scott SK.. Maps and streams in the auditory cortex: Nonhuman primates illuminate human speech processing. Nat Neurosci. 2009;12(6):718–724. - PMC - PubMed
    1. Chang EF, Raygor KP, Berger MS.. Contemporary model of language organization: An overview for neurosurgeons. J Neurosurg. 2015;122(2):250–261. - PubMed
    1. Nakai Y, Jeong J, Brown EC, et al.Three- and four-dimensional mapping of speech and language in patients with epilepsy. Brain. 2017;140(5):1351–1370. - PMC - PubMed

Publication types