Impaired Hearing and Altered Subplate Circuits During the First and Second Postnatal Weeks of Otoferlin-Deficient Mice
- PMID: 34849612
- PMCID: PMC9247410
- DOI: 10.1093/cercor/bhab383
Impaired Hearing and Altered Subplate Circuits During the First and Second Postnatal Weeks of Otoferlin-Deficient Mice
Abstract
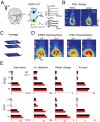
Sensory deprivation from the periphery impacts cortical development. Otoferlin deficiency leads to impaired cochlear synaptic transmission and is associated with progressive hearing loss in adults. However, it remains elusive how sensory deprivation due to otoferlin deficiency impacts the early development of the auditory cortex (ACX) especially before the onset of low threshold hearing. To test that, we performed in vivo imaging of the ACX in awake mice lacking otoferlin (Otof-/-) during the first and second postnatal weeks and found that spontaneous and sound-driven cortical activity were progressively impaired. We then characterized the effects on developing auditory cortical circuits by performing in vitro recordings from subplate neurons (SPN), the first primary targets of thalamocortical inputs. We found that in Otof-/- pups, SPNs received exuberant connections from excitatory and inhibitory neurons. Moreover, as a population, SPNs showed higher similarity with respect to their circuit topology in the absence of otoferlin. Together, our results show that otoferlin deficiency results in impaired hearing and has a powerful influence on cortical connections and spontaneous activity in early development even before complete deafness. Therefore, peripheral activity has the potential to sculpt cortical structures from the earliest ages, even before hearing impairment is diagnosed.
Keywords: auditory cortex; development; otoferlin; plasticity; subplate.
© The Author(s) 2021. Published by Oxford University Press. All rights reserved. For permissions, please e-mail: journals.permissions@oup.com.
Figures


Similar articles
-
Early retinal deprivation crossmodally alters nascent subplate circuits and activity in the auditory cortex during the precritical period.Cereb Cortex. 2023 Jul 5;33(14):9038-9053. doi: 10.1093/cercor/bhad180. Cereb Cortex. 2023. PMID: 37259176 Free PMC article.
-
Topographic map refinement and synaptic strengthening of a sound localization circuit require spontaneous peripheral activity.J Physiol. 2019 Nov;597(22):5469-5493. doi: 10.1113/JP277757. Epub 2019 Oct 26. J Physiol. 2019. PMID: 31529505
-
Development of synaptic fidelity and action potential robustness at an inhibitory sound localization circuit: effects of otoferlin-related deafness.J Physiol. 2022 May;600(10):2461-2497. doi: 10.1113/JP280403. Epub 2022 Apr 28. J Physiol. 2022. PMID: 35439328
-
Changing subplate circuits: Early activity dependent circuit plasticity.Front Cell Neurosci. 2023 Jan 11;16:1067365. doi: 10.3389/fncel.2022.1067365. eCollection 2022. Front Cell Neurosci. 2023. PMID: 36713777 Free PMC article.
-
The Many Faces of DFNB9: Relating OTOF Variants to Hearing Impairment.Genes (Basel). 2020 Nov 26;11(12):1411. doi: 10.3390/genes11121411. Genes (Basel). 2020. PMID: 33256196 Free PMC article. Review.
Cited by
-
Bilateral widefield calcium imaging reveals circuit asymmetries and lateralized functional activation of the mouse auditory cortex.Proc Natl Acad Sci U S A. 2023 Jul 25;120(30):e2219340120. doi: 10.1073/pnas.2219340120. Epub 2023 Jul 17. Proc Natl Acad Sci U S A. 2023. PMID: 37459544 Free PMC article.
-
Early retinal deprivation crossmodally alters nascent subplate circuits and activity in the auditory cortex during the precritical period.Cereb Cortex. 2023 Jul 5;33(14):9038-9053. doi: 10.1093/cercor/bhad180. Cereb Cortex. 2023. PMID: 37259176 Free PMC article.
-
Specific functional connectivity of molecular subtypes of subplate and layer 6b neurons.J Neurosci. 2025 Mar 14;45(18):e2094242025. doi: 10.1523/JNEUROSCI.2094-24.2025. Online ahead of print. J Neurosci. 2025. PMID: 40086874
-
Distinct distribution of subplate neuron subtypes between the sensory cortices during the early postnatal period.J Comp Neurol. 2024 Feb;532(2):e25594. doi: 10.1002/cne.25594. J Comp Neurol. 2024. PMID: 38407509 Free PMC article.
-
Molecular Cascades That Build and Connect Auditory Neurons from Hair Cells to the Auditory Cortex.J Exp Neurol. 2025;6(3):111-120. J Exp Neurol. 2025. PMID: 40823538 Free PMC article.
References
-
- Adato A, Raskin L, Petit C, Bonne-Tamir B. 2000. Deafness heterogeneity in a Druze isolate from the Middle East: novel OTOF and PDS mutations, low prevalence of GJB2 35delG mutation and indication for a new DFNB locus. Eur J Hum Genet. 8:437–442. - PubMed
-
- Azaiez H, Thorpe RK, Smith RJH. 1993. In: Adam MP, Ardinger HH, Pagon RA, Wallace SE, LJH B, Mirzaa G, Amemiya A, editors. OTOF-related deafness. Seattle (WA): GeneReviews((R)). - PubMed
Publication types
MeSH terms
Substances
Grants and funding
LinkOut - more resources
Full Text Sources
Molecular Biology Databases

