. 2022 Jun 16;32(13):2831-2842.
doi: 10.1093/cercor/bhab384.

Scaling Principles of White Matter Connectivity in the Human and Nonhuman Primate Brain

Affiliations

Scaling Principles of White Matter Connectivity in the Human and Nonhuman Primate Brain

Dirk Jan Ardesch et al. Cereb Cortex. .

Abstract

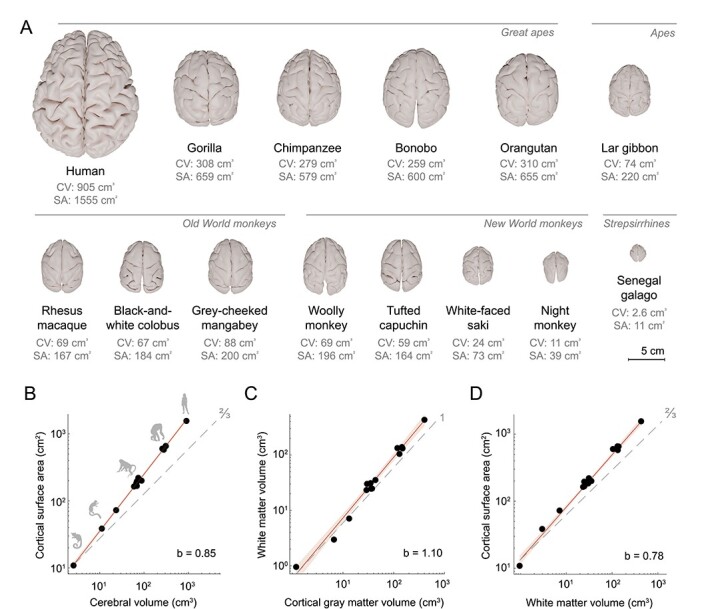
Brains come in many shapes and sizes. Nature has endowed big-brained primate species like humans with a proportionally large cerebral cortex. Comparative studies have suggested, however, that the total volume allocated to white matter connectivity-the brain's infrastructure for long-range interregional communication-does not keep pace with the cortex. We investigated the consequences of this allometric scaling on brain connectivity and network organization. We collated structural and diffusion magnetic resonance imaging data across 14 primate species, describing a comprehensive 350-fold range in brain size across species. We show volumetric scaling relationships that indeed point toward a restriction of macroscale connectivity in bigger brains. We report cortical surface area to outpace white matter volume, with larger brains showing lower levels of overall connectedness particularly through sparser long-range connectivity. We show that these constraints on white matter connectivity are associated with longer communication paths, higher local network clustering, and higher levels of asymmetry in connectivity patterns between homologous areas across the left and right hemispheres. Our findings reveal conserved scaling relationships of major brain components and show consequences for macroscale brain circuitry, providing insights into the connectome architecture that could be expected in larger brains such as the human brain.

Keywords: allometry; connectome; evolution; neuroimaging; specialization.


Figures

Figure 1
Figure 1
Phylogram of divergence times in million years ago (mya) for the primate species included in this study. Phylogeny was estimated from a consensus tree based on genotyping data of seventeen genes using version 3 of the 10kTrees project (Arnold et al. 2010). Images from phylopic.org.
Figure 2
Figure 2
Scaling relationships of the cerebrum. (A) Cortical surface reconstructions (to scale). Cerebral volume and cortical surface area were computed from the structural T1 and T2* MRI datasets. (B) Scaling between cortical surface area and cerebral volume shows a strong positive allometric relationship. (C) White matter volume scales with positive allometry on cortical gray matter volume. (D) Cortical surface area scales with positive allometry on white matter volume. In plots (BD), the dashed gray line indicates isometric scaling and is annotated with the expected slope for isometric scaling between a surface and a volume (two-thirds) or between two volumes (1). 95% confidence bands are plotted in red to indicate positive allometry. Scaling formula: log(y) = b · log(x) + intercept.
Figure 3
Figure 3
Scaling relationships of long-range connectivity. (A) Heatmap showing the proportion of connections that fall in each of 10 connection length bins for the included species. Larger brains (top rows) show low proportions of long connections (light colors in the top-right corner), while smaller brains display a more equal distribution (bottom rows). Length bins were normalized to the anterior–posterior distance of each species’ brain for cross-species comparison, with shorter connections on the left side of the heatmap and longer connections on the right side. The included species are sorted on increasing cerebral volume from the Senegal galago (bottom) to the human brain (top). (B) Segmentation of the cross-sectional area of the CC (yellow overlay) in a sagittal slice of the Senegal galago, tufted capuchin, chimpanzee, and human brain (not to scale). (C) CC cross-sectional area scales with negative allometry on cortical surface area. The dashed gray line indicates the expected slope of 1 for isometric scaling between two surfaces. 95% confidence band is plotted in blue indicating negative allometry.
Figure 4
Figure 4
Scaling relationships of network metrics. (A) Characteristic path length of the left hemisphere plotted against cerebral volume (normalized to 1000 degree-preserved randomized reference networks). (B) Clustering coefficient of the left hemisphere plotted against cerebral volume (normalized to 1000 degree-preserved randomized reference networks). (C) Mean connectivity asymmetry of spatially homologous regions in the left versus the right hemispheres, plotted against cerebral volume. Inset: null distribution of the association between connectivity profile asymmetry and cerebral volume after randomly shuffling the connection weights (1000 permutations) (de Lange, Ardesch, et al. 2019). The dashed red line represents the observed regression coefficient as depicted in the main figure. The toy network in the top panel depicts two spatially homologous regions (middle nodes) with asymmetrical patterns of connectivity strength (difference in connection thickness between left and right). In the scatter plots of (AC), 95% confidence bands are plotted in gray.

References

    1. Aboitiz F, Scheibel AB, Fisher RS, Zaidel E. 1992. Fiber composition of the human corpus callosum. Brain Res. 598(1–2):143–153. 10.1016/0006-8993(92)90178-c. - DOI - PubMed
    1. Allman JM, Tetreault NA, Hakeem AY, Manaye KF, Semendeferi K, Erwin JM, Park S, Goubert V, Hof PR. 2010. The von Economo neurons in frontoinsular and anterior cingulate cortex in great apes and humans. Brain Struct Funct. 214(5–6):495–517. 10.1007/s00429-010-0254-0. - DOI - PubMed
    1. Ardesch DJ, Scholtens LH, van den Heuvel MP. 2019. The human connectome from an evolutionary perspective. In: Hofman MA, editor. Progress in brain research. Vol 250. Cambridge, MA, USA: Elsevier. (Evolution of the Human Brain: From Matter to Mind), pp. 129–151 https://www.sciencedirect.com/science/article/pii/S0079612319301323. - PubMed
    1. Ardesch DJ, Scholtens LH, Li L, Preuss TM, Rilling JK, van den Heuvel MP. 2019. Evolutionary expansion of connectivity between multimodal association areas in the human brain compared with chimpanzees. Proc Natl Acad Sci. 116(14):7101–7106. 10.1073/pnas.1818512116. - DOI - PMC - PubMed
    1. Arnold C, Matthews LJ, Nunn CL. 2010. The 10kTrees website: a new online resource for primate phylogeny. Evol Anthropol Issues News Rev. 19(3):114–118. 10.1002/evan.20251. - DOI

Publication types